Naphthalene Derivatives Market Size and Share
Market Overview
| Study Period | 2020 - 2031 |
|---|---|
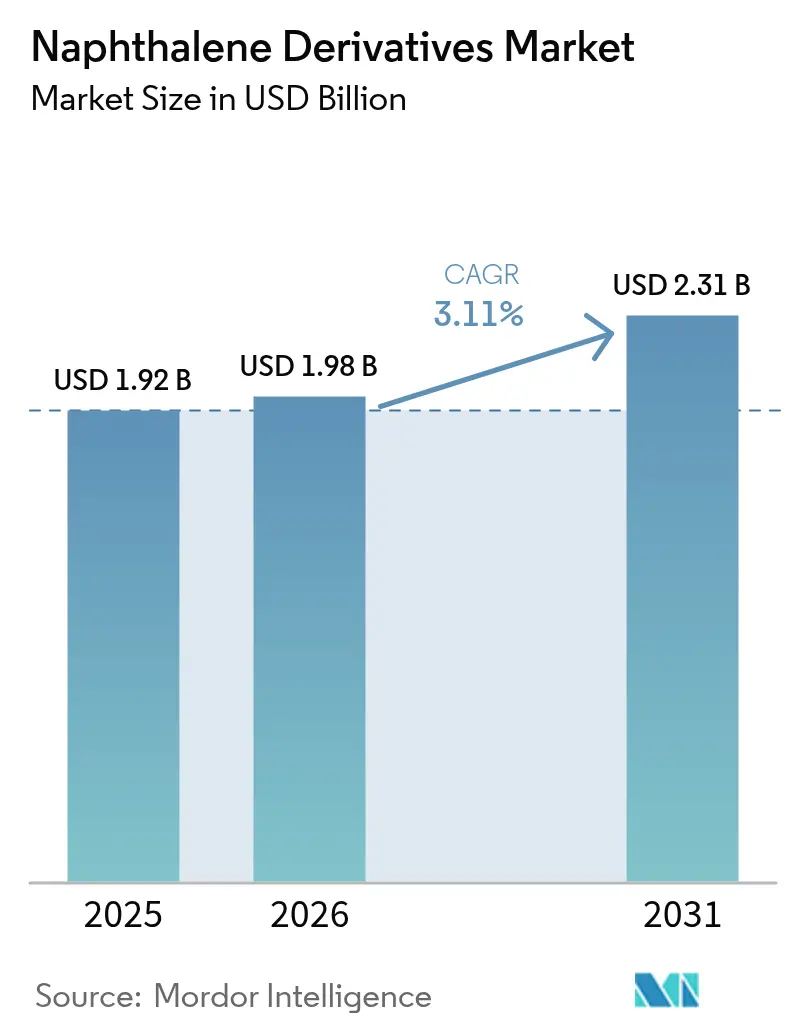
| Market Size (2026) | USD 1.98 Billion |
| Market Size (2031) | USD 2.31 Billion |
| Growth Rate (2026 - 2031) | 3.11% CAGR |
| Fastest Growing Market | Asia Pacific |
| Largest Market | Asia Pacific |
| Market Concentration | Medium |
Major Players *Disclaimer: Major Players sorted in no particular order Image © Mordor Intelligence. Reuse requires attribution under CC BY 4.0. | |
Naphthalene Derivatives Market Analysis by Mordor Intelligence
The naphthalene derivatives market size is expected to grow from USD 1.92 billion in 2025 to USD 1.98 billion in 2026 and is forecast to reach USD 2.31 billion by 2031 at 3.11% CAGR over 2026-2031. This growth rate signals a mature but resilient landscape where sustained construction demand offsets regulatory pressures. Coal-tar dependence still dominates feedstock strategies, yet producers increasingly diversify into petroleum and renewable streams to hedge supply risk. Electronics applications, particularly battery electrolytes and graphene dispersants, now shape premium revenue pools and influence R&D priorities. At the same time, regulatory initiatives under TSCA and REACH elevate compliance costs, creating a competitive advantage for vertically integrated players that can fund emission-control upgrades while preserving market reach in Asia-Pacific, North America, and Europe. Asia-Pacific remains the volume anchor, but supply chain realignments and sustainability mandates in the West continue to nudge product portfolios toward higher-purity, higher-margin specialties across the naphthalene derivatives market.
Key Report Takeaways
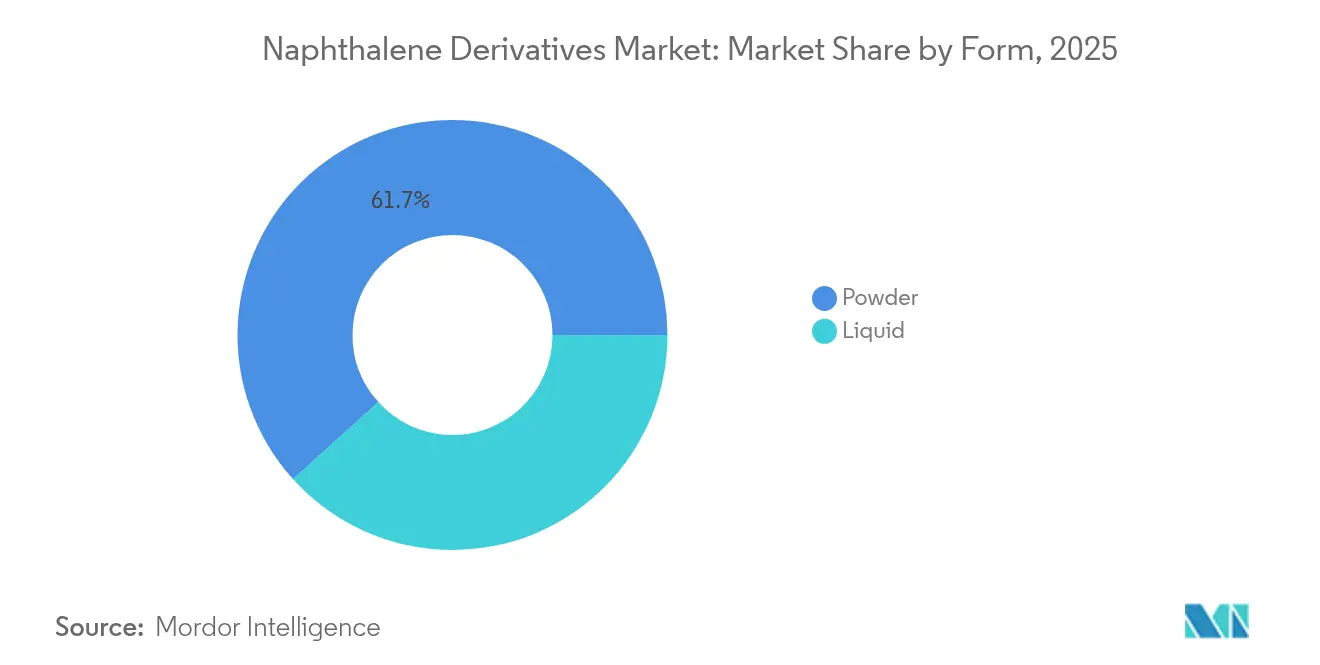
- By form, powder products accounted for 61.71% of the naphthalene derivatives market size in 2025; liquid forms are forecast to expand at 3.66% CAGR to 2031.
- By source, coal tar supplied 57.02% of the 2025 volume, but other sources are growing at 3.92% CAGR through 2031.
- By derivative, sulphonated naphthalene formaldehyde led with 43.48% of the 2025 naphthalene derivatives market share, while NDCA & high purity naphthols are projected to grow at a 3.55% CAGR through 2031.
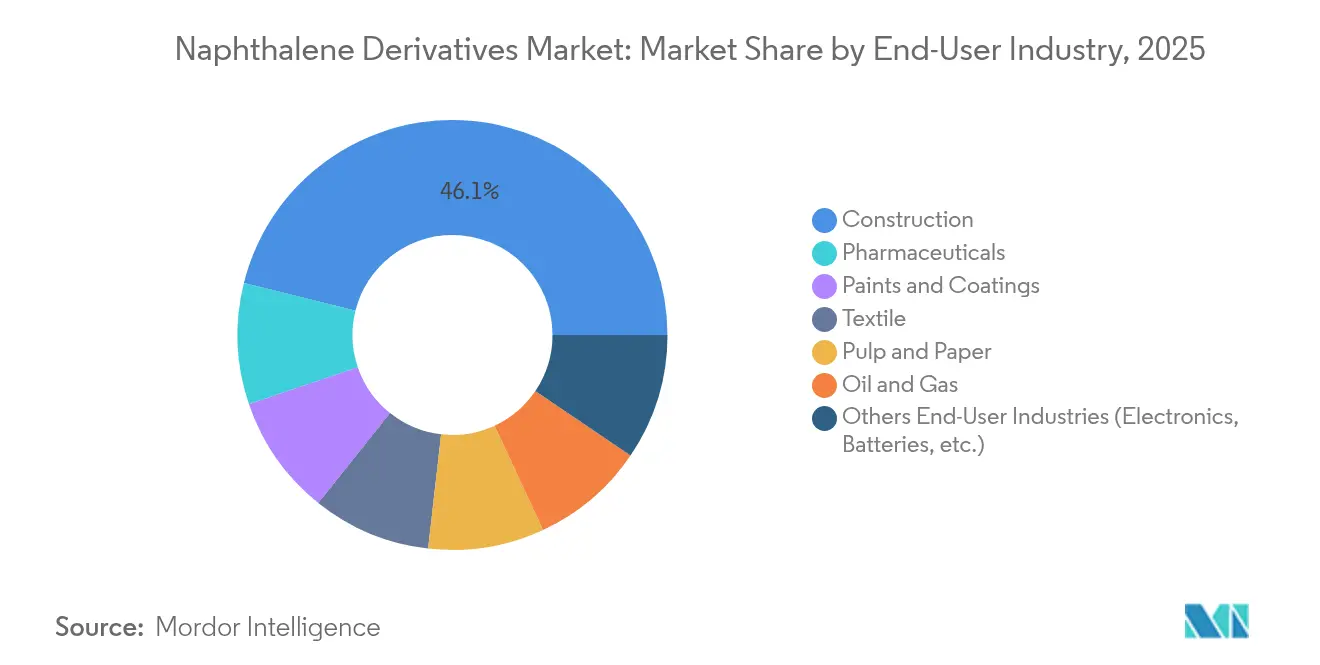
- By end-user industry, construction commanded 46.11% revenue share in 2025; electronics and batteries are expected to log the fastest 4.02% CAGR between 2026 and 2031.
- By geography, Asia-Pacific held 53.35% of the 2025 volume and is on track for a 4.06% CAGR, thanks to infrastructure programs and electronics manufacturing growth.
Note: Market size and forecast figures in this report are generated using Mordor Intelligence’s proprietary estimation framework, updated with the latest available data and insights as of 2026.
Global Naphthalene Derivatives Market Trends and Insights
Driver Impact Analysis*
| Driver | (~) % Impact on CAGR Forecast | Geographic Relevance | Impact Timeline |
|---|---|---|---|
| Expanding construction demand for naphthalene-based super-plasticizers | +1.2% | Global, with APAC leading | Long term (≥ 4 years) |
| Rising consumption in textile dye intermediates | +0.8% | APAC core, spill-over to MEA | Medium term (2-4 years) |
| Surging demand for phthalic anhydride plasticizers | +0.6% | North America & EU, expanding to APAC | Medium term (2-4 years) |
| Growth of agrochemical wetting-agent applications | +0.4% | Global, concentrated in agricultural regions | Long term (≥ 4 years) |
| Adoption in graphene & advanced composite dispersants | +0.3% | North America & EU, early APAC adoption | Long term (≥ 4 years) |
| Source: Mordor Intelligence | |||
Expanding Construction Demand for Naphthalene-Based Superplasticizers
Global infrastructure upgrades extend the life of the naphthalene derivatives market by underpinning steady SNF throughput. Field trials show SNF dosing near 0.9% combined with 20% silica fume improves compressive strength and workability in ultra-high-performance concrete. China’s stimulus packages worth more than USD 1.3 trillion steer a large share toward rail, bridge, and public-housing programs, keeping regional demand buoyant[1]American Chemical Society Staff, “Asia Builds More Aromatics Plants,” Chemical & Engineering News, cen.acs.org. Developers prefer SNF because its performance is robust under extreme temperature swings, a requirement in megaprojects across Asia and the Middle East. Stable pricing for SNF helps contractors contain budget overruns, sustaining order volumes even when other derivative categories fluctuate. Consequently, construction remains the demand floor for the naphthalene derivatives market through the decade.
Rising Consumption in Textile Dye Intermediates
Textile production rebound across South and Southeast Asia has restored the purchasing of naphthol and naphthalene sulphonic acid. India’s specialty-chemicals revenue path to USD 50 billion by 2025 feeds a growing base of high-performance dye plants that favor naphthalene-based intermediates for superior colorfastness. Despite margin pressure, consolidation among Chinese dye makers funnels output into fewer, larger facilities that value consistent supply security. Regional free-trade pacts also incentivize local sourcing, reducing exposure to ocean freight volatility. This textile-dye pull supports incremental volume on top of construction base demand, ensuring diversified growth for the naphthalene derivatives market.
Surging Demand for Phthalic Anhydride Plasticizers
Automotive lightweighting and flexible-packaging needs preserve a market for phthalic anhydride, although some traditional phthalates face regulatory headwinds. India records 7.9% annual consumption growth as downstream PVC and polyester resin plants expand capacity. On the supply side, Koppers’ plan to exit phthalic anhydride output at Stickney in mid-2025 will remove 160,000 t of annual capacity and alleviate oversupply, a shift that could firm prices for remaining producers. Bio-based phthalic anhydride routes, using iso-butyric fermentation or renewable naphtha, fetch premium margins and appeal to ESG-focused brand owners. This balance of traditional and bio-based demand sustains another leg of growth within the naphthalene derivatives market.
Growth of Agrochemical Wetting-Agent Applications
Crop-protection formulations increasingly specify alkyl naphthalene sulphonate salts to enhance spray dispersion at lower surfactant loadings. China’s agrochemical capacity additions since its 13th Five-Year Plan boost annual output by 1.2 million t and create downstream pull for dispersants. Precision-agriculture tools that reduce pesticide waste require surfactants that maintain uniform droplet size; naphthalene chemistry meets that need while showing acceptable biodegradability profiles. Export-oriented formulators in India and Brazil value the compatibility of these wetting agents with a wide pH window, limiting re-formulation work across markets. As acreage under intensive cultivation rises, agrochemical use will continue to lift the naphthalene derivatives market.
Restraint Impact Analysis*
| Restraint | (~) % Impact on CAGR Forecast | Geographic Relevance | Impact Timeline |
|---|---|---|---|
| Carcinogenic-toxicity regulations | -0.9% | Global, with EU and North America leading | Short term (≤ 2 years) |
| Coal-tar supply & price volatility | -0.7% | Global, particularly APAC manufacturing hubs | Medium term (2-4 years) |
| Substitution by bio-based/polycarboxylate super-plasticizers | -0.5% | Europe and North America, expanding globally | Long term (≥ 4 years) |
| Source: Mordor Intelligence | |||
Carcinogenic-Toxicity Regulations
The EU’s Revision of Annex XVII to REACH now caps polycyclic-aromatic-hydrocarbon emissions from clay targets and similar articles by April 2026, effectively mandating 99% reductions for naphthalene content. In the United States, the EPA began a formal risk evaluation of naphthalene in December 2024, broadening data-collection obligations and foreshadowing stricter workplace-exposure limits[2]U.S. Environmental Protection Agency, “Risk Evaluation for Naphthalene,” epa.gov. The CDC updated its toxicological profile, spotlighting hemolytic-anemia risk for populations with G6PD deficiency[3]Centers for Disease Control and Prevention, “Toxicological Profile for Naphthalene,” cdc.gov. Producers now budget for higher monitoring costs, engineering controls, and possible reformulations, expenses that weigh on profitability in the naphthalene derivatives market. Larger, diversified firms can absorb these costs, but smaller regional players may exit or seek mergers.
Coal-Tar Supply & Price Volatility
Steel-sector decarbonization constraints reduce coke-oven gas output, tightening coal-tar supply in China, South Korea, and parts of Europe. Spot quotes for industrial-grade naphthalene rose 18% during 2024’s second half as coking rates dipped, pushing downstream users to seek petroleum or renewable substitutes. The volatility complicates forward contracts and inventory planning. While refinery-sourced naphthalene improves supply diversity, its availability hinges on competitive aromatics margins and regional refining throughput. Feedstock uncertainty, therefore, erodes planning visibility across the naphthalene derivatives market until alternative supply streams scale.
*Our forecasts treat driver/restraint impacts as directional, not additive. The impact forecasts reflect baseline growth, mix effects, and variable interactions.
Segment Analysis
By Form: Powder Dominance Reflects Handling Advantages
Powder products generated 61.71% of 2025 revenue, underscoring their logistics friendliness in high-volume applications such as concrete admixtures. Powder’s lower bulk density and moisture tolerance allow long-distance shipping without caking, an advantage for construction megaprojects that draw on imported material. Cement producers also favor dry dosing because it simplifies automated batching and reduces on-site cleanup. This entrenched preference lends stability to the naphthalene derivatives market.
Liquid derivatives, expanding at a 3.66% CAGR, satisfy niche needs in pharmaceuticals, micro-electronics and specialty coatings where exact dosing and immediate dissolution matter. Their contamination risk is lower because sealed drums prevent dust ingress that can interfere with high-purity applications. Growth in battery-electrolyte additives likewise tilts toward liquid formats, supporting gradual share gain while powder remains dominant.


By Source: Coal Tar Dependency Creates Strategic Vulnerabilities
Coal tar retained a 57.02% share of the feedstock supply in 2025, enabling economical aromatics extraction via established distillation units with coke plants. The resulting price edge sustains competitiveness for bulk SNF and phthalic-anhydride chains. However, vulnerability arises as global steel production plateaus and environmental mandates target coke ovens. Diversification into petroleum-derived streams and renewable naphtha thus ranks high on executive agendas within the naphthalene derivatives market.
Alternative sources show a 3.92% CAGR, buoyed by pilot plants converting waste cooking oil into renewable naphtha and by FCC refineries that integrate aromatic recovery. Technology vendors like Topsoe report commercial interest in circular-aromatics units co-producing benzene, toluene, xylenes, and naphthalene. Although absolute volume is low, the trajectory points to a more balanced supply mix by 2031.
By Derivative: SNF Leadership Reflects Construction Demand
Sulphonated naphthalene formaldehyde secured 43.48% derivative revenue in 2025, riding infrastructure spending across Asia-Pacific and the Middle East. Its cost-performance ratio and an extensive track record in high-strength concrete keep SNF at the center of bulk consumption. Even as polycarboxylate rivals gain attention, SNF’s ease of synthesis from commodity raw materials preserves a price moat that shields volume on the naphthalene derivatives market.
High-purity naphthols and NDCA post the quickest growth, 3.55% CAGR, as semiconductor, pharmaceutical, and agrochemical users prioritize narrow-specification products. Battery-grade 1,4-naphthoquinone and sodium-naphthalide precursors command premiums, encouraging multi-step purification investments. Phthalic-anhydride derivatives face margin compression from regulatory scrutiny on ortho-phthalates, although moves to bio-based PA could restore appeal.
By End-User Industry: Electronics Growth Signals Market Evolution
Construction continued to dominate at 46.11% of 2025 revenue, reflecting ongoing urbanization and retrofits that rely on SNF flowability enhancement. Nevertheless, electronics and batteries, growing at 4.02% CAGR, increasingly shape product-development roadmaps within the naphthalene derivatives market. Demands for ultra-low metal content and high oxidative stability push suppliers to tighten purification protocols.
Paints and coatings benefit from architectural shifts toward long-life exterior finishes, tapping NDCA and naphthalene sulphonates as dispersants that improve pigment wetting. Textile industry recovery in Southeast Asia revives demand for dye intermediates, although wastewater regulations narrow the list of acceptable facilities. Although smaller in volume, pharmaceutical synthesis delivers healthy margins for GMP-compliant naphthol grades.
Geography Analysis
Asia-Pacific generated 53.35% of global volume in 2025 and is projected to log the fastest 4.06% CAGR to 2031. Government-backed megaprojects anchor construction demand in China, India, and Indonesia, while regional consumer-electronics clusters drive specialty-grade uptake. China’s refining sector processed 14.8 million barrels daily of crude in 2024, ensuring ample aromatics feedstock. The region’s aromatics build-out, adding 11.8 million t of capacity, intensifies competition and secures raw-material availability, strengthening the naphthalene derivatives market.
North America shows a mature demand profile, with steady replacement of aging bridges and highways underpinning SNF volumes. The EPA’s ongoing risk evaluation injects compliance uncertainty, encouraging producers to invest early in emission-control technologies to safeguard access. Canada’s petrochemical corridor in Alberta explores renewable-naphtha integration that could eventually supply naphthalene cuts, while Mexico’s proximity to US construction markets sustains cross-border trade in powder SNF.
Europe faces structural headwinds from high energy prices and stringent carbon regulations, yet it remains at the forefront of sustainable-chemistry innovation. BioBTX’s plan to commission a waste-to-aromatics unit by 2026 exemplifies circular-economy alignment. Germany’s R&D leadership in automotive coatings keeps specialty naphthalene derivatives on procurement lists, although suppliers must certify lower residual PAH levels to comply with REACH. Southern European infrastructure upgrades tied to EU recovery funds provide a modest uplift for SNF demand.


Competitive Landscape
The naphthalene derivatives market is moderately consolidated. Technological advancements are critical, as achieving sub-5 ppm metal content in battery-grade derivatives accelerates qualification with cathode and separator manufacturers. Sustainability is increasingly influencing procurement, with electronics OEMs requiring life-cycle assessment data. Regional production remains vital, with Asia-Pacific buyers favoring local plants to reduce lead times, while EU buyers prioritize suppliers adhering to REACH and environmental footprint regulations. Over the next five years, portfolio optimization and selective M&A are expected as companies focus on specialized niches.
Naphthalene Derivatives Industry Leaders
Cromogenia Units
Rain Carbon Inc.
Huntsman International LLC
Koppers Inc.
Himadri Specialty Chemical Ltd.
- *Disclaimer: Major Players sorted in no particular order

Recent Industry Developments
- December 2024: The Ministry of Commerce and the General Authority of Foreign Trade (GAFT) have enacted definitive anti-dumping measures on imports of Sulphonated Naphthalene Formaldehyde (SNF) from China and Russia. Effective December, 2024, these measures will remain in place for five years.
- March 2024: Mitsubishi Gas Chemical Company, Inc. of Japan plans to cease orthoxylene (OX) and phthalic anhydride (PA) production at its Mizushima facility, effective mid-January 2025. MGC cites diminished demand and a bleak profitability forecast as reasons for shutting down the 40,000 t/yr PA unit.


Research Methodology Framework and Report Scope
Market Definitions and Key Coverage
Our study treats the naphthalene derivatives market as the combined value of sulphonated naphthalene formaldehyde, phthalic anhydride, naphthalene sulphonic acid, naphthols (α and β), and alkyl naphthalene sulphonate salts that are manufactured from coal-tar or petroleum distillates and sold in powder or liquid form to construction chemicals, dyes, agrochemicals, pulp and paper, oil & gas, and allied industries.
Scope Exclusion: finished downstream products such as ready-mix concrete, finished plastics, and retail textile dyes remain outside the boundary.
Segmentation Overview
- By Form
- Powder
- Liquid
- By Source
- Coal-Tar
- Petroleum-based
- Other Source (Bio-refinery, etc.)
- By Derivative
- Sulphonated Naphthalene Formaldehyde (SNF)
- Phthalic Anhydride
- Naphthalene Sulphonic Acid
- Naphthols (α, β)
- Alkyl Naphthalene Sulphonate Salts
- Others (1,6- & 1,8-Dihydroxynaphthalene, NDCA etc.)
- By End-User Industry
- Construction
- Paints and Coatings
- Textile
- Pulp and Paper
- Oil and Gas
- Pharmaceuticals
- Others End-User Industries (Electronics, Batteries, etc.)
- By Geography
- Asia-Pacific
- China
- India
- Japan
- South Korea
- Rest of Asia-Pacific
- North America
- United States
- Canada
- Mexico
- Europe
- Germany
- United Kingdom
- France
- Italy
- Rest of Europe
- South America
- Brazil
- Argentina
- Rest of South America
- Middle East and Africa
- Saudi Arabia
- South Africa
- Rest of Middle East and Africa
- Asia-Pacific
Detailed Research Methodology and Data Validation
Primary Research
Mordor analysts reached out to procurement managers at super-plasticizer formulators, specialty dye blenders, and coal-tar distillers across Asia-Pacific, Europe, and North America. Interviews and short surveys clarified average selling prices, yield factors, and seasonality shifts, letting us reconcile desk estimates with on-ground realities.
Desk Research
We screened authoritative, open-access sources such as UN Comtrade shipment data, US Geological Survey coal-tar statistics, World Bank cement production indicators, national chemicals trade associations in China and Germany, and peer-reviewed papers on SNF performance. Company 10-K filings and investor decks helped us map capacity expansions. Subscription databases, including D&B Hoovers for company revenues and Questel for patent trends, gave additional context. The sources cited illustrate the breadth of reference material and are not exhaustive.
Market-Sizing & Forecasting
A single top-down and bottom-up framework underpins the model. We first reconstruct global supply using coal-tar output, percent naphthalene recovery, and typical conversion rates into major derivatives, which are then valued with region-specific ASPs gathered from trade databases. Supplier roll-ups and sampled ASP × volume checks validate totals and patch data-poor regions. Key variables like cement output index, textile dye intermediate production, coal-tar price spread, and infrastructure CAPEX drive our multivariate regression forecast, while a scenario lens captures regulatory tightening around carcinogenic aromatics. Gaps in bottom-up inputs are bridged by weighted averages from interviewed experts.
Data Validation & Update Cycle
Each draft passes variance checks against historical trade flows, price curves, and independent demand proxies. Senior reviewers challenge anomalies before sign-off. Reports refresh every twelve months, with interim updates if feedstock supply shocks or regulatory bans materially shift the outlook.
Why Mordor's Naphthalene Derivatives Baseline Commands Confidence
Published numbers often diverge because studies mix upstream naphthalene, downstream finished goods, or use differing price assumptions. Our scope stays on intermediate derivatives, our base year aligns with the latest audited financials, and our annual refresh cadence keeps estimates current.
The comparison shows that once differing scopes and outdated inputs are stripped away, Mordor's disciplined variable selection and live data checkpoints offer decision-makers a balanced, transparent baseline they can rely on.
Benchmark comparison
| Market Size | Anonymized source | Primary gap driver |
|---|---|---|
| USD 1.92 B (2025) | Mordor Intelligence | - |
| USD 10.44 B (2025) | Global Consultancy A | Includes mothball and refined-naphthalene end products, uses 2024 ASP rolled forward without price corrections |
| USD 7.32 B (2025) | Regional Consultancy B | Blends sodium naphthalene sulphonate with other concrete admixtures and applies uniform global ASP |
| USD 1.51 B (2025) | Trade Journal C | Excludes phthalic anhydride segment and relies on 2019 capacity data |
The comparison shows that once differing scopes and outdated inputs are stripped away, Mordor's disciplined variable selection and live data checkpoints offer decision-makers a balanced, transparent baseline they can rely on.


Key Questions Answered in the Report
What is the current Naphthalene Derivative Market size?
The naphthalene derivatives market size stood at USD 1.98 billion in 2026 and is on track to reach USD 2.31 billion by 2031.
Which derivative leads global demand?
Sulphonated naphthalene formaldehyde accounts for 43.48% of revenue owing to its widespread use as a construction superplasticizer.
Why is Asia-Pacific so dominant?
Asia-Pacific hosts the largest construction programs and electronics supply chains, giving it 53.35% of global volume and the highest 4.06% CAGR outlook.
What opportunities exist beyond construction?
High-purity derivatives for batteries, graphene composites, and pharmaceutical intermediates offer premium margins and sustain diversification strategies for suppliers.
Page last updated on:


