
Thiochemicals Market Size and Share
Market Overview
| Study Period | 2020 - 2031 |
|---|---|
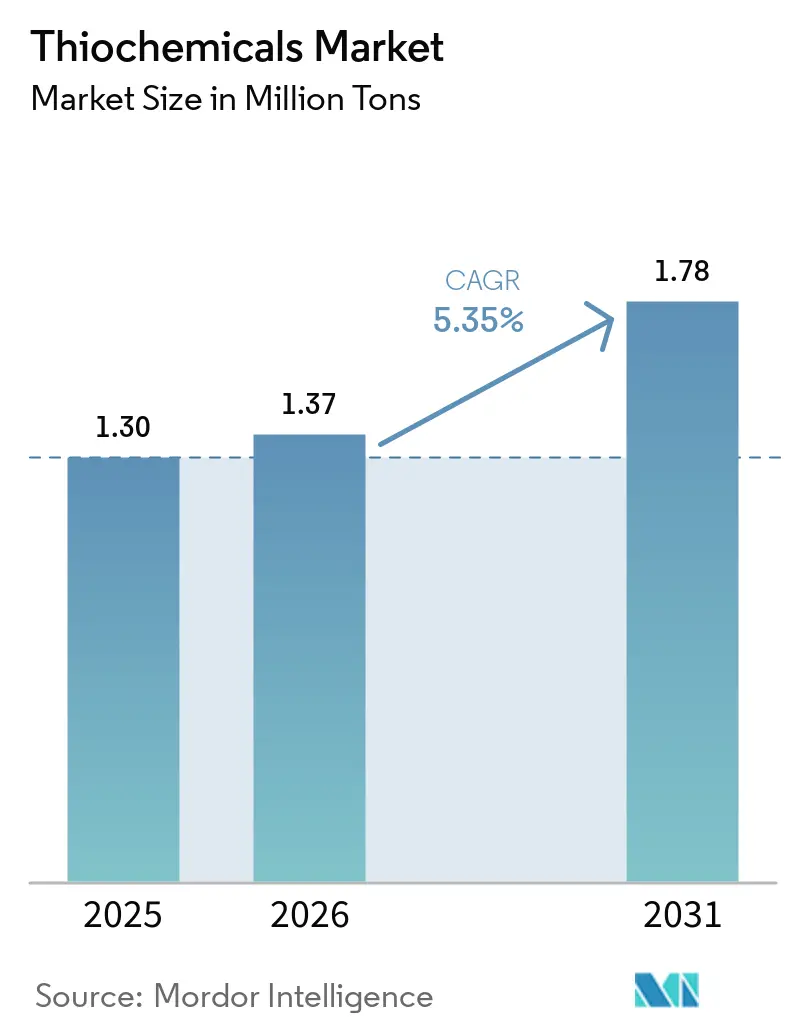
| Market Volume (2026) | 1.37 Million tons |
| Market Volume (2031) | 1.78 Million tons |
| Growth Rate (2026 - 2031) | 5.35 % |
| Fastest Growing Market | Asia-Pacific |
| Largest Market | Asia-Pacific |
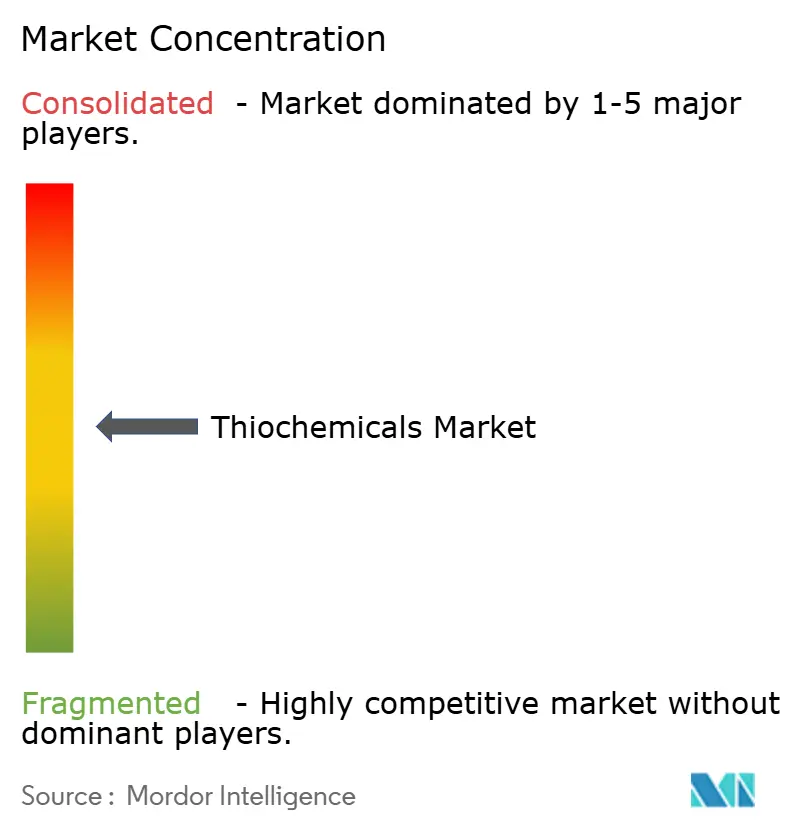
| Market Concentration | Medium |
Major Players *Disclaimer: Major Players sorted in no particular order Image © Mordor Intelligence. Reuse requires attribution under CC BY 4.0. | |
Thiochemicals Market Analysis by Mordor Intelligence
Thiochemicals market size in 2026 is estimated at 1.37 million tons, growing from 2025 value of 1.30 million tons with 2031 projections showing 1.78 million tons, growing at 5.35% CAGR over 2026-2031. Strong protein consumption, steady refinery catalyst demand, and emerging battery‐grade solvent applications are the principal growth vectors sustaining the thiochemicals market. Intensifying livestock modernization in Asia‐Pacific, refinery upgrades aimed at ultra-low-sulfur diesel compliance, and rising adoption of high-purity dimethyl sulfoxide in electronic fabrication jointly anchor the market’s positive trajectory. Integrated producers deploy proprietary technologies and expand regional capacities to secure sulfur feedstock, optimize costs, and deepen customer engagement across animal nutrition, refining, and electronics domains. Regulatory pressures for safer sulfiding agents, coupled with innovation in bio-based pathways, are opening new opportunities while simultaneously elevating compliance expenditures. Supply chain resilience, especially in elemental sulfur procurement, has therefore become a decisive differentiator for long-term success within the thiochemicals market.
Key Report Takeaways
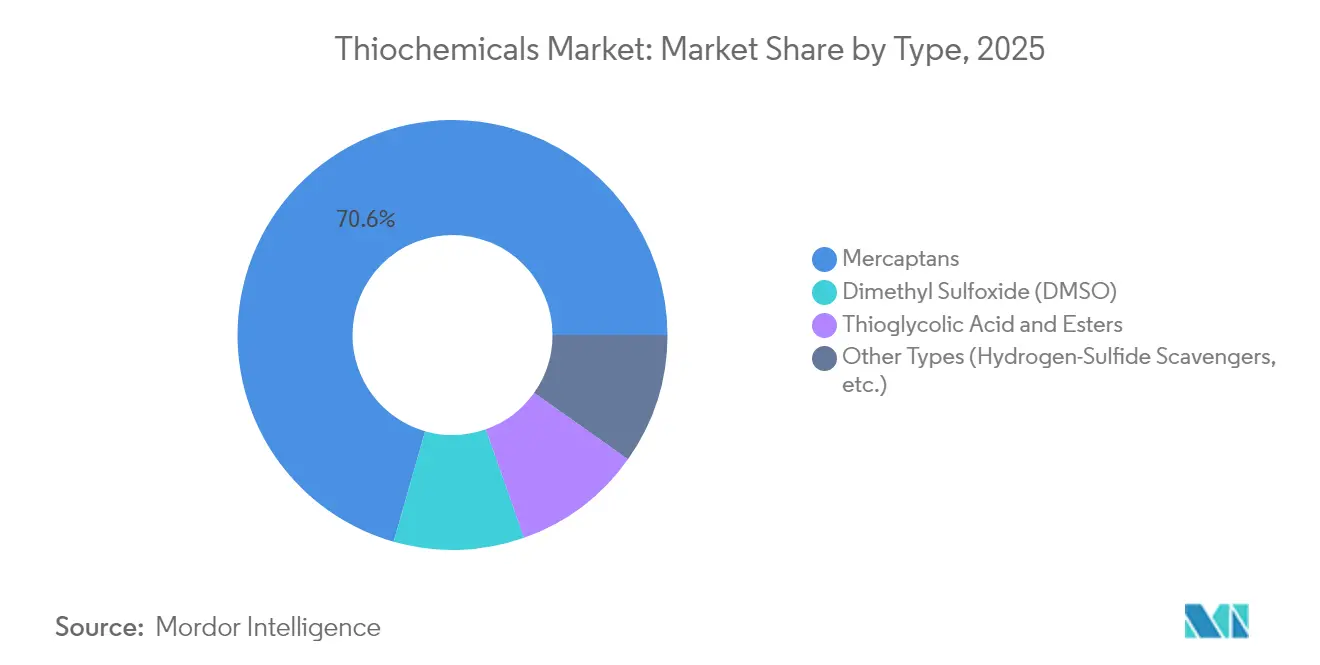
- - By product type, mercaptans led with 70.59% thiochemicals market share in 2025, and is forecast to expand at a 5.62% CAGR through 2031.
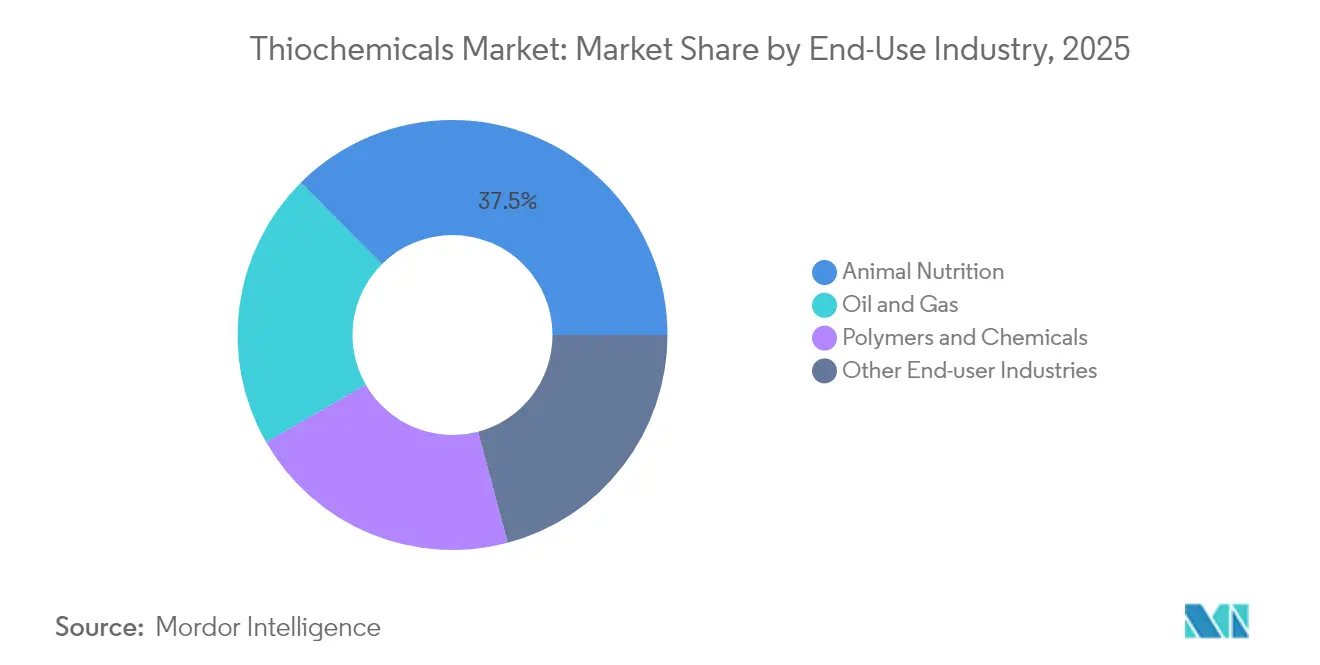
- - By end-use industry, animal nutrition accounted for 37.48% of the thiochemicals market size in 2025 and is set to grow at a 6.44% CAGR to 2031.
- - By geography, Asia-Pacific commanded 38.55% of the thiochemicals market in 2025, and is projected to register the fastest regional CAGR of 6.33% through 2031.
Note: Market size and forecast figures in this report are generated using Mordor Intelligence’s proprietary estimation framework, updated with the latest available data and insights as of 2026.
Market Trends and Insights
Drivers Impact Analysis of Thiochemicals Market*
| Driver | (~) % Impact on CAGR Forecast | Geographic Relevance | Impact Timeline |
|---|---|---|---|
| Surging methionine demand from industrial‐scale animal feed producers | +1.80% | Global with APAC and North America leading | Medium term (2-4 years) |
| Expanding use of Dimethyl Disulfide as a refinery catalyst sulfiding agent | +1.20% | Global, concentrated in major refining regions | Long term (≥ 4 years) |
| Adoption of thiochemicals in advanced batteries | +0.90% | APAC core, spill-over to North America and EU | Long term (≥ 4 years) |
| Growing usage of thiochemcials in methionine production | +0.70% | Global, emphasis on integrated production hubs | Medium term (2-4 years) |
| Growth in ultra-low-sulfur diesel desulfurisation campaigns | +0.60% | North America and EU, expanding to APAC | Medium term (2-4 years) |
| Source: Mordor Intelligence | |||
Surging Methionine Demand From Industrial-Scale Animal Feed Producers
Global poultry and aquaculture producers are scaling premium feed formulations that rely on methionine derived from thiochemicals, thereby stimulating additional capacity investments across the thiochemicals market. Evonik Industries operates integrated hubs in Antwerp, Mobile, and Singapore with aggregate output surpassing 700,000 t per year, underscoring the capital intensity tied to this demand surge. Consumption growth remains most pronounced in Asia-Pacific where incomes and protein uptake are climbing in tandem with commercial farm consolidation. Scientific assessments reveal DL-methionine improves liver metabolism and oxidative stress, while L-methionine accelerates weight gain in broilers, creating differentiated additive niches that support premium pricing. Integrated thiochemical-to-methionine complexes reduce logistics costs, lower sulfur input volatility, and protect margins, prompting leading producers to reinforce backward integration strategies. Consequently, sustained methionine pull‐through ensures the thiochemicals market maintains a robust baseline of demand as feed industries upscale.
Expanding Use of Dimethyl Disulfide as a Refinery Catalyst Sulfiding Agent
Refineries increasingly prefer dimethyl disulfide (DMDS) to activate hydrotreating catalysts because it volumetrically delivers more sulfur with fewer safety concerns than hydrogen sulfide, aligning with worker protection norms and continuous operation imperatives. Technical evaluations show that DMDS-based Exact-S grades raise catalytic activity quickly while minimizing hazardous handling, enabling refineries to comply with stricter fuel sulfur limits. The global shift toward ultra-low-sulfur diesel accelerates this substitution trend, especially in North America, the Middle East, and emerging Asian refining hubs undergoing capacity expansions. Research published on ScienceDirect validates that DMDS-sulfided catalysts meet or exceed performance achieved with H₂S presulfiding under deep desulfurization conditions. Renewable diesel co-processing is further bolstering DMDS uptake because mixed feedstocks require versatile sulfiding agents capable of stabilizing catalysts exposed to oxygenated compounds. Collectively, these operational advantages ensure persistent DMDS volume growth within the broader thiochemicals market.
Adoption of Thiochemicals in Advanced Batteries
Dimethyl sulfoxide (DMSO) demonstrates desirable solvating power, thermal stability, and low viscosity, qualities that raise discharge capacity and cycle life in lithium-oxygen and zinc-air battery chemistries. A 5% DMSO electrolyte addition increased zinc utilization while suppressing passivation in flow battery cells, signaling clear potential for grid-scale storage solutions. Concurrently, semiconductor manufacturers order high-purity DMSO Electronic-Grade solvents that exceed 99.99% purity for TFT-LCD and etching processes, offering suppliers higher margins. Growth in electric vehicle fleets and stationary storage builds is forecast to magnify specialty solvent demand, particularly in Asia-Pacific where battery gigafactories cluster. Producers therefore enhance purification lines and institute rigorous contamination controls, creating a premium product tier within the thiochemicals market. Emerging solid-state and sulfur‐rich cathode designs also point to broader thiochemical use cases, positioning suppliers for compelling long-term opportunities.
Growing Usage of Thiochemicals in Methionine Production
Industrial methionine synthesis depends on methyl mercaptan and related intermediates, prompting firms to develop contiguous production units that convert elemental sulfur through to final amino acid output[1]American Chemical Society, “Integrated Methionine Manufacturing Routes,” acs.org . Scientists are refining bio-based pathways by transforming glycerol and other renewables into thiochemical feedstocks, aiding decarbonization objectives while curbing reliance on volatile sulfur markets. Engineered microbial systems have recently achieved L-cysteine titers above 33.8 g L-¹, creating prospects for enzymatic cascades that integrate seamlessly with classical methionine plants. These innovations could temper feedstock price swings while shrinking the environmental footprint of large-scale amino acid production. Early-stage deployments remain modest, yet they underscore the dynamic evolution that keeps the thiochemicals market technologically vibrant and increasingly sustainable.
Restraints Impact Analysis of Thiochemicals Market*
| Restraint | (~) % Impact on CAGR Forecast | Geographic Relevance | Impact Timeline |
|---|---|---|---|
| High toxicity and odour management costs | -0.80% | Global with stricter enforcement in developed markets | Short term (≤ 2 years) |
| Volatility in elemental sulfur prices | -0.60% | Global, cost-sensitive applications most affected | Short term (≤ 2 years) |
| Producer concentration risk causing supply shocks | -0.40% | Global, APAC supply chains most vulnerable | Medium term (2-4 years) |
| Source: Mordor Intelligence | |||
High Toxicity and Odor Management Costs
Thiochemicals possess strong odors and toxicity profiles that oblige producers to invest in containment, scrubbers, and specialized handling infrastructure, thereby elevating operating costs. The 2024 U.S. EPA Risk Management Program amendments boost annual compliance spending for synthetic organic chemical plants by USD 256.9 million at a 3% discount rate, a burden borne by several thiochemical facilities[2]Federal Register, “Accidental Release Prevention Requirements,” federalregister.gov . Patented odor-adsorbent cartridges and membrane bioreactors targeting 100% DMSO removal demonstrate available solutions, yet these technologies require meaningful capital outlays and technical oversight. Semiconductor fabs in Taiwan and South Korea apply aerobic membrane reactors tailored to DMSO-laden wastewater streams, showing that end-markets also pass stricter discharge criteria down the supply chain. Elevated environmental scrutiny may accelerate the shift toward low-odor formulations but will likely restrain short-term output expansion in legacy facilities, tempering near-term growth for the thiochemicals market.
Volatility in Elemental Sulfur Prices
Elemental sulfur spot prices more than trebled over 2024, climbing from USD 69 t-¹ to USD 216 t-¹ in certain ports, driven by refinery maintenance outages and fertilizer demand rebounds[3]U.S. Geological Survey, “Sulfur Mineral Commodity Summary,” usgs.gov . Rail disruptions in Western Canada curtailed exports, tightening supply and escalating costs for U.S. Gulf Coast mercaptan plants that depend on imported sulfur. Because sulfur procurement can represent up to 25% of cash costs for methyl mercaptan producers, price spikes compress margins and complicate contract negotiations with animal feed and refining clients. Some integrated players hedge volatility through long-term refinery offtake agreements, yet smaller, stand-alone thiochemical firms face sharper exposure. Such swings introduce uncertainty into capital budgeting and may delay debottlenecking projects, thereby applying a mild but persistent drag on the thiochemicals market in cost-sensitive applications.
*Our forecasts treat driver/restraint impacts as directional, not additive. The impact forecasts reflect baseline growth, mix effects, and variable interactions.
Thiochemicals Market Segment Analysis
By Type:
Mercaptans Sustain Market LeadershipMercaptans captured 70.59% of thiochemicals market share in 2025 owing to their centrality in dimethyl disulfide synthesis and methionine manufacturing. The segment expanded alongside new Asian refineries and feed mills that demand reliable supplies of methyl mercaptan and ethanethiol. DMDS remains the benchmark sulfiding agent because it safely delivers high sulfur content per unit mass, reducing turnaround times during catalyst activation. Customers in Middle Eastern mega-refineries place bulk orders years in advance, ensuring predictable throughput for integrated mercaptan-DMDS producers. Advancements in continuous mercaptan oxidation reactors have also improved yields, lowering variable costs and supporting a 5.62% CAGR outlook for mercaptans through 2031. Further upside could arise from bio-mercaptan initiatives that promise to shrink carbon intensity while giving suppliers a marketing edge in jurisdictions with emerging carbon-border adjustment mechanisms.
Dimethyl sulfoxide holds a significant share in the thiochemicals market by volume. Consumer electronics assemblers now demand higher purity ranges that limit metal ions to below 100 ppt, spurring producers to install double-distillation columns and stainless-steel systems that inhibit contamination. Secure sourcing of pharmaceutical-grade DMSO for cryopreservation and oncology formulations is also rising in Europe, widening application diversity. Thioglycolic acid and esters maintain stable though niche roles in hair-care cosmetics, PVC heat stabilizers, and microelectronic photoresist stripping. Other minor chemistries such as polysulfides and thiazoles address rubber vulcanization and oilfield H₂S scavenging, providing supplemental, high-margin revenue streams for innovators willing to engage in custom synthesis.



By End-Use Industry:
Animal Nutrition Leads GrowthAnimal nutrition dominated with 37.48% of thiochemicals market size in 2025 as integrators build ever-larger methionine complexes contiguous to mercaptan units in Asia and North America. Corn and soybean meal diets lack adequate methionine, driving feed formulators to dose synthetic forms at controlled levels that optimize feed-conversion ratios. Rising consumption of poultry meat in Indonesia, Mexico, and Egypt feeds steady volume growth, while aquaculture’s switch to plant protein intensifies methionine requirements to match fishmeal performance. Researchers continue to publish evidence showing significant improvements in body-weight gain and antioxidant status when DL-methionine or hydroxy-analogue methionine is added at 0.15–0.20% of ration weight. Aggregate methionine demand therefore underpins a resilient baseline for overall thiochemicals market volumes.
In the oil and gas sector, DMDS, polysulfides, and sulfurized additives play a crucial role. These substances help combat corrosion, maintain a balanced sulfur content, and stabilize catalysts, particularly during the processing of heavy reformate. Global hydrotreating capacity additions will maintain a substantial pull for sulfiding agents, particularly in Asia-Pacific’s rising clean fuels drive. Polymer and chemical applications leverage thiochemicals as chain transfer agents, vulcanization accelerants, and building blocks for high-refractive index resins used in smartphone lenses. Electronics, semiconductor cleaning, and agrochemicals collectively exhibit mid-to-high single-digit CAGR potential, propelled by demand for ultra-pure solvents and sulfurous nutrient solutions; these segments, though smaller in weight terms, deliver attractive margins that encourage product specialization.
Geography Analysis
APAC Thiochemicals Market
Asia-Pacific held 38.55% of thiochemicals market share in 2025 and is projected to expand at a 6.33% CAGR through 2031, powered by manufacturing scale and downstream demand diversity. China’s refinery build-out combined with surging poultry output secures steady mercaptan liftings, while local electronics assemblers consume premium DMSO grades for LCD and memory fabrication. India’s speciality chemical segment benefits from global “China + 1” sourcing models, accelerating investment in integrated methionine and DMDS capabilities. Malaysia and Thailand attract advanced-material multinationals who value free-trade access and supportive policy frameworks, thereby expanding regional demand nodes for thiochemicals.
North America Thiochemicals Market
Strict environmental standards in North America, which mandate ultra-low-sulfur fuels and advanced odor controls, strengthen the region's market position. The American Chemistry Council anticipates 15% domestic chemical demand growth by 2033, but capacity additions lag, implying heavier import reliance and opportunity for incremental thiochemical expansions. The Gulf Coast hosts vertically integrated thiochemical parks that feed into regional methionine and DMDS production, benefiting from abundant shale-derived hydrogen and robust logistics. Canada’s sulfur output renders local refineries strategic suppliers to mercaptan producers, yet rail congestion and port limitations occasionally disrupt flows, prompting inventory stockpiling strategies.
EMEA and South America Thiochemicals Market
Europe remains technologically mature and environmentally progressive, promoting bio-based thiochemical research while penalizing emissions. Arkema, based in France, innovates Vultac sulfur donors catering to specialty rubber markets that service premium tire brands. German chemical clusters channel funding into circular-economy projects focusing on waste-to-sulfur and carbon-neutral process heat, initiatives that could reshape regional supply structures. South America and the Middle East & Africa collectively account for less than 10% of global trade today, yet refinery upgrades in Brazil and petrochemical diversification in Saudi Arabia hint at future thiochemicals market opportunities as localized supply chains mature and environmental policies tighten.
Value Chain Analysis
In thiochemicals, feedstocks begin with elemental sulfur and recovered hydrogen sulfide, which are refined into feed mercaptans and related intermediates. USGS 2024 sulfur price volatility has sharpened attention on feedstock security, pushing producers toward tighter integration of sulfur streams and longer-term offtake arrangements to reduce disruption and price spikes. Downstream, specialized logistics and storage are needed because odor, toxicity, and hazard classifications shape transport requirements, with dedicated shipments and regional warehousing supporting demand in animal nutrition, refinery sulfiding, and electronics-pharma applications.
The main bottlenecks tend to sit in elemental sulfur availability and recovery-rate swings in refinery streams. These conditions can tighten supply for non-integrated producers and raise working capital needs across the chain.
Competitive Landscape
The thiochemicals market remains moderately fragmented. Integrated majors leverage proprietary mercaptan oxidation know-how, captive sulfur sourcing, and multi-application product portfolios to retain pricing power. Arkema’s recent USD 100 million Beaumont plant debottlenecking will lift DMDS capacity by 30% and shorten lead times for North American refiners. Chevron Phillips Chemical emphasizes circular economy commitments that resonate with refinery customers seeking Scope-3 emission reductions, securing long-term supply contracts acknowledged by the American Chemistry Council’s 2024 safety accolades.
Rivalry manifests through continual process optimization, value-added technical service, and customer co-development programs. Patent filings reveal breakthroughs such as enzyme-enhanced mercaptan production possibly delivering catalytic efficiencies above 100,000 M-¹ s-¹, which could slash energy intensity and drive step-change cost savings. Smaller innovators focus on niche formulations like lithium-grade DMSO and bio-thiols derived from fermentation, targeting end users willing to pay premiums for sustainability or purity. Mergers & acquisitions center on geographic fill-ins and feedstock security. Overall, product quality, regulatory compliance, and sulfur feedstock optionality continue to define competitive advantage.
Thiochemicals Industry Leaders
Arkema
BRUNO BOCK
Chevron Phillips Chemical Company LLC.
Daicel Corporation
Toray Fine Chemicals
- *Disclaimer: Major Players sorted in no particular order
Thiochemicals Market Companies Covered in this Report
- Arkema
- BRUNO BOCK
- Chevron Phillips Chemical Company LLC.
- Daicel Corporation
- Dr. Spiess Chemische Fabrik
- Hebei Yanuo Bioscience
- KIP Chemicals
- Merck KGaA
- Taizhou Sunny Chemical Co., Ltd.
- TCI Chemicals
- Toray Fine Chemicals
- WEIFANG YI HUA CHEMICAL CO., LTD.

Market Opportunities and Future Outlook
Opportunity clusters are forming around tighter integration between sulfur feedstock access and mercaptan production, alongside downstream methionine or DMDS supply chains, with a particular concentration of scale-up in Asia-Pacific. Given mercaptans' role in demand and animal nutrition's large share, investments aimed at securing feedstock access and improving purification and delivery at plants target key throughput and margin levers.
A second gap is emerging in high-purity grades and on-site technical support for applications that require tighter process control, including electronic-grade DMSO and other sensitive environments. At the same time, regulatory-driven pressure to improve handling and safety is translating into more process improvements and supplier qualification. Elemental sulfur price volatility in 2024 reinforces the role of long-term sulfur offtake arrangements and integrated sourcing strategies, supporting more differentiated contracting, regional storage, and reliability offerings.
Recent Industry Developments in Thiochemicals Market
- April 2026: BRUNO BOCK announced it will cease sulfur product manufacturing at its Waterloo, New York facility during Q2 2026 and transition the site into a regional distribution center as part of a broader North American restructuring. The shift moves the company footprint toward logistics and customer service while changing regional supply dynamics for organosulfur products and intermediates.
- February 2026: Arkema reported continued focus on disciplined capital allocation and cost control in its 2025 full-year investor communication, reinforcing a selective approach to investments across its portfolio that includes thiochemicals. This posture influences the pace and prioritization of capacity and debottlenecking decisions in sulfur-based specialties amid volatile feedstock and logistics conditions.
- August 2024: USGS reported sulfur price volatility with spot prices more than tripled in certain ports during 2024, highlighting risk in elemental sulfur supply chains. Market response has included interest in longer-term sulfur offtake arrangements and integrated sourcing strategies to improve supply reliability.


Thiochemicals Market Report Scope and Research Methodology
Market Definition and Coverage
For this study, the thiochemicals market covers industrial sulfur containing organic chemicals sold as intermediates, solvents, and performance additives across major end uses. Results are measured as the volume of material supplied into end markets, in tons.
Scope exclusions: We exclude captive in-plant transfers that are not priced as market transactions, along with downstream finished formulations where thiochemicals are only a minor ingredient.
Segments Covered in This Report
- By Type
- Mercaptans
- Dimethyl Sulfoxide (DMSO)
- Thioglycolic Acid and Esters
- Other Types (Hydrogen-Sulfide Scavengers, etc.)
- By End-Use Industry
- Animal Nutrition
- Oil and Gas
- Polymers and Chemicals
- Other End-user Industries (Electronics and Semiconductor Cleaning, Agrochemicals, etc.)
- By Geography
- Asia-Pacific
- China
- Japan
- India
- South Korea
- ASEAN Countries
- Rest of Asia-Pacific
- North America
- United States
- Canada
- Mexico
- Europe
- Germany
- United Kingdom
- France
- Italy
- Spain
- Russia
- NORDIC Countries
- Rest of Europe
- South America
- Brazil
- Argentina
- Rest of South America
- Middle East and Africa
- Saudi Arabia
- South Africa
- Rest of Middle East and Africa
- Asia-Pacific
Data Sources, Market Sizing, and Validation
Desk Research
Desk work starts by building a clean fact base on sulfur and petrochemical feedstocks, trade movements, and end use activity. We refer to public sources such as UN Comtrade for import and export flows, USGS for sulfur and related mineral statistics, national statistical agencies for industrial output, and customs or port authority publications where available.
To translate these signals into a usable market model, we also review technical literature and standards that describe production routes and typical purity grades, along with environmental and chemical safety references from organizations such as the US EPA and ECHA. Company annual reports, investor presentations, and press releases help validate capacity additions, shutdowns, and application focus, and a paid subscription for company financials and news supports cross-checks on timing. This list is not exhaustive, and many other public references were used during data collection, validation, and clarification.
Primary Interviews and Surveys
Primary work is used to confirm what the desk signals cannot fully explain, especially pricing logic, operating rates, and where demand is actually consumed by application. We speak with manufacturers, distributors, and downstream users across APAC, EMEA, and the Americas so assumptions on grade mix, trade share, and plant utilization can be checked and adjusted based on how firms report actual sales and run patterns.
Distribution of primary research fieldwork respondents
| Company type | Respondent position | Region |
|---|---|---|
| Top tier: 30% | CXOs: 14% | APAC: 44% |
| Mid tier: 56% | Functional/Unit leaders: 38% | EMEA: 34% |
| Smaller Players: 14% | Managers: 48% | Americas: 22% |
Market-Sizing & Forecasting
The core model is built using a top-down reconstruction where production, capacity changes, trade flows, and end use demand indicators are translated into a global supply into consumption balance for thiochemicals. To keep the totals realistic, the outcome is corroborated with selective bottom-up approximations such as sampled supplier volumes by product group, channel checks on distributor movements, and price per ton ranges applied to known consumption pockets.
Key inputs that move the model include announced capacity and operating rate ranges, sulfur and hydrocarbon feedstock availability, regional import reliance, and demand signals from animal nutrition, oil and gas treatment, and polymer and chemical manufacturing. Pricing is handled through an average selling price per ton logic that uses grade mix and regional spreads, rather than assuming one flat global price, which helps reduce overstatement when higher purity volumes are small.
For forecasts, we use scenario analysis supported by trend lines in end use indicators and expert views on utilization, trade normalization, and feedstock direction. Where bottom-up evidence is missing for smaller countries, gaps are filled using proxy indicators like industrial output and trade intensity, then rechecked so the regional totals still match the global balance.
Data Validation & Update Cycle
Results are validated through multiple checks, including reconciling implied tons with capacity and utilization, reviewing trade anomalies, and testing sensitivity to price per ton and grade mix assumptions. A second analyst reviews the key drivers and outliers, and if a variance cannot be explained, we re-contact sources to confirm whether a plant event, regulation change, or substitution trend is driving it.
Reports are refreshed annually, and interim updates are made when material events occur, such as large capacity moves, extended outages, or sharp feedstock-driven price shifts. Before delivery, a final pass is completed so clients receive an updated view aligned to the latest data releases and confirmed market signals.
Mordor Intelligence's Thiochemicals Market Size Compared Against Other Published Estimates
It is normal to see different published market sizes for thiochemicals because firms do not always use the same unit of measurement, boundary rules, and timing for prices and currency conversion. Differences can also come from how much of the value chain is counted, and whether trade and utilization are treated as hard constraints or as broad assumptions.
In this study, the refresh cadence matters because price per ton and currency timing are aligned to the latest confirmed quarter before the annual update, and then validated back to capacity utilization and trade signals, which is why the Mordor Intelligence baseline is not the same as revenue-led estimates that rely on older average prices. Another common driver is scope, since some figures blend adjacent sulfur chemicals or downstream formulations, and others count thiochemicals only when sold as a merchant product rather than transferred internally.
Benchmark comparison
| Source | Market Size | Gaps in Research Methodology |
|---|---|---|
| Mordor Intelligence | USD 1.37 M (2026) | |
| Industry Publisher A | USD 1.20 B (2025) | Uses a revenue lens without clearly stating price per ton build up or grade mix by region, which can compress or inflate value when higher purity products are assumed to be a larger share than they are. |
| Global Research Outlet B | USD 2.67 B (2024) | Appears to apply a broader product boundary and a different currency timing, where adjacent sulfur chemicals and downstream uses may be included, leading to a larger total that is harder to reconcile with capacity and trade constraints. |
The spread across the figures mainly reflects boundary choices and how pricing and currency timing are handled, not just a different growth view. By tying the totals back to tons, utilization, and trade movements, the estimate stays traceable to simple checks that can be repeated when new data is released.


Key Questions Answered in the Report
What is the current size of the thiochemicals market?
The thiochemicals market size reached 1.37 million tons in 2026 and is forecast to hit 1.78 million tons by 2031.
Which segment generates the highest demand for thiochemicals?
Animal nutrition leads demand, holding 37.48% of the market in 2025 thanks to methionine requirements in poultry and aquaculture feed.
Why is dimethyl disulfide preferred in refineries?
DMDS offers higher sulfur delivery per unit and better safety than hydrogen sulfide, enabling efficient catalyst activation for ultra-low-sulfur diesel compliance.
Which region grows fastest in the thiochemicals market?
Asia-Pacific shows the fastest growth at a 6.33% CAGR, supported by expanding livestock, refining, and electronics industries.
How do environmental regulations influence thiochemicals producers?
Stricter toxicity and odor mandates require costly containment systems and drive innovation toward cleaner production, impacting operational expenses and investment priorities.
Page last updated on:


 Your data is secure and never sold or shared.


