Tetrahydrofuran (THF) Market Size and Share
Market Overview
| Study Period | 2021 - 2031 |
|---|---|
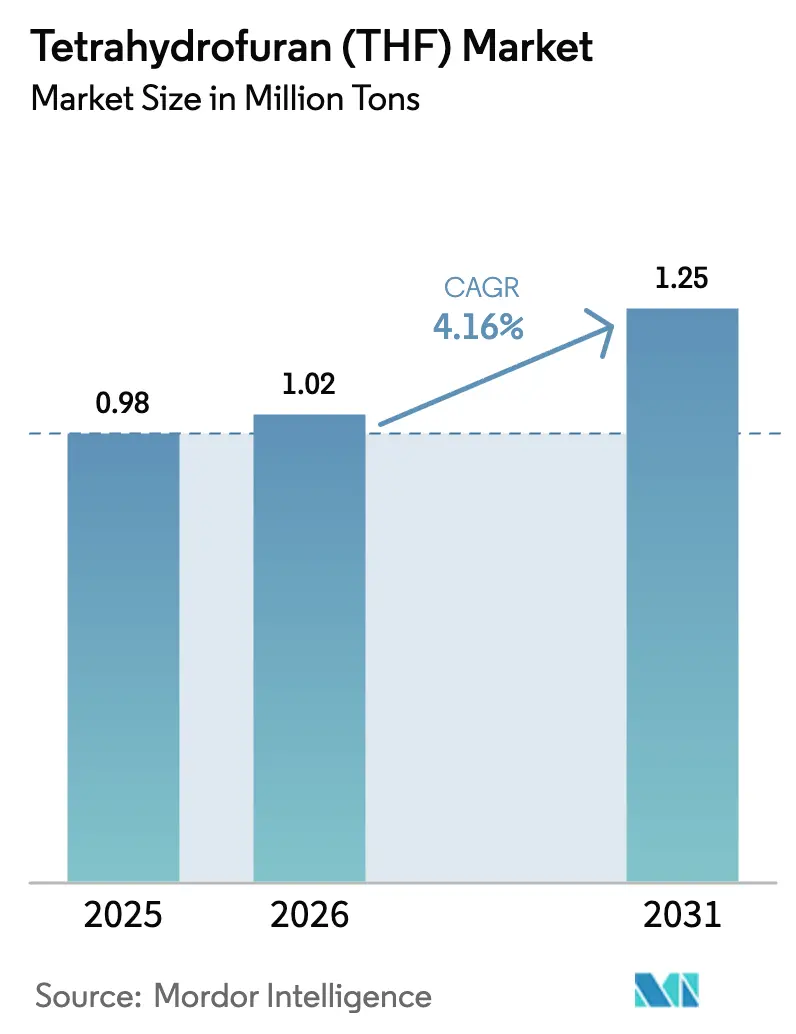
| Market Volume (2026) | 1.02 Million tons |
| Market Volume (2031) | 1.25 Million tons |
| Growth Rate (2026 - 2031) | 4.16% CAGR |
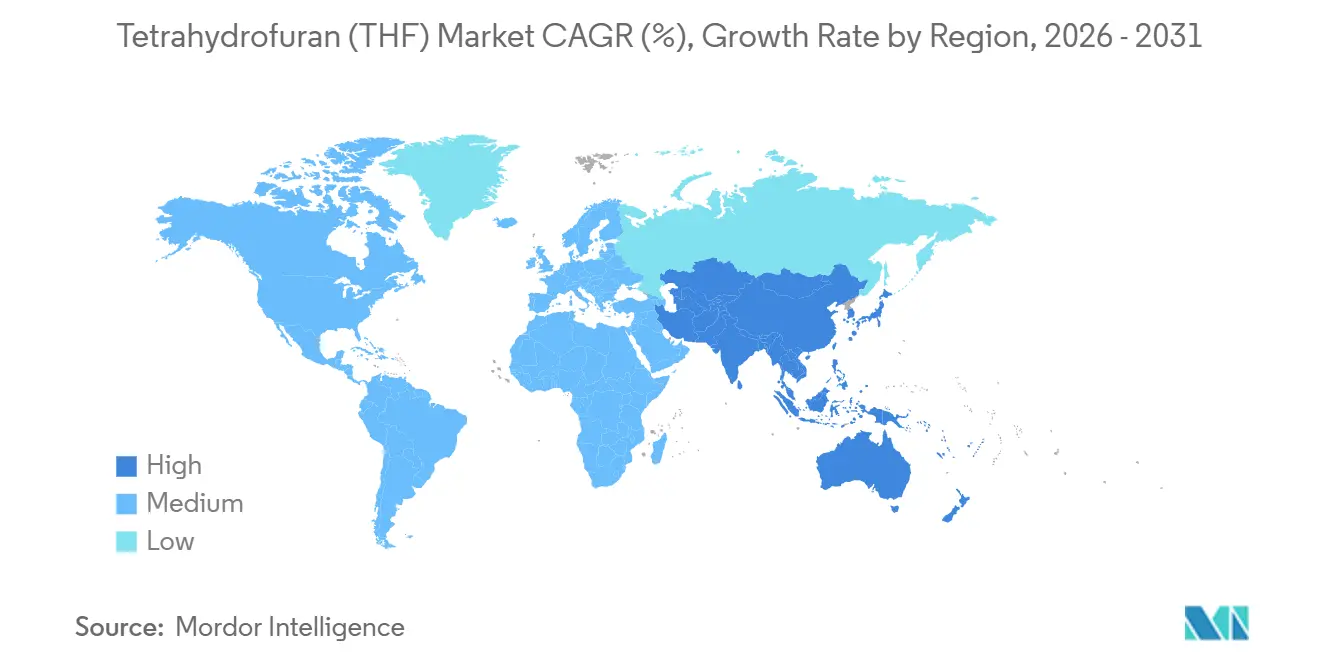
| Fastest Growing Market | Asia Pacific |
| Largest Market | Asia Pacific |
| Market Concentration | Medium |
Major Players *Disclaimer: Major Players sorted in no particular order Image © Mordor Intelligence. Reuse requires attribution under CC BY 4.0. | |
Tetrahydrofuran (THF) Market Analysis by Mordor Intelligence
The Tetrahydrofuran Market size is expected to grow from 0.98 million tons in 2025 to 1.02 million tons in 2026 and is forecast to reach 1.25 million tons by 2031 at a 4.16% CAGR over 2026-2031. The forecast underscores a stable demand trajectory anchored by polytetramethylene ether glycol (PTMEG), lithium-ion battery electrolytes, and specialty-grade solvent applications. Asia-Pacific continues to dictate volume, yet its dominance rests on concentrated spandex-fiber production, exposing the region to apparel-cycle swings. Capacity rationalization in mature regions, tighter occupational-exposure rules, and accelerating bio-based certifications are reshaping trade flows and supplier strategies. Producers are prioritizing high-purity and biomass-balance offerings that command premiums, while insurance-cost inflation and heightened environmental scrutiny are consolidating distribution around vertically integrated majors.
Key Report Takeaways
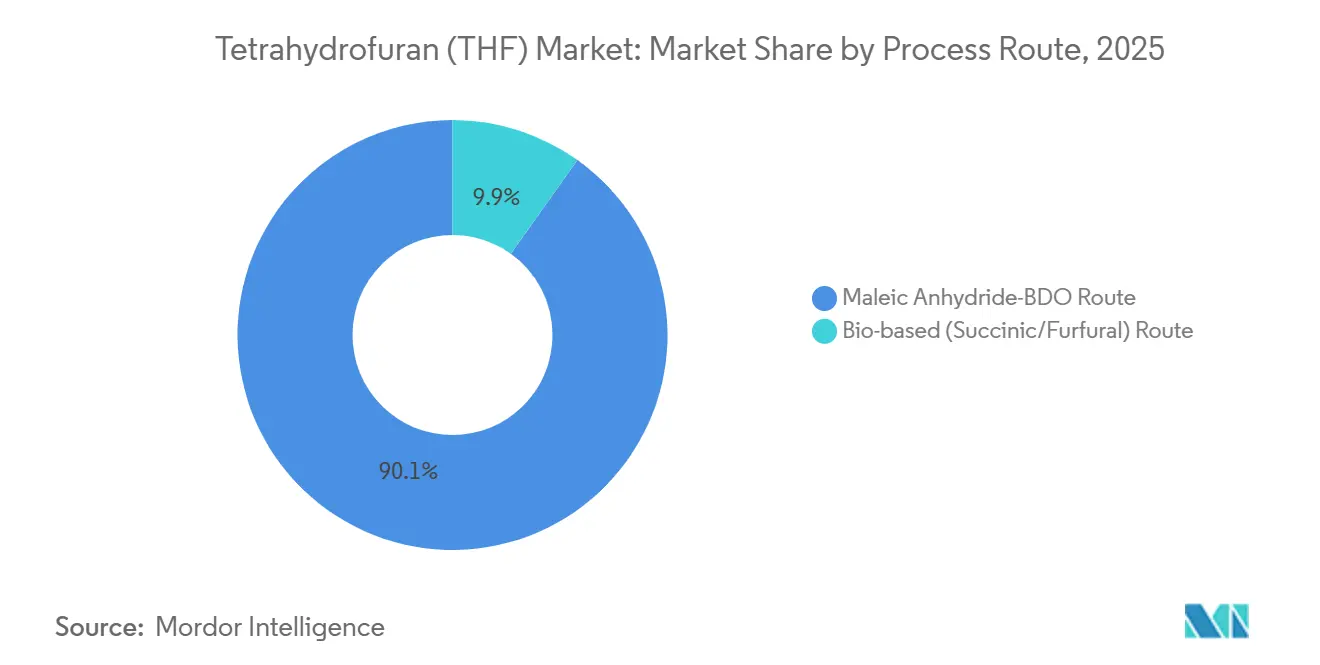
- By process route, the maleic anhydride route captured 90.12% of the tetrahydrofuran market share in 2025; the bio-based route is projected to expand at a 5.89% CAGR through 2031.
- By application, PTMEG production accounted for 78.89% share of the tetrahydrofuran market size in 2025 and is advancing at a 4.38% CAGR through 2031.
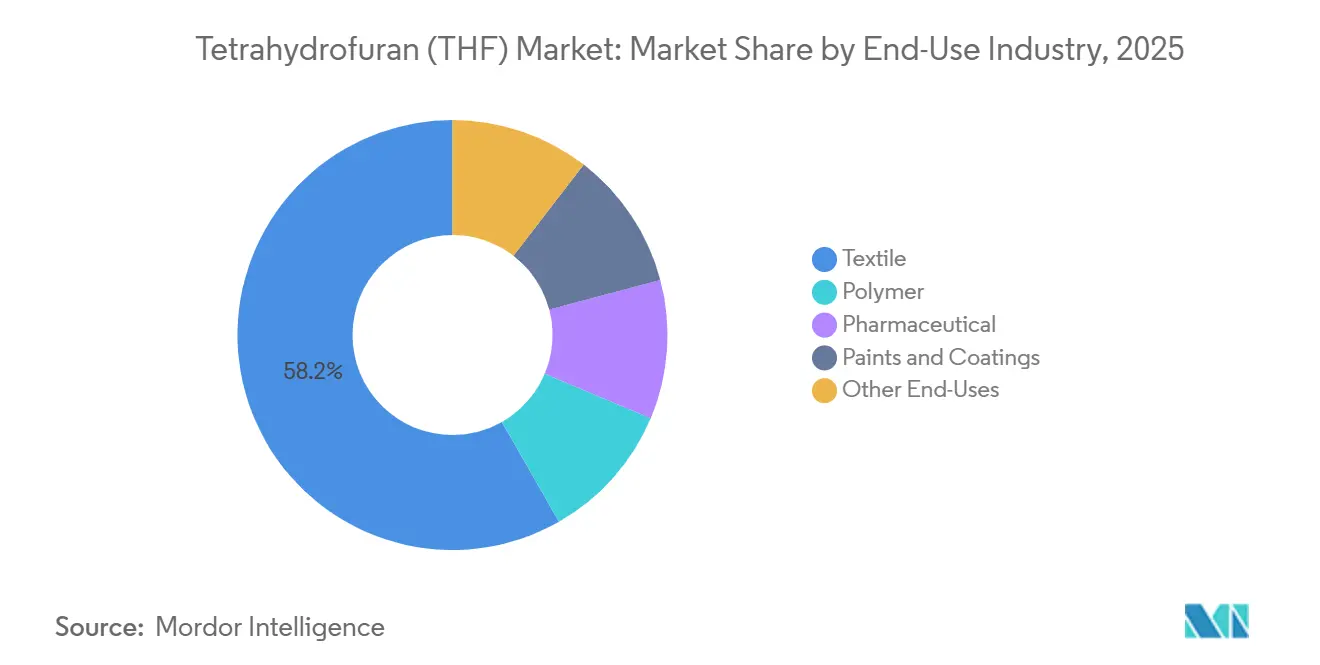
- By end-use industry, textiles led with 58.24% revenue share in 2025; paints and coatings are forecast to expand at a 3.88% CAGR to 2031.
- By distribution channel, direct sales held a 75.16% share in 2025 and are projected to grow at a 4.33% CAGR through 2031.
- By geography, Asia-Pacific commanded 85.24% of the 2025 volume and is set to increase at a 4.36% CAGR to 2031.
Note: Market size and forecast figures in this report are generated using Mordor Intelligence’s proprietary estimation framework, updated with the latest available data and insights as of January 2026.
Global Tetrahydrofuran (THF) Market Trends and Insights
Driver Impact Analysis*
| Drivers | (~) % Impact on CAGR Forecast | Geographic Relevance | Impact Timeline |
|---|---|---|---|
| Rising demand for spandex fiber/PTMEG in Asia | +1.8% | Asia-Pacific (China, India, ASEAN), spill-over to South America | Medium term (2-4 years) |
| Capacity additions in Li-ion battery electrolyte plants | +0.9% | Global, concentrated in China, South Korea, Europe | Long term (≥ 4 years) |
| PVC capacity expansions in Asia (pipe and profile) | +0.7% | Asia-Pacific (India, China, Southeast Asia) | Medium term (2-4 years) |
| Shift to greener pharma solvents in Europe | +0.5% | Europe (Germany, UK, France), North America | Long term (≥ 4 years) |
| Growth of UV-curable digital inks (industrial inkjet) | +0.3% | Global, early adoption in Europe and North America | Long term (≥ 4 years) |
| Source: Mordor Intelligence | |||
Rising Demand for Spandex Fiber and PTMEG in Asia
PTMEG production absorbed 78.89% of global tetrahydrofuran market volume in 2025 and is forecast to rise at a 4.38% CAGR to 2031, mainly on expanding spandex capacity in China, India, and Indonesia. Fourth-quarter 2024 inventory build-ups prompted temporary PTMEG rate cuts, illustrating cyclical vulnerability. Vietnamese investments in bio-BDO and low-carbon PTMEG demonstrate a shift toward reduced-emission fibers that allow apparel brands to meet Scope 3 targets without altering fabric specifications. Chinese producers are doubling PTMEG lines to secure in-house THF, signaling a preference for captive integration as a hedge against feedstock swings. Improved inland-to-coast rail logistics lowered freight cost by up to 12%, supporting the competitiveness of coal-based BDO plants in northern China.
Capacity Additions in Lithium-Ion Battery Electrolyte Plants
Battery-grade THF remains niche, yet its role in low-temperature electrolyte blends is growing as EV platforms demand wider operating windows. Ultra-high-purity grades with peroxide levels below 10 ppm and moisture under 50 ppm command 30-40% premiums over commodity solvent. A 60,000-ton expansion in high-purity BDO allows producers to serve this segment while offsetting the yield penalties of deep purification. Research on fluorinated carbonates hints that THF’s growth could plateau if solid-state batteries are commercialized after 2028, prompting producers to diversify into pharmaceutical and specialty-polymer niches.
PVC Capacity Expansions in Asia Driving Solvent Demand
A 1.5 million-ton PVC addition in India by 2027 underpins incremental THF demand for high-strength pipe cements, while Southeast Asian infrastructure programs spur solvent needs in profile adhesives. Domestic THF production lags local PVC growth, increasing reliance on imports or lower-performance alternatives such as methyl ethyl ketone. Middle-Eastern mixed-feed cracker projects under feasibility study could introduce fresh THF capacity after 2028, but near-term supply tightness in Asia persists.
Shift to Greener Pharmaceutical Solvents in Europe
Regulators classify THF as a Class 2 residual solvent with a 7.2 mg daily exposure limit, but it offers a safer toxicological profile than many chlorinated analogs. The European Union’s enhanced labeling rules favor THF by reducing compliance friction for formulators seeking lower-hazard substitutes. Biomass-balance grades certified under ISCC PLUS let drug makers book Scope 3 cuts without re-validating processes, legitimizing 15-20% premiums. An ongoing U.S. toxicological review could tighten future constraints, underscoring regulatory risk for pharmaceutical demand.
Restraint Impact Analysis*
| Restraints | (~) % Impact on CAGR Forecast | Geographic Relevance | Impact Timeline |
|---|---|---|---|
| Stricter OSHA and REACH exposure limits on THF | -0.6% | Global, most acute in EU and North America | Short term (≤ 2 years) |
| Volatile BDO and maleic anhydride feedstock prices | -0.8% | Global, concentrated impact in Asia-Pacific | Medium term (2-4 years) |
| Rising insurance premiums after major fire/explosion losses | -0.4% | Global, particularly North America and Europe | Short term (≤ 2 years) |
| Source: Mordor Intelligence | |||
Stricter OSHA and REACH Exposure Limits Reshaping Supply Chains
While the U.S. OSHA 8-hour PEL remains 200 ppm, many employers adopt the 50 ppm threshold recommended by ACGIH and embedded in several EU member-state rules. Meeting the lower limit requires closed-loop handling and continuous vapor monitoring, capital investments that small repackagers struggle to fund. EU industrial-emission rules now embed REACH obligations into operating permits, extending lead times for new capacity to as long as two years and encouraging consolidation around large, vertically integrated suppliers.
Volatile BDO and Maleic Anhydride Feedstock Prices Compressing Margins
Rapid BDO capacity build-outs between 2023 and 2025 outstripped downstream absorption, pressuring margins for THF producers reliant on merchant BDO. Maleic anhydride prices track polyester resin cycles rather than THF fundamentals, creating asymmetric risks: resin upswings divert maleic to higher-value outlets, tightening THF feedstock; downturns flood BDO markets, eroding pricing power. Coal-to-hydrogen BDO plants buffer some volatility but often consume output internally for biodegradable polyesters, limiting relief to merchant buyers.
*Our forecasts treat driver/restraint impacts as directional, not additive. The impact forecasts reflect baseline growth, mix effects, and variable interactions.
Segment Analysis
By Process Route: Cost Leadership Maintains Maleic Anhydride Dominance
The maleic anhydride hydrogenation pathway retained 90.12% share of 2025 production because decades of catalyst optimization, heat integration, and internal hydrogen supply keep variable costs low. Recent upgrades achieved12% conversion-unit efficiency gains, underscoring continual incremental improvement. The THF volume from bio-based routes is projected to grow at a 5.89% CAGR through 2031. Bio-based routes draw attention for regulatory-credit benefits rather than parity economics. Biomass-balance THF, certified at European and U.S. sites, captures premiums in markets willing to pay for embedded renewable carbon. Still, separation costs consume up to 80% of bio-route expenditures, demanding captive integration with high-value PTMEG or specialty-polymer lines to stay competitive.
The tetrahydrofuran market size for bio-based volumes remains modest, yet early-stage investments in succinic acid and furfural platforms signal longer-term diversification. Captive projects in Vietnam and eastern China show producers pairing bio-BDO with PTMEG to lock in offtake and spread purification overheads. Displacement of petrochemical routes will remain incremental through 2031 unless carbon-pricing regimes tighten materially.


By Application: PTMEG Continues to Anchor Demand
PTMEG production retained 78.89% share of the tetrahydrofuran market size in 2025 and is on track for a 4.38% CAGR, reflecting the steady expansion of spandex fiber across apparel, medical-textile, and vehicle-interiors segments. Oversupply events in late-2024 exposed short-term pricing risk, but long-term apparel adoption trends support continued volume growth. Solvent uses, including pharmaceutical synthesis and PVC adhesives, form the secondary demand tier. Biomass-balance certification enhances pharma uptake, yet potential carcinogenic reclassification in the U.S. could temper growth.
Niche arenas - battery electrolytes, UV-curable inks, semiconductor cleaning - offer higher margins but modest tonnage. Producers capable of delivering sub-10 ppm peroxide purity can achieve price multiples of 1.3-1.4 over standard grades. Continued investment in high-purity BDO back-integration supports this specialty trajectory.
By End-Use Industry: Textiles Dominate Today, Infrastructure Lifts Coatings Tomorrow
Textiles controlled 58.24% of THF end-use demand in 2025 owing to China-centric spandex, but that concentration leaves the tetrahydrofuran market exposed when apparel cycles turn, as seen in the Q4-2024 price dip. Paints and coatings are next in line, set for a 3.88% CAGR through 2031 as India’s 1.5 million-ton PVC expansion unlocks fresh solvent pull for pipe cements and profile adhesives.
Pharma uptake continues to rise on the back of greener-solvent mandates in Europe, although a potential U.S. re-classification of THF’s carcinogenic risk keeps compliance teams alert[1]U.S. Environmental Protection Agency, “THF IRIS Toxicological Review,” epa.gov. Polymer converters add a smaller but strategic slice: Hengli’s coal-based BDO now feeds its own PBAT and PBT lines, signaling that internal consumption can tighten merchant THF supply. Semiconductor fabs are also demanding ultra-high-purity THF, a niche that rewards producers able to hit 99.99% specs.

By Distribution Channel: Direct Sales Expand as Compliance Costs Mount
Direct sales captured 75.16% of 2025 volume and are projected to climb at a 4.33% CAGR as integrated majors deal directly with end-users, bypassing smaller distributors squeezed by tighter exposure limits and rising insurance premiums[2]Occupational Safety and Health Administration, “Chemical Exposure Limits,” osha.gov. BASF’s USD 0.10/lb North American hike in April 2025 went directly to customers, and its plan to shutter a South Korean PolyTHF site while consolidating in China trims transaction nodes even further.
Independents still handle 24.84% of trade, mainly serving niche formulators that cannot meet 20-ton order minimums. Yet compliance upgrades—from 50 ppm worker-exposure limits to mandatory peroxide monitoring—add USD 50–150 per ton in logistics and insurance, costs only scaled distributors can absorb. China’s 6% MFN duty on Taiwanese THF jolted regional traders in 2024, underlining how policy shifts can make or break smaller channels overnight.
Geography Analysis
Asia-Pacific controlled 85.24% of global volume in 2025, fueled by consolidated spandex hubs in coastal China, inland coal-to-BDO complexes, and expanding PVC pipe demand in India. Recent tariff changes raised costs on Taiwanese imports, steering buyers toward domestic Chinese suppliers and reinforcing regional self-sufficiency. Trial runs at a 600,000-ton coal-based BDO plant in northeast China leverage low-cost hydrogen and power, yet most output feeds internal biodegradable-polyester chains, curbing merchant availability and propping up coastal spot prices. The tetrahydrofuran market in this region is forecast to grow at a 4.36% CAGR through 2031 as integrated players expand downstream footprints.
North America shows mature but specialized demand shaped by stringent safety oversight. A 100,000-ton BDO unit in Texas targets pharmaceutical and electronics-grade THF niches, while a 2025 price increase of USD 0.10 per pound illustrates supplier focus on margin preservation over share expansion. Ongoing investigations into solvent incidents heighten compliance costs, accelerating distributor attrition and pushing end-users toward direct procurement from major producers.
Europe blends the strictest regulatory framework with the fastest uptake of bio-balance grades. Biomass-certified THF enjoys premiums of 15-20% as compounders chase Scope 3 cuts, yet facilities must navigate lengthy permitting cycles under updated industrial-emission directives. A 60,000-ton high-purity BDO expansion in Germany underpins supply for pharmaceutical and battery-grade THF, aligning with the region’s specialization in high-value applications.
South America and the Middle East-Africa remain smaller in tonnage but feature strategic capacity plans. A feedstock allocation granted in Saudi Arabia for a mixed-feed cracker could place new THF capacity online after 2028, while a USD 6.4 billion petrochemical complex in China backed by Middle-Eastern investment illustrates outward integration rather than local THF build-outs.

Competitive Landscape
The global tetrahydrofuran market is moderately consolidated. BASF is divesting smaller Asian assets while concentrating Asian production at a single Chinese hub and expanding high-purity output in Germany. Mitsubishi Chemical’s subdued 2.6% 2024 ROE highlights capital pressure in commodity lines, prompting a pivot to digitalization and green transformation themes. Dairen Chemical’s process-intensification upgrades underscore operational excellence as a hedge against feedstock volatility. Emerging challengers favor captive integration. Hengli Petrochemical directs most of its new coal-to-BDO output into internal polyester chains, limiting spot feedstock availability and supporting regional premiums. Huafon couples a 20,000-ton THF unit with 500,000 tons of PTMEG, locking in the value chain from solvent to fiber. Technology differentiation is growing: Japan’s first circular cracker processes pyrolysis oil, hinting at future circular-economy THF options, though catalyst fouling and product-quality hurdles remain unresolved. Regulatory costs form an additional barrier, with European permits costing up to EUR 2 million and taking two years, reducing the attractiveness for greenfield entrants without scale.
Tetrahydrofuran (THF) Industry Leaders
BASF SE
DCC
LyondellBasell Industries Holdings B.V.
Mitsubishi Chemical Group Corporation
INVISTA
- *Disclaimer: Major Players sorted in no particular order


Recent Industry Developments
- April 2025: BASF raised North American list prices for THF, BDO, and PolyTHF by USD 0.10 per pound to offset feedstock inflation and protect margins.
- May 2024: BASF added BDO, THF, PolyTHF, and DMAPA to its biomass-balance portfolio after securing ISCC PLUS and REDcert2 certification in Germany and the United States.


Research Methodology Framework and Report Scope
Market Definitions and Key Coverage
Our study defines the tetrahydrofuran market as the annual production and sale of virgin THF obtained through maleic-anhydride/BDO and emerging bio-based routes, reported in both volume (tons) and the revenue those tons earn at prevailing merchant prices.
Reclaimed solvent streams and downstream derivative sales such as PTMEG are excluded to avoid double counting.
Segmentation Overview
- By Process Route
- Maleic Anhydride-BDO Route
- Bio-based (Succinic/Furfural) Route
- By Application
- Polytetramethylene Ether Glycol (PTMEG)
- Solvent
- Other Applications
- By End-Use Industry
- Polymer
- Textile
- Pharmaceutical
- Paints and Coatings
- Other End-Uses
- By Distribution Channel
- Direct Sales / OEM
- Distributors and Traders
- By Geography
- Asia-Pacific
- China
- India
- Japan
- South Korea
- ASEAN
- Rest of Asia-Pacific
- North America
- United States
- Canada
- Mexico
- Europe
- Germany
- United Kingdom
- France
- Italy
- Spain
- Rest of Europe
- South America
- Brazil
- Argentina
- Chile
- Rest of South America
- Middle-East and Africa
- Saudi Arabia
- South Africa
- Rest of Middle-East and Africa
- Asia-Pacific
Detailed Research Methodology and Data Validation
Primary Research
Interviews with plant engineers, solvent distributors, spandex formulators, and independent Asian price assessors help us verify utilization rates, typical contract spreads over butanediol, and the real-world split between merchant and captive volumes. This gives us confidence that secondary signals align with operating reality across Asia-Pacific, Europe, and the Americas.
Desk Research
Mordor analysts review open-access sources such as United States Geological Survey solvent statistics, Eurostat CN 29321100 customs codes, Japan Chemical Fibers Association consumption releases, and China's National Bureau of Statistics production bulletins, which together outline regional supply, trade, and downstream textile pull.
Company 10-Ks, investor decks, and chemical-industry press posts clarify capacity additions and scheduled turnarounds.
For quantitative depth, we tap D&B Hoovers for producer financials and Dow Jones Factiva for price-linked earnings calls.
These references illustrate rather than exhaust the pool that underpins our desk work.
Market-Sizing & Forecasting
First, we construct a top-down demand pool from country-level PTMEG, PVC, and solvent requirements, then back-solve the THF tons implied by substrate loading factors.
Those totals are cross-checked with a bottom-up roll-up of listed plant capacities, typical 82-88% run rates, and sampled free-on-board prices, adjusting where the two disagree.
Key variables include spandex output, butanediol feed cost, average spot THF price, capacity additions, and bio-based penetration.
Multivariate regression combined with scenario analysis projects each driver, letting us create a 2025-2030 forecast corridor.
Gaps in bottom-up data are bridged by regional shipment proxies and interview-confirmed utilization bands.
Data Validation & Update Cycle
Outputs pass three-layer variance checks, senior analyst review, and re-contact loops when price shocks or plant outages exceed preset thresholds.
Reports refresh annually; urgent events trigger interim updates before client release.
Why Our Tetrahydrofuran Baseline Commands Reliability
Published estimates differ because firms choose distinct inclusions, price decks, and refresh cadences.
Key gap drivers here are: some studies fold PTMEG value into THF totals, others apply aggressive $2,400-plus per-ton price strips, and several rely on desktop capacity tables that ignore Asian downtime. Mordor simplifies scope, pairs a $1,750/ton blended 2025 price from IMARC with verified merchant volumes, and refreshes every twelve months, yielding a grounded baseline.
Benchmark comparison
| Market Size | Anonymized source | Primary gap driver |
|---|---|---|
| USD 1.75 Bn (2025) | Mordor Intelligence | - |
| USD 4.82 Bn (2024) | Global Consultancy A | Includes captive THF within PTMEG plants and applies higher $2,200/ton price |
| USD 4.46 Bn (2024) | Regional Consultancy B | Uses single Asia-Pacific growth proxy, limited primary checks |
| USD 4.73 Bn (2025) | Industry Portal C | Forecasts to 2035 with unchanged utilization assumptions |
Converted from Mordor's 1 million-ton 2025 volume using a blended merchant price of USD 1,750/ton.
In summary, by anchoring scope to merchant tons, validating every assumption with field contacts, and refreshing yearly, Mordor Intelligence offers decision-makers a transparent, reproducible, and balanced THF baseline they can trust.


Key Questions Answered in the Report
What is the projected volume of the global tetrahydrofuran market in 2031?
The market is forecast to reach 1.25 million tons by 2031, reflecting a 4.16% CAGR from 2026.
Which application holds the largest share of THF consumption?
PTMEG production accounts for 78.89% of 2025 volume and remains the key demand anchor.
Why are bio-based THF grades gaining traction in Europe?
Biomass-balance certification lets downstream users claim Scope 3 emission cuts without process changes, justifying 15-20% price premiums.
How are stricter exposure limits influencing the supply chain?
Tougher OSHA and REACH thresholds raise compliance costs, forcing small distributors out and boosting direct sales by integrated producers.
Which region dominates THF demand and why?
Asia-Pacific commands 85.24% of volume due to concentrated spandex-fiber and PVC-pipe growth in China, India, and Southeast Asia.
What safety factors are driving up insurance premiums for THF handling?
THF’s low flash point and peroxide-formation risk, evidenced by recent plant and shipping incidents, have prompted insurers to impose double-digit premium increases.
Page last updated on:


