Naphtha Market Size and Share
Market Overview
| Study Period | 2021 - 2031 |
|---|---|
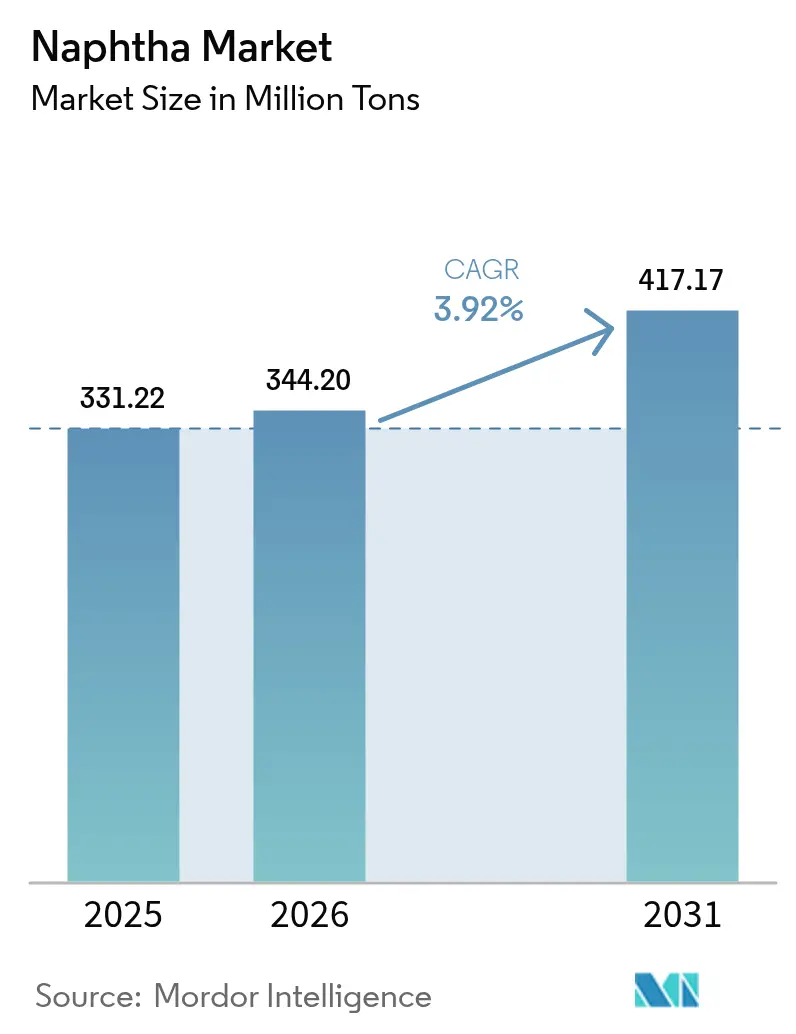
| Market Volume (2026) | 344.20 Million tons |
| Market Volume (2031) | 417.17 Million tons |
| Growth Rate (2026 - 2031) | 3.92% CAGR |
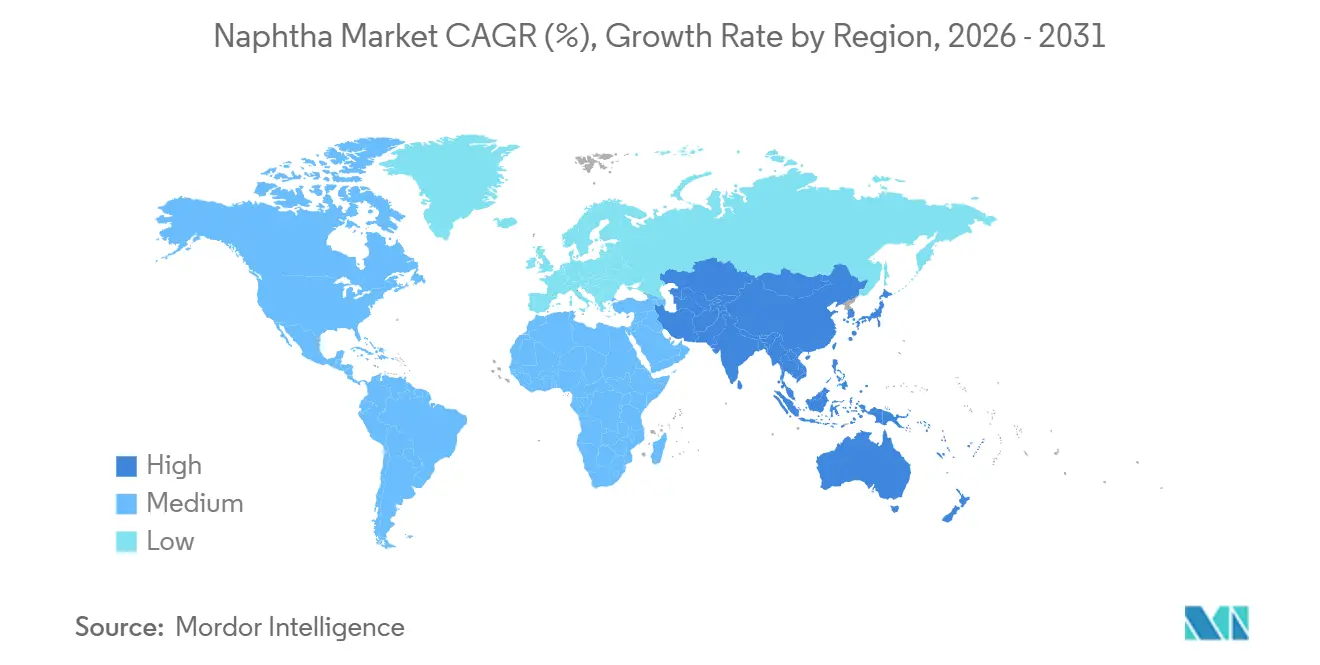
| Fastest Growing Market | Asia Pacific |
| Largest Market | Asia Pacific |
| Market Concentration | Medium |
Major Players *Disclaimer: Major Players sorted in no particular order Image © Mordor Intelligence. Reuse requires attribution under CC BY 4.0. | |
Naphtha Market Analysis by Mordor Intelligence
The Naphtha Market size is expected to grow from 331.22 million tons in 2025 to 344.20 million tons in 2026 and is forecast to reach 417.17 million tons by 2031 at a 3.92% CAGR over 2026-2031. Asian steam crackers are increasingly securing multi-year supply agreements. Meanwhile, European refiners are shifting their focus toward circular pyrolysis oil, and North American condensate splitters are adjusting their regional availability. In the naphtha market, light fractions are prioritized because catalytic reformers rely on low-end boiling-point feedstocks to optimize high-octane gasoline blendstocks and aromatics. While refinery-integrated producers continue to steer global flows, the most significant growth is observed in bio-naphtha. This segment is supported by policy-linked premiums in Europe and California. Current regional trends indicate a rising import demand in the Asia-Pacific, a push for self-sufficiency in North America, and a rapid transition toward circular-feedstock substitution in the Middle-East.
Key Report Takeaways
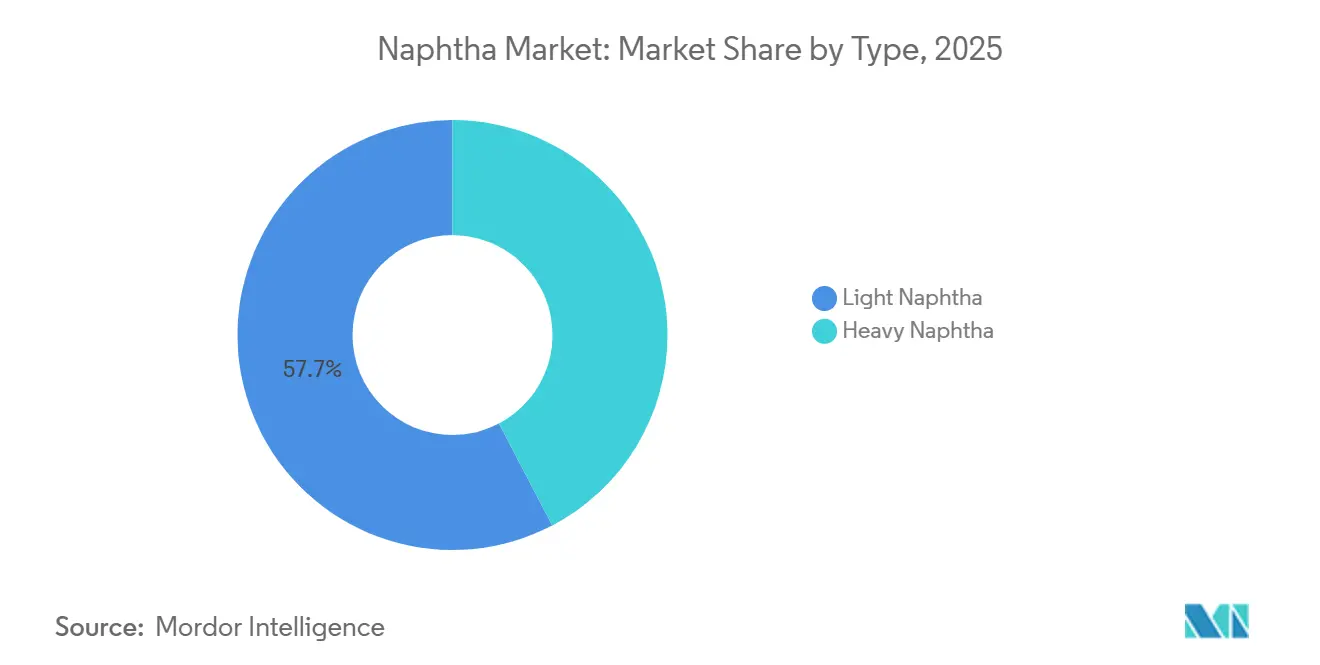
- By type, light naphtha captured 57.68% of naphtha market share in 2025 and is forecast to post a 4.67% CAGR through 2031.
- By source, refinery-derived grades retained 79.63% of naphtha market size in 2025, while bio-naphtha records the fastest 5.48% CAGR to 2031.
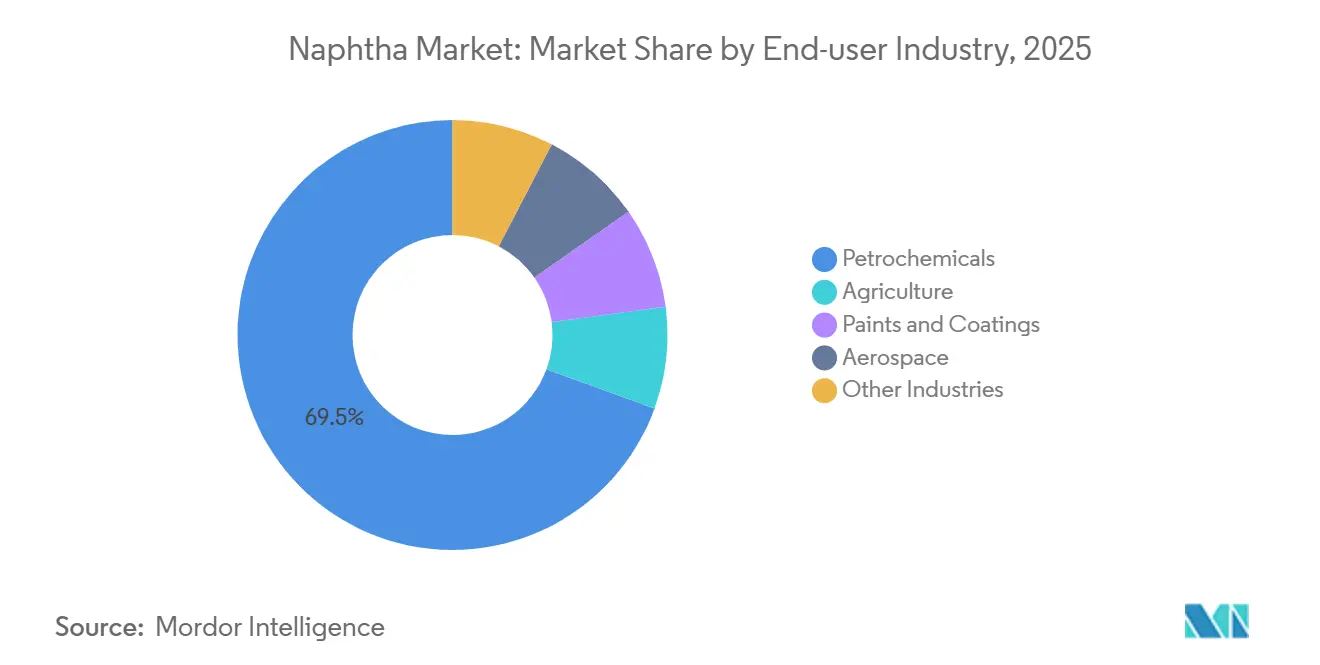
- By end-user, petrochemicals consumed 69.45% of global volume in 2025 and is advancing at a 4.41% CAGR to 2031.
- By geography, Asia-Pacific held 44.12% of demand in 2025 and is expanding at a 4.68% CAGR, outpacing every other region.
Note: Market size and forecast figures in this report are generated using Mordor Intelligence’s proprietary estimation framework, updated with the latest available data and insights as of 2026.
Global Naphtha Market Trends and Insights
Drivers Impact Analysis*
| Driver | (~) % Impact on CAGR Forecast | Geographic Relevance | Impact Timeline |
|---|---|---|---|
| Surging Demand for Olefins and Aromatics Feedstocks from Asian Steam Crackers | +1.20% | Asia-Pacific core (China, India, South Korea), spillover to Middle East exports | Medium term (2-4 years) |
| Integration of Naphtha Reformers with Refinery Upgrading Projects in the Middle East | +0.80% | Middle-East and Africa (Saudi Arabia, UAE, Qatar), with export implications for Asia-Pacific | Long term (≥4 years) |
| Rising Demand for Fertilizers in India | +0.40% | India, with secondary effects in South Asia | Short term (≤2 years) |
| Rising Investments in USGC Condensate Splitters Targeting Light Naphtha Output | +0.60% | North America (US Gulf Coast), reducing import dependency | Medium term (2-4 years) |
| Bio-Naphtha Scale-up Backed by Renewable-fuel Mandates | +0.50% | Europe (RED II/III compliance), North America (RFS), emerging in Asia-Pacific | Long term (≥4 years) |
| Source: Mordor Intelligence | |||
Surging Demand for Olefins and Aromatics Feedstocks From Asian Steam Crackers
In the Asia-Pacific region, including China, India, and South Korea, new ethylene capacities are rapidly absorbing incremental supplies, outpacing global output growth. During the base year 2025, regional naphtha demand was supported by Zhejiang Petrochemical’s Phase II lines and Shenghong’s integrated refinery-cracker complex. India's petrochemical sector is shifting toward naphtha over coal gasification due to its lower carbon intensity. South Korean complexes, through efficient debottlenecking, have maintained high utilization rates despite macroeconomic volatility. Although ethane and LPG imports are increasing, China continues to rely on naphtha for aromatics production, as heavier cuts still provide yield advantages. This dynamic creates a structural demand that supports the naphtha market, even as other regions experience a downturn.
Integration of Naphtha Reformers With Refinery Upgrading Projects in the Middle-East
ADNOC's Ruwais Chemicals 2.0 and Saudi Aramco's Amiral projects are converting low-value straight-run naphtha into high-octane gasoline and aromatics, ensuring they utilize the output[1]ADNOC, “ADNOC Starts Commercial Operations at Ruwais Chemicals 2.0,” adnoc.ae . Concurrently, QatarEnergy's expansion at Ras Laffan not only amplifies the regional supply but also ties those barrels to long-term contracts. Consequently, with a diminished pool of available merchant barrels, Asian buyers are paying elevated premiums for spot cargoes. In the future, the emergence of each new crude-to-chemicals facility is tightening its hold on the value chain, further cementing the bond between the naphtha market and refineries in the Middle-East.
Rising Demand for Fertilizers in India
In 2025, Indian producers, supported by a domestic urea subsidy program, utilized naphtha for ammonia synthesis[2]Ministry of Chemicals and Fertilizers, “Fertilizer Subsidy Allocation 2024-2025,” fert.nic.in . The co-located refinery-fertilizer model in Panipat reduces logistics costs, ensuring that naphtha remains competitive with coal and LNG. Policy reforms have aligned domestic gas prices with global indices, narrowing historical cost gaps. However, naphtha's feed flexibility provides producers with a buffer against surging gas prices. While green-ammonia pilots could reduce demand after 2030, current subsidies are driving increased volumes.
Rising Investments in USGC Condensate Splitters Targeting Light Naphtha Output
Enterprise's Mont Belvieu splitter and Phillips 66's enhanced Sweeny Hub are currently increasing the supply of light naphtha to the petrochemical corridor that extends from Texas to Louisiana. This increase in naphtha supply is replacing cargoes from the Middle-East and West Africa, which had previously fulfilled a significant portion of the U.S. cracker demand. As Targa Resources constructs additional splitters, the supply is becoming increasingly localized. This shift is reducing global arbitrage opportunities and creating a more segmented naphtha market, highlighting a trend toward regional self-sufficiency.
Restraints Impact Analysis*
| Restraint | (~) % Impact on CAGR Forecast | Geographic Relevance | Impact Timeline |
|---|---|---|---|
| Volatile crude-naphtha spreads undermining margins | -0.90% | Global, with acute pressure in Northeast Asia (Japan, South Korea) and Europe | Short term (≤2 years) |
| Propane-dehydrogenation build-out lowering naphtha demand for propylene | -0.70% | China (primary), North America, Middle-East | Medium term (2-4 years) |
| EU chemical-recycling pyrolysis oil gaining feedstock share | -0.40% | Europe (Germany, Netherlands, Belgium), with pilot projects in North America | Long term (≥4 years) |
| Source: Mordor Intelligence | |||
Volatile Crude-Naphtha Spreads Undermining Margins
In early 2025, OPEC+ cuts tightened the supply of light crude. This led to reduced refinery-naphtha differentials and pushed Asian cracker margins to low levels. Japanese operators responded by reducing their rates. Meanwhile, European crackers faced similar pressures, largely due to the diversion of Russian barrels to the east. This volatility in spreads not only deterred long-term contracting but also accelerated the diversification of feedstocks toward ethane, LPG, and circular streams. As a result, short-term growth in the naphtha market was dampened.
Propane-Dehydrogenation Build-Out Lowering Naphtha Demand for Propylene
Between 2020 and 2025, China ramped up its PDH capacity, bolstering its propylene self-sufficiency and squeezing margins tied to naphtha. Meanwhile, in the United States, shale-driven propane is maintaining favorable feedstock economics, especially when prices remain low. The addition of each new PDH unit shifts the balance of derivatives, limiting the growth potential for the naphtha market size that is linked to propylene co-production.
*Our forecasts treat driver/restraint impacts as directional, not additive. The impact forecasts reflect baseline growth, mix effects, and variable interactions.
Segment Analysis
By Type: Light Fractions Drive Reformer Demand
Light grades, accounting for 57.68% of the 2025 volume, are projected to grow at a forecasted 4.67% CAGR during the 2026-2031 period. This growth is primarily attributed to catalytic reformers, which enhance gasoline octane and increase aromatic yields. As Asia-Pacific and the Middle-East tighten vehicle fuel standards, the demand for higher-octane blending remains robust, indicating consistent growth. Heavy naphtha is predominantly used in steam cracking, leading to the co-production of ethylene and propylene. Despite challenges from ethane and LPG substitutions, Japan and South Korea, due to the absence of indigenous natural-gas liquids, have solidified their reliance on imports. This trend is also reflected in bio-equivalents: renewable light naphtha is directed to reformers, while heavier cuts are utilized in crackers, notably at TotalEnergies’ Gonfreville unit.
Refiners, including Reliance’s Jamnagar and Saudi Aramco’s Ras Tanura, have strategically adjusted their process slates to prioritize aromatics, which command premium prices. Although heavy fractions exhibit slower growth, their role in integrated complexes remains significant, with their strategic proximity compensating for tighter margins. The U.S. Gulf Coast demonstrates notable feedstock flexibility, with splitters skillfully navigating streams between gasoline, petrochemicals, and export avenues, capitalizing on market arbitrage.


By Source: Refinery Dominance Persists Amid Bio-Naphtha Momentum
In 2025, refinery-derived grades captured a commanding 79.63% share of the naphtha supply, highlighting the deepening ties between refineries and the petrochemical sector. Among crude slates, Murban and Arab Light are notable, producing outputs that can be double those from heavier sour crudes in select Asia-Pacific regions. Saudi Aramco and Reliance, working in concert, export substantial volumes to Asia-Pacific markets each year, reinforcing their influence on pricing.
Bio-naphtha boasts a notable 5.48% CAGR during the forecast period of 2026-2031. Neste spearheads the movement, making significant annual contributions, followed by ENI and TotalEnergies. Their expansion is, however, intricately tied to policy credits. On the other hand, coal- and gas-to-liquids processes linger on the periphery. Their economic viability is stunted by high capital intensity and carbon penalties, limiting their influence on the overall naphtha market growth.
By End-User Industry: Petrochemicals Anchor Demand, Niche Sectors Diversify
In 2025, petrochemicals accounted for 69.45% of global naphtha consumption and are projected to grow at a CAGR of 4.41% during the forecast period of 2026-2031, highlighting the critical role of ethylene and propylene in supporting global plastics demand. Asia-Pacific, which holds a significant share of the world's cracker capacity, experienced intensified regional activity, particularly with the establishment of new mega-sites in China. In India, agricultural consumption of naphtha remained concentrated, supported by subsidy regimes that facilitated ammonia synthesis, especially during periods of high LNG prices.
While sectors such as paints, coatings, and aerospace utilized smaller volumes of naphtha, they consistently demanded premium-quality products for specific purity and solvent properties. Industries such as rubber, adhesives, and pharmaceuticals also represented a notable portion of global naphtha consumption, with their usage trends aligning with the broader industrial production landscape. This diversification across sectors reduced risks associated with dependence on a single industry, while petrochemicals remained a strategic cornerstone of the naphtha market.
Geography Analysis
In 2025, Asia-Pacific accounted for 44.12% of global consumption, a surge fueled by capacity expansions in China and India, leading to a year-on-year spike in import demand. This region is projected to register a CAGR of 4.68% during the forecast period of 2026-2031. Chinese refiners, leveraging integrated cracker systems, are gearing up for consistent long-term absorption, especially with the integration of lighter LPG and ethane. On the other hand, India's appetite for petrochemicals and fertilizers, bolstered by government subsidies, ensures robust short-term volumes. Despite grappling with tighter margins and operational streamlining, Japan and South Korea's dependence on imports persists, a consequence of limited domestic crude availability.
North America inches closer to self-sufficiency. Domestic condensate splitters are producing light grades, and steam crackers are pivoting towards ethane, curbing foreign reliance. However, the aromatics value chains remain pivotal for light cuts, with regional traders reaping benefits from Canadian oil-sand upgraders. In contrast, Mexico's Pemex, hampered by outdated legacy refineries, struggles with essential upgrades and continues to import gasoline blendstock.
Europe faces contraction challenges. Soaring energy costs, alongside stringent circular-economy mandates, are propelling the use of pyrolysis oil. In 2025, both BASF's Ludwigshafen and SABIC's Geleen crackers made significant strides in processing circular feed, curbing the demand for virgin naphtha. Additionally, the adoption of bio-naphtha in France and Italy underscores a policy-driven transition, one poised to persist as recycled-content targets become more stringent.
South America, while reliant on Petrobras for output, eyes Argentina's Vaca Muerta as a potential light-naphtha source, pending the completion of its condensate-processing facilities. However, the temptation of affordable U.S. ethane derivatives is moderating regional cracker investments, leading to tempered demand growth. In the Middle-East and Africa, ambitious projects at Ruwais, Amiral, and Dangote are reshaping supply dynamics, prioritizing local conversion over exports and directing flows to more profitable downstream markets.

Competitive Landscape
The global naphtha market is moderately fragmented. Integrated refiner-petrochemical giants such as Saudi Aramco, Reliance Industries, Sinopec, and ExxonMobil dominate the global output. This dominance not only ensures supply security but also provides significant cost advantages. Strategically, they channel captive naphtha flows into nearby crackers, a tactic designed to stabilize earnings during periods of margin compression. Meanwhile, merchant crackers in the North-East Asia and Europe regions, which are vulnerable to shifts in the crude-naphtha spread, are broadening their portfolios to include LPG, ethane, and pyrolysis oil.
While bio-naphtha specialists such as Neste, TotalEnergies, and ENI account for a smaller share of the global capacity, they command premium prices in regions with strict renewable mandates. Technological expertise plays a critical role: LyondellBasell’s Catofin PDH licenses leverage propane economics, while BASF’s ChemCycling highlights feedstock adaptability for achieving circular economy objectives.
New opportunities are emerging in carbon-capture integration, sourcing aromatics from renewable sources, and establishing storage or blending hubs to address regional imbalances. Compliance measures, particularly ISCC PLUS, are gaining momentum as brand owners increasingly consider Scope 3 emissions across their supply chains. As measures promoting a circular economy gain traction and investments in PDH technologies mature, competition is expected to intensify.
Naphtha Industry Leaders
BP p.l.c.
Exxon Mobil Corporation
Shell plc
Saudi Arabian Oil Co.
Reliance Industries Limited
- *Disclaimer: Major Players sorted in no particular order


Recent Industry Developments
- April 2025: QatarEnergy has entered into a landmark 20-year agreement with Shell to supply up to 18 million metric tons of naphtha. This long-term deal is expected to enhance supply stability and strengthen QatarEnergy's position in the global naphtha market, potentially influencing pricing dynamics and ensuring a reliable supply chain for downstream industries.
- January 2025: Indian Oil Corporation Ltd. signed a memorandum of understanding with the government of Odisha to develop a naphtha cracker project in the port town of Paradip, with an estimated investment of INR 61,000 crore. This project is expected to significantly enhance the naphtha market by increasing production capacity.


Global Naphtha Market Report Scope
Naphtha is a light flammable liquid containing a mixture of hydrocarbon molecules, typically between 5 and 10 carbon atoms. It mainly consists of straight-chain alkanes (paraffin), but it may also have cyclohexanes (naphthenes) and aromatics.
The naphtha market is segmented by type, source, end-user industry, and geography. By type, the market is segmented into light naphtha and heavy naphtha. By source, the market is segmented into refinery-based, bio-naphtha, and others. By end-user industry, the market is segmented into petrochemical, agriculture, paints and coatings, aerospace, and other industries. The report also covers the market size and forecasts for naphtha in 17 countries across major regions. For each segment, the market sizing and forecasts have been done on the basis of volume (tons).
| Light Naphtha |
| Heavy Naphtha |
| Refinery-based |
| Bio-Naphtha |
| Others |
| Petrochemicals |
| Agriculture |
| Paints and Coatings |
| Aerospace |
| Other Industries |
| Asia-Pacific | China |
| India | |
| Japan | |
| South Korea | |
| Rest of Asia-Pacific | |
| North America | United States |
| Canada | |
| Mexico | |
| Europe | Germany |
| United Kingdom | |
| France | |
| Italy | |
| Rest of Europe | |
| South America | Brazil |
| Argentina | |
| Rest of South America | |
| Middle-East and Africa | Saudi Arabia |
| United Arab Emirates | |
| South Africa | |
| Nigeria | |
| Rest of Middle-East and Africa |
| By Type | Light Naphtha | |
| Heavy Naphtha | ||
| By Source | Refinery-based | |
| Bio-Naphtha | ||
| Others | ||
| By End-user Industry | Petrochemicals | |
| Agriculture | ||
| Paints and Coatings | ||
| Aerospace | ||
| Other Industries | ||
| By Geography | Asia-Pacific | China |
| India | ||
| Japan | ||
| South Korea | ||
| Rest of Asia-Pacific | ||
| North America | United States | |
| Canada | ||
| Mexico | ||
| Europe | Germany | |
| United Kingdom | ||
| France | ||
| Italy | ||
| Rest of Europe | ||
| South America | Brazil | |
| Argentina | ||
| Rest of South America | ||
| Middle-East and Africa | Saudi Arabia | |
| United Arab Emirates | ||
| South Africa | ||
| Nigeria | ||
| Rest of Middle-East and Africa | ||


Key Questions Answered in the Report
How fast is global demand for naphtha growing toward 2031?
The naphtha market stands at 344.20 million tons in 2026 and is forecast to reach 417.17 million tons by 2031 at a 3.92% CAGR from 2026 to 2031.
Which region will lead incremental consumption over the next five years?
Asia-Pacific adds the most barrels, propelled by new Chinese and Indian steam crackers that keep regional growth at a 4.68% CAGR.
What factor most threatens naphtha’s use in propylene production?
Large propane-dehydrogenation units in China and North America erode naphtha demand by supplying on-purpose propylene at lower cost.
Why is bio-naphtha gaining attention despite its small volume share?
Renewable-fuel mandates deliver price premiums and decarbonization credits, giving bio-naphtha a 5.48% CAGR that far outstrips fossil growth.
How are U.S. Gulf Coast splitters reshaping trade flows?
New splitters convert light shale condensate into domestic light naphtha, cutting Middle Eastern and West African imports that once met 25% of U.S. cracker needs.
What competitive edge do integrated refiner-petrochemical companies hold?
Captive feedstock supply lowers input costs and secures margin during crude-naphtha spread volatility, a benefit unavailable to merchant crackers.
Page last updated on:


