Digital Wound Measurement Devices Market Size and Share
Market Overview
| Study Period | 2020 - 2031 |
|---|---|
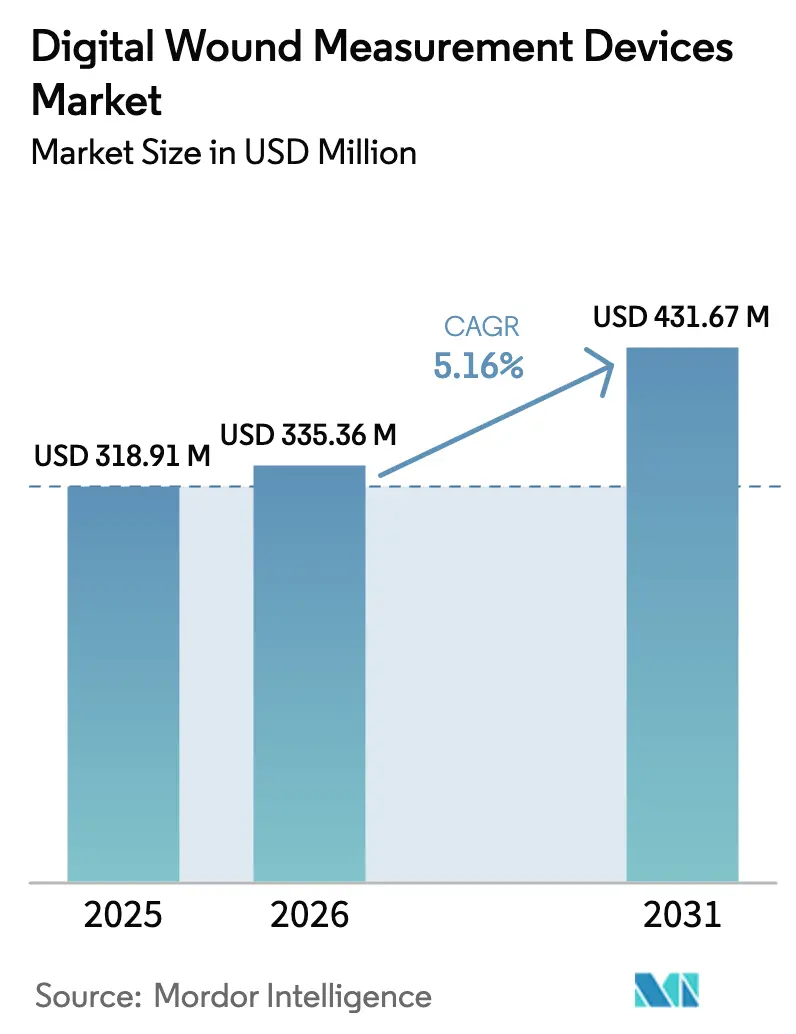
| Market Size (2026) | USD 335.36 Million |
| Market Size (2031) | USD 431.67 Million |
| Growth Rate (2026 - 2031) | 5.16% CAGR |
| Fastest Growing Market | Asia-Pacific |
| Largest Market | North America |
| Market Concentration | Medium |
Major Players *Disclaimer: Major Players sorted in no particular order Image © Mordor Intelligence. Reuse requires attribution under CC BY 4.0. | |
Digital Wound Measurement Devices Market Analysis by Mordor Intelligence
The digital wound measurement devices market size is expected to grow from USD 318.91 million in 2025 to USD 335.36 million in 2026 and is forecast to reach USD 431.67 million by 2031 at 5.16% CAGR over 2026-2031. The sector gains momentum as healthcare providers shift from subjective visual inspection toward AI-supported measurement that trims treatment cycles and aligns with value-based payment models. Growth rides on the parallel rise of chronic diseases, aging populations, and pressure to ease the USD 96 billion annual wound care bill through precise documentation that speeds healing and lowers readmissions. Hardware still dominates capital spending, yet software-driven platforms now capture hospital and home-care workflows, widening access to specialist insight. Regionally, mature markets emphasize cost containment while high-growth economies adopt mobile-first solutions that leapfrog legacy systems, reshaping competitive priorities across the digital wound measurement devices market.
Key Report Takeaways
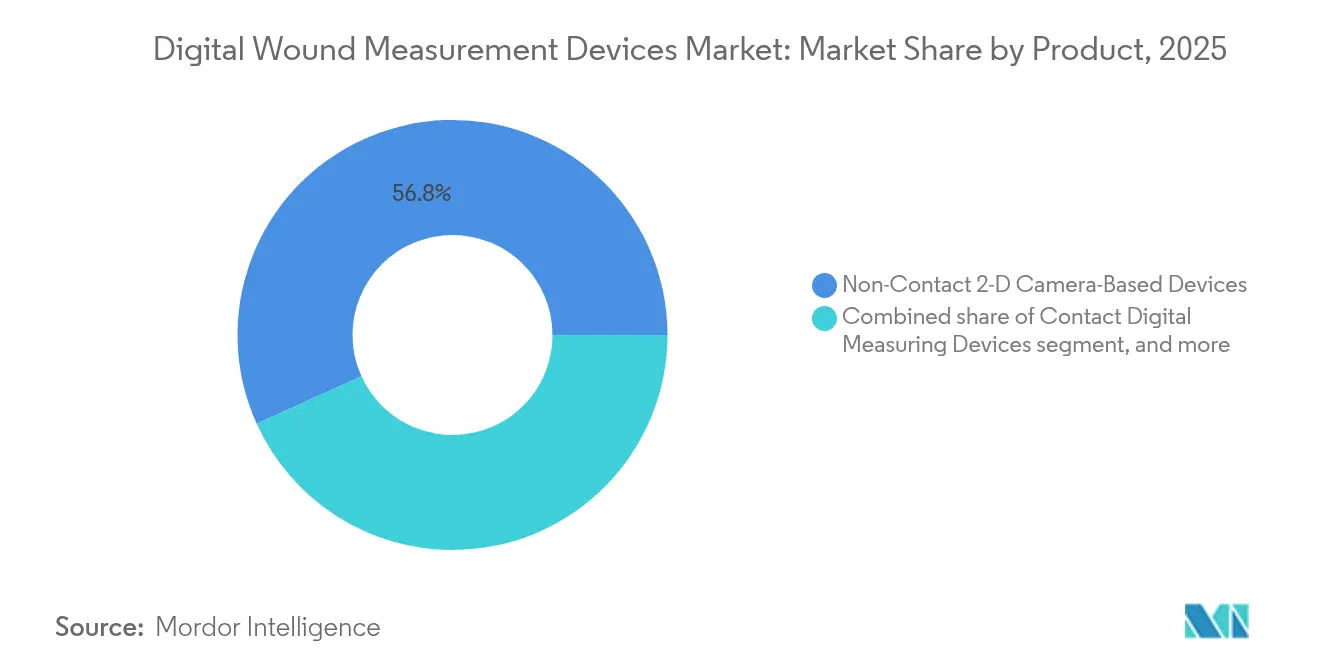
- By product, Non-Contact 2-D camera devices led with 56.78% of the digital wound measurement devices market share in 2025, whereas AI-enabled software-only solutions are poised to grow at a 7.12% CAGR through 2031.
- By technology, 2-D digital planimetry held 48.05% of the digital wound measurement devices market size in 2025, while 3-D stereophotogrammetry is projected to expand at a 7.38% CAGR between 2026-2031.
- By wound type, chronic wounds represented 38.02% of applications in 2025, yet acute wounds are tracking an 8.42% CAGR to 2031.
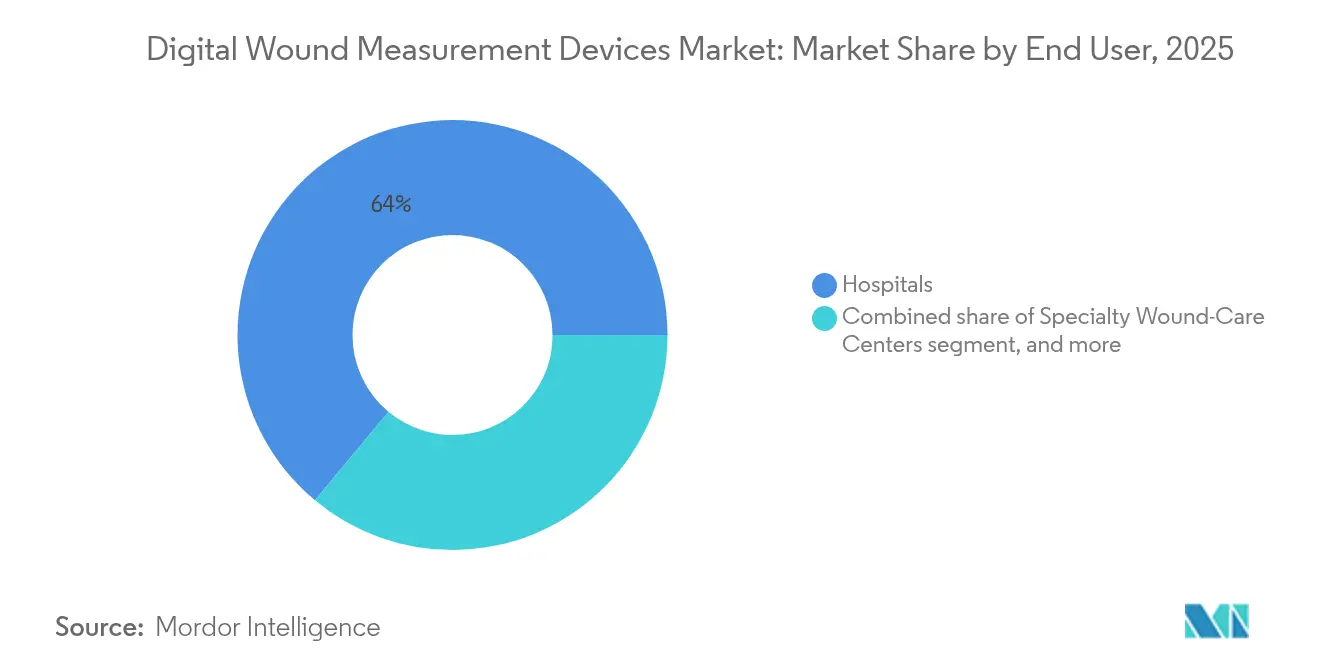
- By end user, hospitals accounted for 63.95% share of the digital wound measurement devices market size in 2025, whereas home healthcare settings should advance at an 8.22% CAGR through 2031.
- By healthcare setting, in-patient wards controlled 54.62% market share during 2025, nevertheless, home-based care charts an 8.05% CAGR.
- By geography, North America accounted for 39.78% share of the digital wound measurement devices market size in 2025, whereas Asia-Pacific is projected to grow at fastest CAGR of 6.31%.
Note: Market size and forecast figures in this report are generated using Mordor Intelligence’s proprietary estimation framework, updated with the latest available data and insights as of 2026.
Global Digital Wound Measurement Devices Market Trends and Insights
Driver Impact Analysis*
| Driver | % Impact on CAGR Forecast | Geographic Relevance | Impact Timeline |
|---|---|---|---|
| Rising prevalence of chronic and acute wounds | +1.2% | Global, strong in North America & Europe | Long term (≥ 4 years) |
| Increasing adoption of digital health and telemedicine platforms | +0.8% | APAC core, spill-over to North America | Medium term (2-4 years) |
| Growing emphasis on value-based wound care and clinical outcomes | +0.9% | North America & EU, expanding to APAC | Medium term (2-4 years) |
| Technological advancements in imaging and artificial intelligence | +1.1% | Global, led by North America hubs | Short term (≤ 2 years) |
| Expanding geriatric population and surgical procedures | +1.0% | Global, faster in developed markets | Long term (≥ 4 years) |
| Favorable regulatory and reimbursement support for digital solutions | +0.7% | North America & EU | Medium term (2-4 years) |
| Source: Mordor Intelligence | |||
Rising Prevalence of Chronic and Acute Wounds Worldwide
Diabetic foot ulcers now affect one quarter of the 537 million global diabetes population, while pressure ulcers and surgical site infections add to the escalating care burden. Chronic wounds consume 2-4% of national healthcare budgets, and a single diabetic foot ulcer episode can cost up to USD 27,721. Early use of digital measurement curbs healing time by as much as 50%, freeing clinical capacity and cutting resource waste. Cardiovascular disease, mobility disorders, and demographic aging broaden the wound population, reinforcing secular demand for precise tools. Consequently, clinicians and payers view the digital wound measurement devices market as an indispensable element in long-range chronic-disease management.
Technological Advancements in Imaging and Artificial Intelligence
MolecuLight fluorescence imaging detects bacterial load with 100% sensitivity, guiding targeted antibiotics that shorten recovery and lower expenses. Hyperspectral devices such as Kent Imaging SnapshotNIR quantify tissue oxygenation, showing wounds resolve 13.5 days after visible closure, thus offering earlier confidence for discharge decisions. Stereophotogrammetry now reaches sub-millimeter accuracy, and FDA-cleared smartphone apps like eKare inSight transform everyday cameras into clinical instruments[1]Advances in Skin & Wound Care, “SnapshotNIR Validation Study,” advancesinskinandwoundcare.com. Continuous AI refinement creates a data flywheel: wider use generates richer datasets that further sharpen algorithms, enlarging the digital wound measurement devices market through compounded accuracy gains.
Growing Emphasis on Value-Based Wound Care and Clinical Outcomes
Bundled payment programs shift risk to providers, rewarding objective progress tracking that digital tools supply[2]Centers for Medicare & Medicaid Services, “Surgical Dressings & Wound Care Coding,” cms.gov. Platforms such as Tissue Analytics link wound geometry to healing curves and supply dashboards for contract compliance. In home-care trials, Solventum’s V.A.C. Peel and Place Dressing cut weekly nurse visits by 67% while sustaining efficacy, proving outcome-linked ROI that resonates with payers. Accurate measurement also reduces denied claims, curbing revenue leakage for hospitals that must document improvement under value-based rules. Consequently, economic pressure accelerates the uptake of digital wound measurement devices industry solutions that can verify healing milestones with auditable precision.
Increasing Adoption of Digital Health and Telemedicine Platforms
Post-pandemic telehealth penetration jumped from 11% to 85% of U.S. providers, embedding remote workflows that complement wound photography and AI analytics. Smartphone penetration above 80% across key APAC states lets clinicians supervise rural wounds in real time, closing distance gaps without facility build-out. Healthy.io’s partnership with Johns Hopkins provides remote expertise through cloud analysis, proving quality parity with bedside evaluation. The digital wound measurement devices market thus expands beyond hospital walls, and networked platforms create new value pools in preventive surveillance and population-scale triage.
Restraints Impact Analysis*
| Restraints Impact Analysis | (~) % Impact on CAGR Forecast | Geographic Relevance | Impact Timeline |
|---|---|---|---|
| High capital and operational costs of advanced devices | -0.6% | Global, more pronounced in emerging markets | Medium term (2-4 years) |
| Limited reimbursement coverage in emerging markets | -0.4% | APAC, Latin America, MEA | Long term (≥ 4 years) |
| Data privacy and cybersecurity concerns in cloud-based platforms | -0.5% | North America & EU, spreading globally | Short term (≤ 2 years) |
| Integration challenges with legacy electronic health systems | -0.3% | Global, especially mature hospital networks | Medium term (2-4 years) |
| Source: Mordor Intelligence | |||
High Capital and Operational Costs of Advanced Devices
Up-front price tags of USD 15,000-50,000 per system and the need for software licenses, calibration, and 20-40 hours of staff training lift total cost of ownership above many clinic budgets. Rural hospitals must spread fixed charges across thin case volumes, impeding break-even targets. While smartphone apps lower entry thresholds, they may forfeit volumetric precision prized for complex wounds, forcing providers to weigh financial relief against clinical depth. Leasing schemes and outcome-based pricing emerge, yet capital hurdles still slow digital wound measurement devices market diffusion in resource-constrained settings.
Limited Reimbursement Coverage in Emerging Markets
Outside the United States and Western Europe, specific billing codes for digital measurement remain scarce, compelling facilities to self-fund technology. Fragmented payer mixes complicate cost recovery, and public programs often prioritize essential services over advanced devices. Lack of claims data then delays evidence generation, producing a self-reinforcing adoption gap. Vendors must therefore bundle software into low-cost hardware or pursue subscription models that align payment with incremental value until broader reimbursement standards appear.
*Our forecasts treat driver/restraint impacts as directional, not additive. The impact forecasts reflect baseline growth, mix effects, and variable interactions.
Segment Analysis
By Product: Software Solutions Drive Innovation
Non-Contact 2-D camera devices secured 56.78% of the digital wound measurement devices market size in 2025 because hospitals already use them inside established documentation routines. Yet software-only platforms claim the fastest 7.12% CAGR as AI upgrades push smartphone optics toward clinical parity. Early adopters report workflow gains because clinicians capture, annotate, and upload images within common mobile operating systems, eliminating cable transfers. Recurring license fees convert episodic capital sales into predictable revenue, rewarding data-science investments that uplift accuracy over time. Vendors such as Swift Medical raised USD 8 million in 2024 to deepen algorithm libraries that fuel this shift. Hardware makers respond by opening application-programming interfaces so their cameras feed these thriving ecosystems, confirming that future digital wound measurement devices market growth hinges on analytics more than optics.
Contact scanners keep niche relevance when tactile feedback informs debridement, and premium 3-D units capture volumetric change essential for deep ulcers. Yet their share may erode as mobile AI captures depth through structured-light processing at lower cost. Clinics hedge by pairing budget phones with cloud licenses, achieving entry-level precision now and upgrading optics later, thus preserving capital flexibility. As a result, software command grows while hardware commoditizes, cementing the digital wound measurement devices market evolution toward platform economics.


By Technology: 3-D Stereophotogrammetry Gains Momentum
2-D planimetry dominated 48.05% of the digital wound measurement devices market share in 2025 thanks to its simple learning curve and quick capture times. However, 3-D stereophotogrammetry is scaling at a 7.38% CAGR because volume reduction correlates more tightly with healing than surface area alone. Surgeons treating cavity wounds prefer depth maps that confirm granulation across hidden pockets. Hyperspectral imaging further enriches decision-making by flagging perfusion deficits earlier than color change appears, enabling pre-emptive interventions that avert infection. Although fluorescence and thermal modalities remain niche, cross-modal devices will likely converge, giving clinicians a single toolset covering morphology and physiology.
Cost remains the main drag on 3-D adoption, yet leasing models and cloud-based processing ease budget shocks by swapping capital expense for service fees. Hospitals piloting stereo cameras show double-digit improvements in wound-closure prediction accuracy, a metric that feeds bundled-payment scorecards. Vendors thus spotlight outcome metrics rather than pixel counts when selling capability upgrades, and payers listen because validated precision drives down length of stay. Continuous gains in silicon efficiency will cut acquisition prices within the planning horizon, positioning 3-D stereophotogrammetry as the backbone of the digital wound measurement devices industry pipeline.
By Wound Type: Acute Wounds Accelerate Growth
Chronic indications still anchor 38.02% of digital wound measurement devices market applications in 2025, reflecting diabetic foot, venous leg, and pressure ulcers that demand months of oversight. Yet acute wounds register an 8.42% CAGR as elective surgeries rebound and trauma centers seek faster triage tools. Surgical teams integrate cameras in sterile drapes so depth and perimeter data upload instantly to electronic records, trimming manual charting that once ate into procedure slots. In burn units, 3-D volume calculations guide graft sizing, cutting donor-site morbidity. Trauma programs pair imaging with telemedicine, letting specialists advise rural staff in golden-hour windows. Taken together, the fresh procedure surge reinforces adequate throughput for device amortization, widening the digital wound measurement devices market.
Chronic-wound programs nonetheless remain profitable, thanks to long episode length that multiplies measurement frequency, reinforcing subscription revenue for cloud analytics. Value-based reimbursement penalizes stalled ulcers, so providers lean on objective data to justify antibiotic changes or advanced dressings. Therefore, suppliers must serve both acute and chronic pathways, tailoring imaging kits and pricing tiers without fragmenting user experience. Balanced portfolios will capture enduring volume as the wound spectrum shifts with demographic and surgical trends.
By End User: Home Healthcare Settings Transform Care
Hospitals owned 63.95% of the digital wound measurement devices market size in 2025 given their capital depth and specialist staff. They rely on bedside carts that integrate high-resolution optics with point-of-care documentation, satisfying accreditation audits. Yet home healthcare is rising at an 8.22% CAGR as payers push care to lower-cost venues. Mobile apps guide family caregivers through structured image capture, while cloud AI confirms quality and routes alerts to nurses within minutes. Case managers report 67% fewer readmissions when remote measurement flags deterioration before it warrants emergency visits. Consequently, device makers redesign interfaces for intuitive prompts, bright icons, and offline caching that safeguards data during weak connectivity.
Specialty wound centers act as innovation sandboxes, piloting next-generation modalities and benchmarking outcomes that later influence purchasing committees. Out-patient clinics adapt these lessons to high-throughput environments, where speed and interoperability trump exotic features. Over time, home-care volumes will create data pools dwarfing inpatient repositories, giving vendors the scale to refine AI. Providers that master the continuum from ward to living room will secure durable competitive footing in the digital wound measurement devices industry.
By Healthcare Setting: Home-Based Care Drives Innovation
In-patient wards controlled 54.62% market share during 2025, reflecting complexity and reimbursement certainty for high-acuity wounds. Nevertheless, home-based care charts an 8.05% CAGR because aged patients prefer aging-in-place and insurers reward site-of-service shifts. Ambulatory clinics balance load between scheduled checks and unexpected flare-ups, aided by portable scanners that dock into tablets. Cloud dashboards allow wound specialists to monitor dozens of patients simultaneously, flagging only those whose healing deviates from algorithmic norms. As remote oversight matures, hospital systems integrate imaging feeds into enterprise electronic records, enabling longitudinal analytics that tie wound evolution to comorbidities and social determinants. This connective tissue cements the digital wound measurement devices market as a cornerstone of decentralized chronic-care models.
Military and disaster-response teams also adopt ruggedized handhelds such as Spectral AI DeepView SnapShot M, aiming for field triage where bandwidth is scarce and sterility compromised. Such overlap with civilian home-care needs accelerates product hardening against drops, moisture, and variable light. Lessons from extreme environments return to mainstream devices, enhancing reliability for everyday domestic use. The convergence of consumer ergonomics and clinical rigor sets a high bar that elevates the entire digital wound measurement devices market.
Geography Analysis
North America captured 39.78% of the digital wound measurement devices market in 2025, supported by Medicare billing codes 97597-97602 that offset acquisition and operating expense. U.S. hospitals face a USD 96 billion wound-care burden and deploy AI imaging to compress lengths of stay and avoid penalties tied to readmission metrics. Canadian health systems integrate imaging into province-wide electronic charts, while Mexico’s expanding device imports fuel regional supplier pipelines. Regulatory clarity through FDA 510(k) and clinical trial infrastructure attract sustained venture funding, exemplified by MolecuLight’s USD 27.5 million Series D in 2025. Such capital density perpetuates innovation cycles that reinforce North American dominance within the digital wound measurement devices market.
Asia-Pacific presents the fastest 6.31% CAGR, driven by state-sponsored telehealth strategies and smartphone saturation beyond 80% in large economies. China and India scale community-health initiatives that embed wound imaging inside primary-care apps, converting vast diabetic populations into data sources that refine AI. Japan and South Korea, coping with aging demographics, adopt advanced 3-D spectroscopy to limit long-term nursing stays. Regional procurement favors low-capex tools, so vendors localize pricing and cloud hosting to meet data-sovereignty rules. Collective momentum signals that APAC will steadily erode Western share through 2031, transforming the global digital wound measurement devices market.
Europe sustains measured growth under coordinated health technology assessments that demand robust outcome evidence before procurement. Germany and the United Kingdom lead uptake by linking imaging outputs to bundled payments for diabetic-foot pathways. France and Italy follow as EU digital-health funding windows open. GDPR compliance forces manufacturers to embed encryption and anonymization by design, raising entry barriers that favor vendors with mature data-governance frameworks. Consortia studying cross-border wound registries further boost data granularity, supporting pan-European best-practice guidelines and sustaining purchasing confidence in the digital wound measurement devices industry.


Competitive Landscape
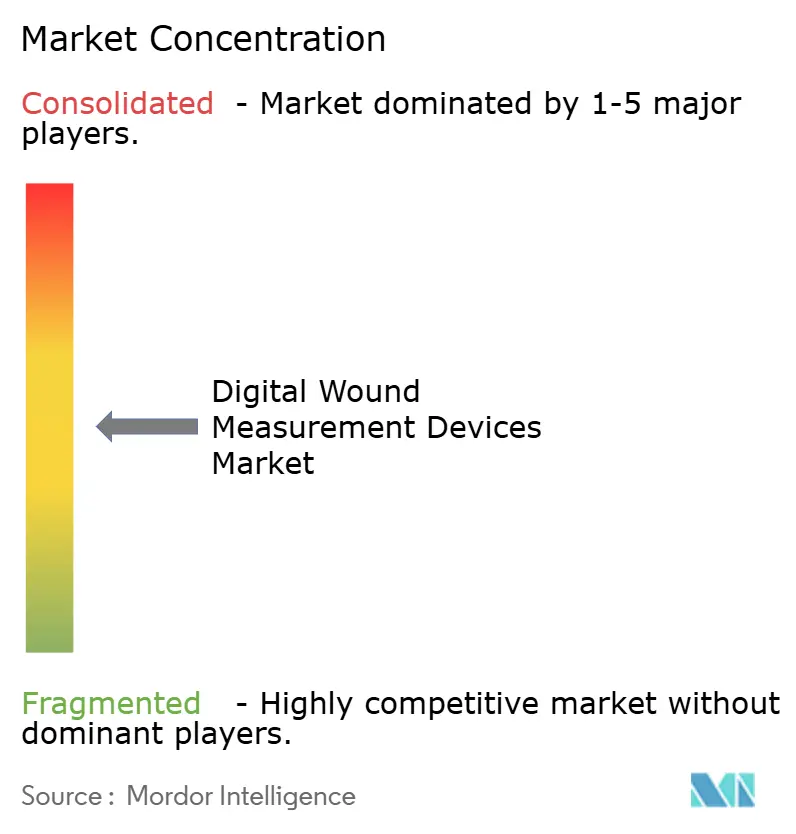
The market remains moderately fragmented, with no single supplier controlling more than a mid-teen share. Solventum, newly spun from 3M, leverages USD 8.2 billion healthcare revenue to bundle dressings, negative-pressure kits, and imaging analytics under unified contracts. MolecuLight channels its Series D capital into manufacturing and regulatory filings across Asia and Latin America, betting that fluorescence precision will command premium pricing despite regional cost sensitivity. Swift Medical positions its software as hardware-agnostic, pursuing platform partnerships with camera makers to widen reach without inventory risk. eKare targets the bring-your-own-device wave by embedding FDA-cleared algorithms inside consumer smartphones, appealing to home-care agencies that lack large IT budgets.
Acquisition appetite intensifies as conglomerates chase integrated portfolios. Stryker’s USD 4.9 billion purchase of Inari Medical diversifies into peripheral vascular care that shares patient overlap with chronic wounds. The follow-on acquisition of care.ai brings ambient intelligence, linking wound imaging with vital-sign sensors to create holistic ward dashboards. Startups attract strategic alliances, exemplified by Kent Imaging’s Series B ambitions to finance product extensions into tissue oxygenation screens for operating theaters. Price competition persists among baseline 2-D devices, yet vendors differentiate through software modules that unlock analytics subscriptions and predictive alerts, a trend likely to reshape the digital wound measurement devices market over the next five years.
Digital Wound Measurement Devices Industry Leaders
MolecuLight Inc.
Wound Matrix Inc
Kent Imaging Inc.
ARANZ Medical Limited
WoundVision LLC
- *Disclaimer: Major Players sorted in no particular order

Recent Industry Developments
- January 2025: MolecuLight closed a USD 27.5 million Series D round to scale fluorescence imaging production and global sales efforts.
- February 2025: Stryker completed the USD 4.9 billion acquisition of Inari Medical, expanding into peripheral vascular thrombectomy solutions that complement wound-care offerings.
- September 2024: Solventum launched the V.A.C. Peel and Place Dressing, cutting therapy setup time by 61% and bedside costs by 41%.
- August 2024: Stryker signed a definitive agreement to acquire care.ai, adding virtual-care and ambient-intelligence capability to connected device portfolios.
- August 2024: MolecuLight secured USD 11.7 million in additional financing to accelerate commercialization of fluorescence imaging for wound assessment.
- April 2024: Solventum finalized its spinoff from 3M, emerging as an independent NYSE-listed healthcare company under the ticker SOLV.


Global Digital Wound Measurement Devices Market Report Scope
As per the scope of the report, Digital wound measurement devices are primarily used to conduct wound measuring accurately. With the integration of electronic medical record (EMR) software, the devices are utilized to measure a wound three-dimensionally.
The digital wound measurement devices market is segmented by product, wound type, end user, and geography. By product, the market is segmented into contact wound measuring device and non-contact wound measuring device. By wound type, the market is segmented into chronic wounds and acute wounds. By chronic wounds, the market is segmented into pressure ulcers, diabetic foot ulcer, and others. By acute wounds, the market is segmented into burns and trauma and surgical wounds. By end user, the market is segmented into hospitals, clinics, and others. By geography, the market is segmented into North America, Europe, Asia-Pacific, and the rest of the World. The report offers the value in USD for the above segments.
| Contact Digital Measuring Devices |
| Non-Contact 2-D Camera-Based Devices |
| 3-D Imaging / Scanner Devices |
| AI-Enabled Software-Only Solutions |
| 2-D Digital Planimetry |
| 3-D Stereophotogrammetry |
| Fluorescence / Hyperspectral Imaging |
| Thermal & Multimodal Imaging |
| Chronic Wounds | Pressure Ulcers |
| Diabetic Foot Ulcers | |
| Venous Leg Ulcers | |
| Other Chronic Wounds | |
| Acute Wounds | Surgical Wounds |
| Burns & Trauma |
| Hospitals |
| Specialty Wound-Care Centers |
| Out-Patient Clinics |
| Home Healthcare Settings |
| In-Patient |
| Out-Patient / Ambulatory |
| Home-Based |
| North America | United States |
| Canada | |
| Mexico | |
| Europe | Germany |
| United Kingdom | |
| France | |
| Italy | |
| Spain | |
| Rest of Europe | |
| Asia-Pacific | China |
| Japan | |
| India | |
| Australia | |
| South Korea | |
| Rest of Asia-Pacific | |
| Middle East & Africa | GCC |
| South Africa | |
| Rest of Middle East & Africa | |
| South America | Brazil |
| Argentina | |
| Rest of South America |
| By Product | Contact Digital Measuring Devices | |
| Non-Contact 2-D Camera-Based Devices | ||
| 3-D Imaging / Scanner Devices | ||
| AI-Enabled Software-Only Solutions | ||
| By Technology | 2-D Digital Planimetry | |
| 3-D Stereophotogrammetry | ||
| Fluorescence / Hyperspectral Imaging | ||
| Thermal & Multimodal Imaging | ||
| By Wound Type | Chronic Wounds | Pressure Ulcers |
| Diabetic Foot Ulcers | ||
| Venous Leg Ulcers | ||
| Other Chronic Wounds | ||
| Acute Wounds | Surgical Wounds | |
| Burns & Trauma | ||
| By End User | Hospitals | |
| Specialty Wound-Care Centers | ||
| Out-Patient Clinics | ||
| Home Healthcare Settings | ||
| By Healthcare Setting | In-Patient | |
| Out-Patient / Ambulatory | ||
| Home-Based | ||
| Geography | North America | United States |
| Canada | ||
| Mexico | ||
| Europe | Germany | |
| United Kingdom | ||
| France | ||
| Italy | ||
| Spain | ||
| Rest of Europe | ||
| Asia-Pacific | China | |
| Japan | ||
| India | ||
| Australia | ||
| South Korea | ||
| Rest of Asia-Pacific | ||
| Middle East & Africa | GCC | |
| South Africa | ||
| Rest of Middle East & Africa | ||
| South America | Brazil | |
| Argentina | ||
| Rest of South America | ||


Key Questions Answered in the Report
What is the current value of the digital wound measurement devices market?
The digital wound measurement devices market size is USD 335.36 million in 2026 and is projected to reach USD 431.67 million by 2031.
Which product segment is growing the fastest?
AI-enabled software-only platforms are the fastest, advancing at a 7.12% CAGR due to smartphone integration and recurring license economics.
Why are home-healthcare settings important for future growth?
Home care records an 8.22% CAGR because remote imaging reduces readmissions by 67% and aligns with payer incentives for lower-cost sites of service.
Which region offers the highest growth potential?
Asia-Pacific shows the strongest 6.31% CAGR, driven by government telehealth programs and high smartphone penetration that support mobile wound imaging.
How do AI and hyperspectral imaging improve outcomes?
They quantify bacterial load and tissue oxygenation, allowing clinicians to tailor therapy sooner and shorten healing time by up to 50%.
What are the key challenges to broader adoption?
High capital costs and limited reimbursement in emerging markets restrict uptake, while cybersecurity and data-integration issues demand ongoing vendor investment.
Page last updated on:


