Digital Therapeutics Market Size and Share
Market Overview
| Study Period | 2020 - 2031 |
|---|---|
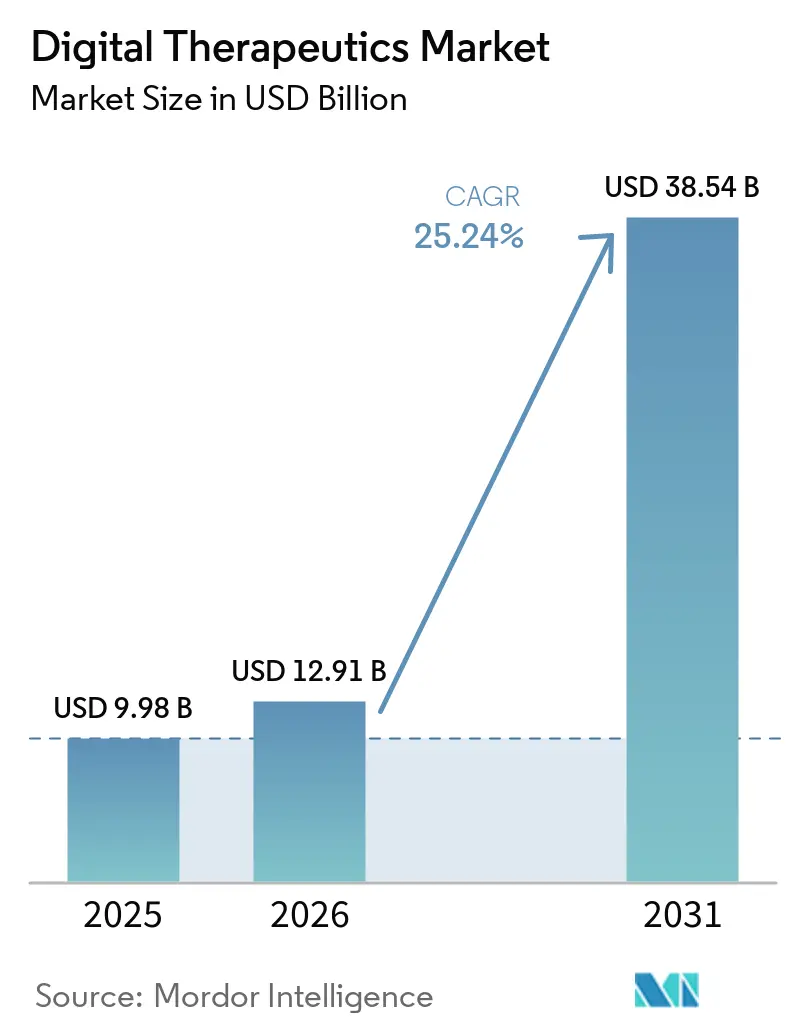
| Market Size (2026) | USD 12.91 Billion |
| Market Size (2031) | USD 38.54 Billion |
| Growth Rate (2026 - 2031) | 25.24% CAGR |
| Fastest Growing Market | Asia-Pacific |
| Largest Market | North America |
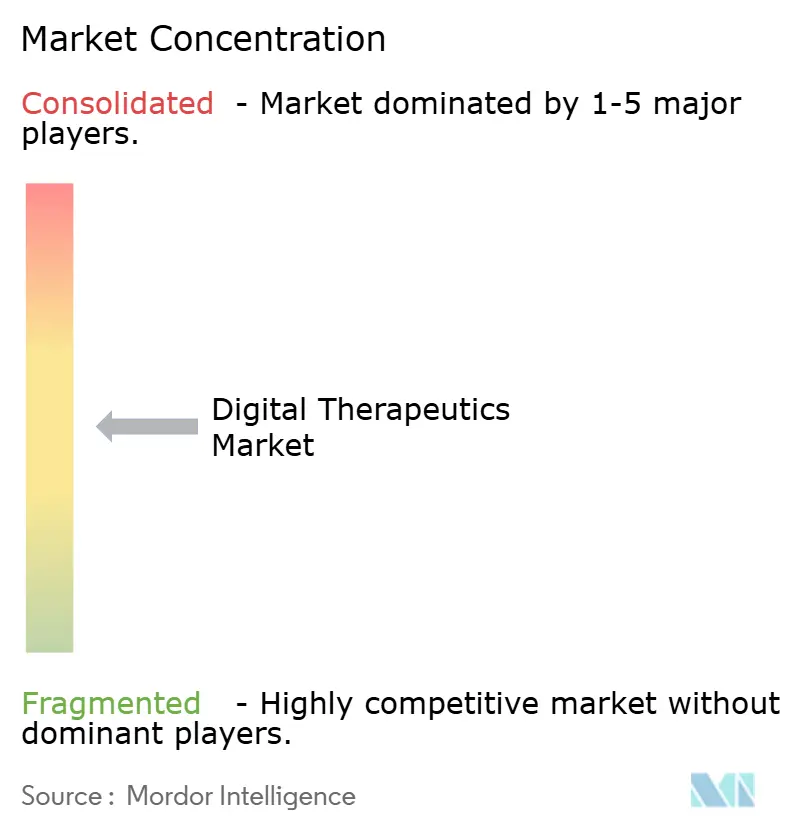
| Market Concentration | Medium |
Major Players *Disclaimer: Major Players sorted in no particular order Image © Mordor Intelligence. Reuse requires attribution under CC BY 4.0. | |
Digital Therapeutics Market Analysis by Mordor Intelligence
The Digital Therapeutics Market size is projected to be USD 9.98 billion in 2025, USD 12.91 billion in 2026, and reach USD 38.54 billion by 2031, growing at a CAGR of 25.24% from 2026 to 2031.
Digital therapeutics are transitioning from pilot programs to widespread commercial use, bolstered by pathways like Software as a Medical Device, heightened interest from payers, and increased adoption by employers. Clinical validation has gained prominence, with randomized trial evidence now pivotal in reimbursement talks. This shift amplifies the competitive edge of clinically validated platforms over unproven wellness apps. The market is expanding its reach, addressing areas like diabetes, obesity, mental health, and chronic disease management. Here, buyers prioritize measurable outcomes over mere app access. Revenue models are evolving; health systems and payers now favor managed programs that integrate software, care support, and reporting, moving away from traditional one-time software licensing.
Key Report Takeaways
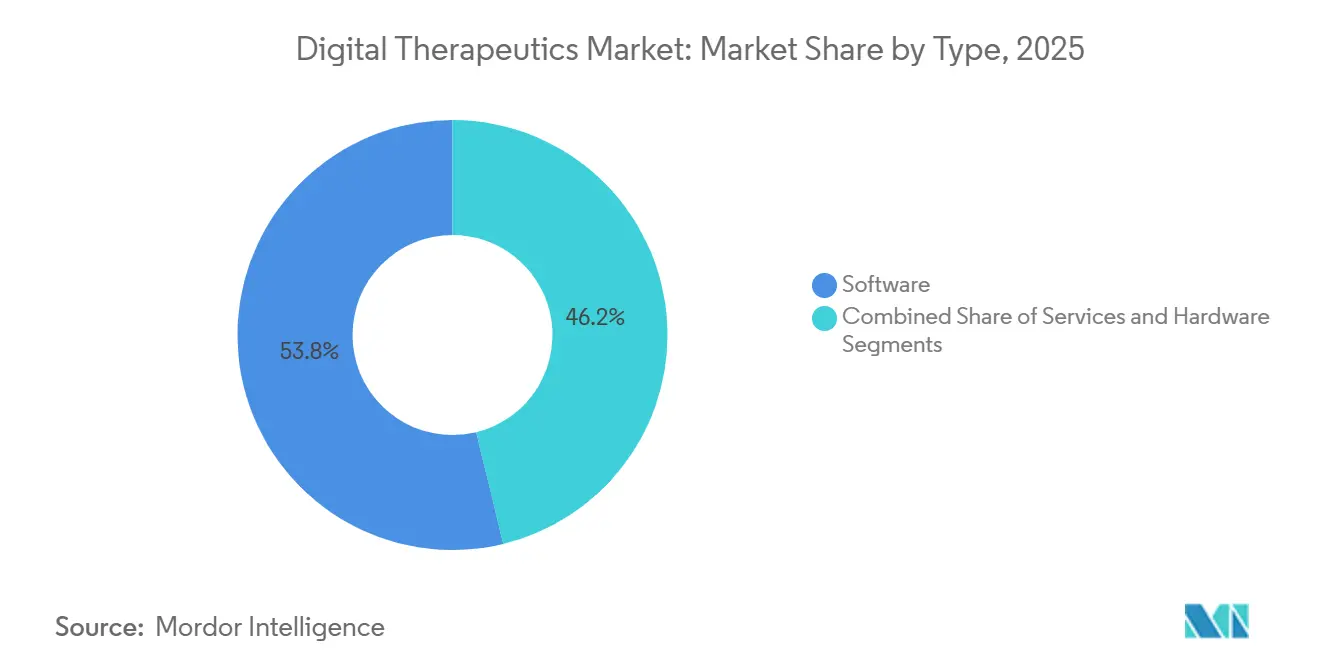
- By type, software held 53.78% of the digital therapeutics market share in 2025, while services are forecasted to grow at a 27.10% CAGR through 2031.
- By application, prevention accounted for 42.25% of the digital therapeutics market size in 2025, while management is expected to advance at a 28.56% CAGR through 2031.
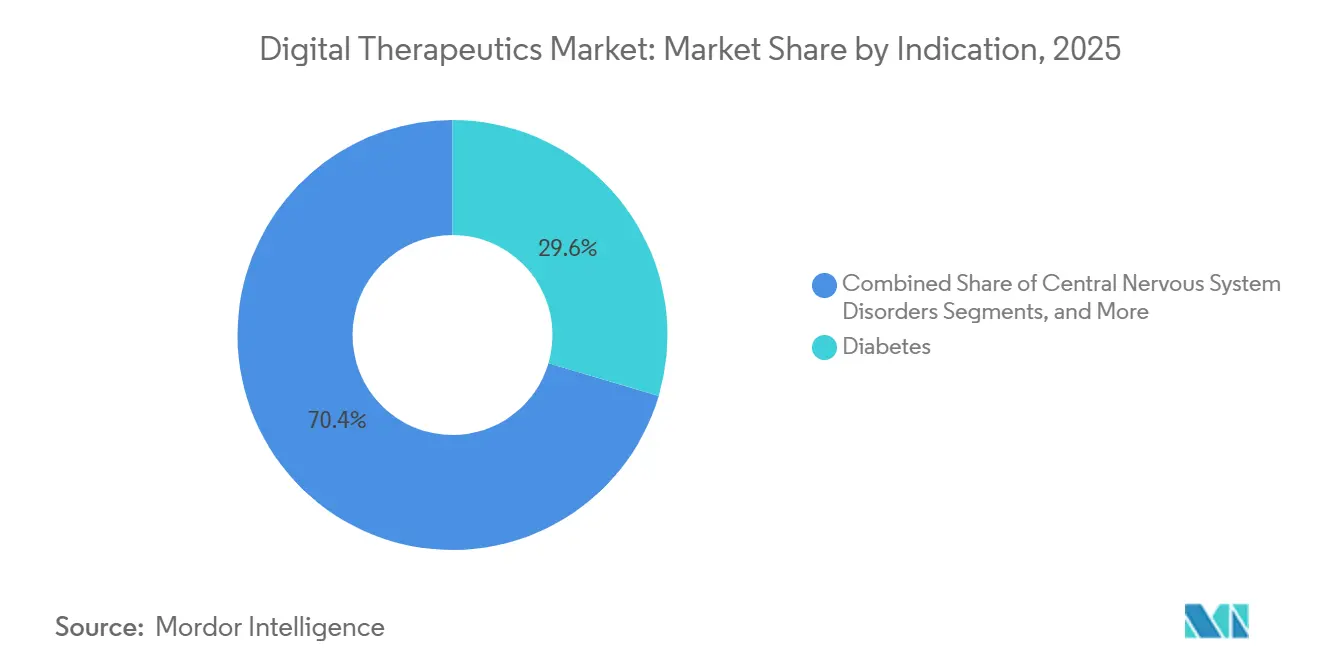
- By indication, diabetes held 29.55% of the global digital therapeutics market in 2025, while CNS disorders are projected to expand at a 28.76% CAGR through 2031.
- By business model, direct-to-consumer held 60.34% of the global digital therapeutics market in 2025, while fee-for-service is projected to rise at a 29.15% CAGR through 2031.
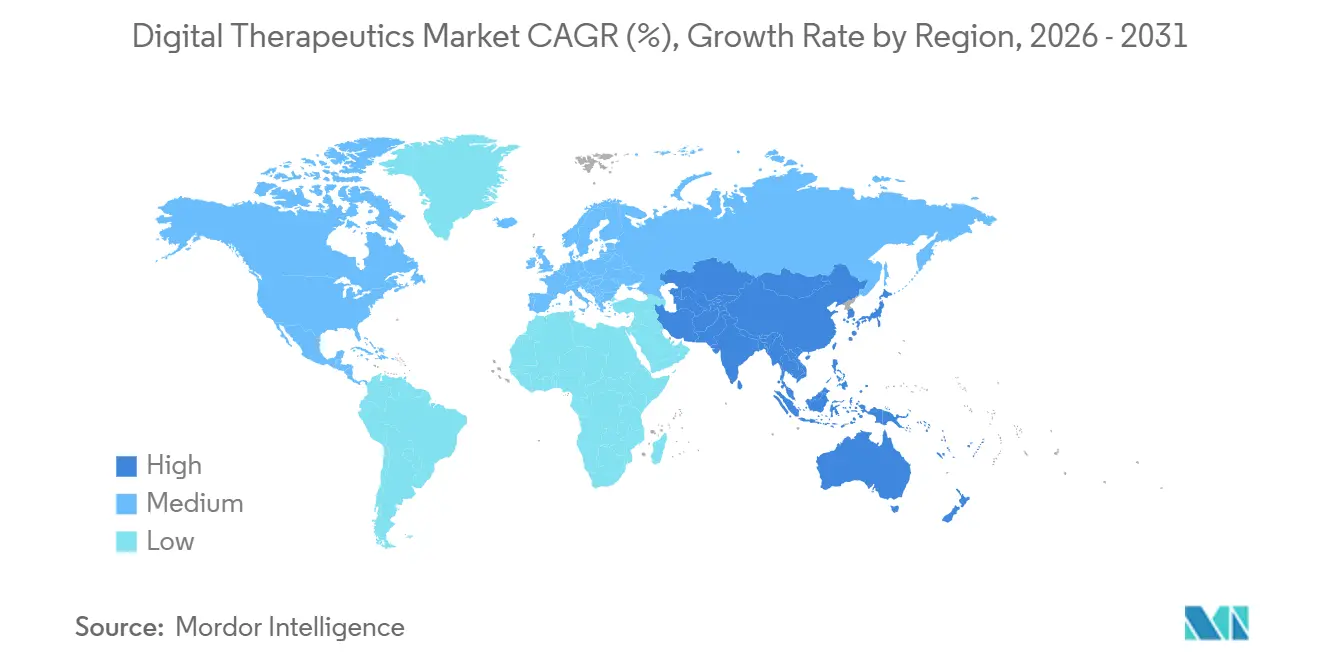
- By geography, North America represented 41.25% of the digital therapeutics market size in 2025, while Asia-Pacific is expected to grow at a 27.60% CAGR through 2031.
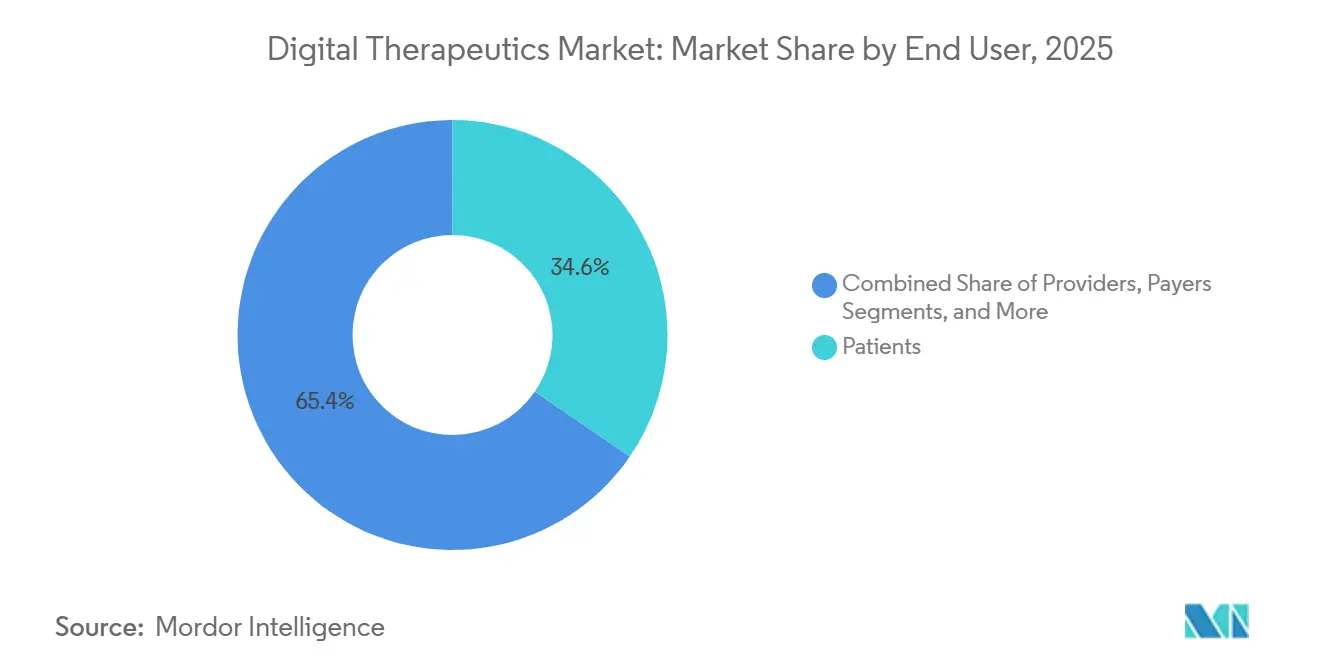
- By end user, patients held 34.55% of the digital therapeutics market in 2025, while providers are projected to grow at a 27.44% CAGR through 2031.
Note: Market size and forecast figures in this report are generated using Mordor Intelligence’s proprietary estimation framework, updated with the latest available data and insights as of January 2026.
Global Digital Therapeutics Market Trends and Insights
Drivers Impact Analysis*
| DRIVER | (~) % IMPACT ON CAGR FORECAST | GEOGRAPHIC RELEVANCE | IMPACT TIMELINE |
|---|---|---|---|
| Rising chronic disease burden and demand for scalable software-based interventions | +3.8% | Global, with highest density in North America and APAC | Long term (≥ 4 years) |
| Accelerating payer adoption of value-based care contracts for DTx | +3.2% | North America and EU core, with spillover to APAC | Medium term (2-4 years) |
| Prescription digital therapeutics integration into clinical workflow and drug therapy adjunct programs | +2.9% | North America and EU, including Germany DiGA pathway | Medium term (2-4 years) |
| AI-enabled personalization and adaptive coaching improving clinical outcomes | +3.5% | Global | Long term (≥ 4 years) |
| Greater employer demand for measurable ROI from digital health benefits | +2.1% | North America, with expansion into Europe | Short term (≤ 2 years) |
| Regulatory normalization of SaMD, PDURS, and digital mental health device frameworks | +2.6% | North America, Europe, and APAC | Medium term (2-4 years) |
| Source: Mordor Intelligence | |||
Rising Chronic Disease Burden Demands Scalable Intervention Platforms
The digital therapeutics market is growing rapidly due to the increasing prevalence of chronic diseases, which demand scalable care models beyond traditional in-person support. Diabetes remains a key focus area because of its significant care burden, measurable outcomes, and the ability for payers to link digital interventions with medication adherence, glycated hemoglobin levels, and hospitalization risks. Cleveland Clinic's findings on the Twin Precision Treatment platform demonstrated its potential in reducing medication use for type 2 diabetes, strengthening the case for software-driven cardiometabolic care. This approach is now extending to obesity, hypertension, and cardiovascular risk management, where digital programs are integrated with drug therapies and coaching to enhance adherence and care continuity.
AI-Enabled Personalization Raises the Clinical Performance Bar
Personalization is becoming a critical factor in the digital therapeutics market as static content fails to engage diverse patient profiles or improve outcomes effectively. A 2025 trial highlighted the success of Lumen, an AI-driven voice coach, in delivering problem-solving therapy with results comparable to human coaching.[1]Personalized Game-Based Digital Intervention for Relieving Depression and Anxiety Symptoms, A Pilot RCT,” npj Mental Health Research, nature.com Another study emphasized the benefits of reinforcement learning in personalizing interventions for depression and anxiety, showing significant improvements over non-personalized approaches. Buyers are increasingly prioritizing AI-driven solutions that enhance clinical responses and reduce care costs. Vendors offering patient-specific adaptations are better positioned in coverage discussions, particularly in mental health and chronic disease programs, where dropout rates remain a challenge. This trend is raising the performance standards across the market.
Regulatory Normalization of SaMD Creates Institutional Access Pathways
Regulatory developments are providing a stronger commercial foundation for the digital therapeutics market. The FDA's Digital Health Center of Excellence, in collaboration with CMS and CMMI, launched the TEMPO Pilot in January 2026, linking digital device access with patient outcome measurement. In the U.S., the Access to Prescription Digital Therapeutics Act of 2025 aims to establish a dedicated Medicare Part B benefit for prescription digital therapeutics, reducing reliance on inconsistent pricing. Germany's DiGA pathway reported 695,000 activated prescriptions in 2025, with cumulative reimbursement costs reaching EUR 400 million (USD 432 million). From 2026, Germany will require at least 20% of DiGA reimbursement pricing to be tied to measurable outcomes, raising evidence standards and emphasizing real-world reporting.[2]GKV-Spitzenverband, “DiGA Report 2025,” cited in DUX Healthcare, dux-healthcare.com Similar frameworks in Japan, Australia, and South Korea are further stabilizing institutional pathways for digital therapeutics.
Accelerating Payer Adoption Through Outcome-Linked Contracting
Payers are increasingly adopting digital therapeutics as evidence of cost savings drives selective contracting. A study showed that SleepioRx, a digital CBT platform for insomnia, reduced first-year total healthcare costs by USD 2,083 per patient, with pharmacy spending decreasing by 46%. Another 2026 study highlighted cost reductions and improved efficiency in employer-sponsored behavioral health programs through digitally enabled access.[3] A. Nwosu et al., “Policy and Reimbursement Strategies to Improve Patient Access to Prescription Digital Therapeutics,” npj Digital Medicine, nature.com Fee-for-service models are growing rapidly as institutional buyers prefer contracts tied to measurable usage and outcomes. While coverage remains selective, payers are more willing to support programs for high-cost chronic conditions when aligned with existing administrative systems. This shift is moving the market closer to value-based care structures.
Restraints Impact Analysis*
| RESTRAINT | (~) % IMPACT ON CAGR FORECAST | GEOGRAPHIC RELEVANCE | IMPACT TIMELINE |
|---|---|---|---|
| Uneven reimbursement coverage and absence of standardized national pricing for digital therapeutics | -2.8% | North America, with Europe also affected by fragmented country-level frameworks | Medium term (2-4 years) |
| High clinical evidence generation cost creating barriers for smaller developers | -1.6% | Global, most acute in North America and Europe | Long term (≥ 4 years) |
| Low patient persistence and engagement drop-off eroding real-world effectiveness | -2.1% | Global | Long term (≥ 4 years) |
| Integration friction with EHR, claims systems, and practice management platforms | -1.4% | North America and Europe | Medium term (2-4 years) |
| Source: Mordor Intelligence | |||
Reimbursement Fragmentation Constrains Scalable Commercial Models
The digital therapeutics market faces limited commercial access due to fragmented reimbursement frameworks across payers, countries, and care settings. In the U.S., the 2025 Physician Fee Schedule introduced G-codes for digital mental health devices, but the absence of national pricing leaves access reliant on contractor-level pricing and local billing processes. Reimbursement strategies for prescription digital therapeutics vary widely, with policy design playing a critical role in patient access, provider adoption, and commercial scalability. This creates a divide between companies capable of managing extended coverage timelines and those restricted to employer-direct or cash-pay models.
Engagement Attrition Undermines Real-World Evidence Generation
Patient drop-offs remain a significant issue in the digital therapeutics market, as lower completion rates weaken clinical impact and the evidence base required for broader coverage. The average completion rate for digital depression interventions is 44.2%, ranging from 1.8% to 94%, highlighting the importance of design quality, patient fit, and onboarding experience. Real-world persistence in musculoskeletal digital therapeutics also remains low despite proven efficacy, necessitating coordinated efforts from patients, clinicians, developers, and health systems to sustain usage.
*Our forecasts treat driver/restraint impacts as directional, not additive. The impact forecasts reflect baseline growth, mix effects, and variable interactions.
Segment Analysis
By Type: Software Anchors Revenue, But Services Redraw the Growth Map
In 2025, software solutions held 53.78% of the digital therapeutics market, driven by app-based therapy models that bypass the need for specialized hardware. This segment thrived due to rapid distribution, seamless updates, and reduced delivery costs, establishing it as the commercial backbone for early and mid-stage players. Hardware remained the smallest segment, primarily serving a supportive role integrated with sensors, wearables, or other connected devices. Software's centrality in the digital therapeutics market was reinforced, especially in scenarios where mobile interfaces sufficed for clinical pathways without requiring remote monitoring.
Services are projected to grow at a 27.10% CAGR from 2026 to 2031, reflecting a shift in buyer preferences toward managed care layers around software. Health systems, payers, and employers increasingly value care navigation, coaching, reporting, and implementation support to enhance activation, continuity, and accountability. This shift is driving the market toward ongoing program delivery rather than one-time licensing or app subscriptions. Software remains the core therapeutic engine, while services emerge as the commercial layer translating adoption into measurable outcomes.


By Application: Prevention Dominates, Management Captures the Growth Premium
Prevention accounted for 42.25% of the digital therapeutics market in 2025, supported by strong adoption in diabetes prevention, smoking cessation, and weight management. These areas had established a solid commercial foundation due to employer and health plan funding for preventive measures with familiar behavior-change models. Prevention's lower clinical complexity compared to prescription treatments enabled broader deployment across large member pools, making it the largest application segment in 2025. However, growth is now shifting toward active disease management.
Management is expected to grow at a 28.56% CAGR through 2031, driven by rising demand for programs demonstrating cost-offset benefits in cardiometabolic care and chronic conditions. Omada Health reported Q1 2026 revenue of USD 78 million, a 42% year-over-year increase, with total members exceeding 1.02 million, showcasing the scalability of management-focused platforms. Treatment remains the smallest segment due to stricter authorization and evidence requirements, but the revenue mix is increasingly favoring management as payers prioritize cost-control programs over general wellness initiatives.
By Indication: Diabetes Holds Share, CNS Disorders Command Growth
Diabetes held 29.55% of the indication-level digital therapeutics market in 2025, solidifying its position as the primary entry point for software-driven therapeutic care. Diabetes programs benefit from measurable outcomes like glycated hemoglobin levels and hospitalization risks, facilitating payer contracts and employer purchases. The adoption of GLP-1 therapies further strengthens this position, with digital coaching and adherence support complementing cardiometabolic treatment pathways. Diabetes remains the foundational indication, offering scalability and an evidence framework extendable to adjacent conditions.
CNS disorders are forecast to grow at a 28.76% CAGR through 2031, driven by advancements in ADHD, depression, schizophrenia, and related mental health areas. Lumos Labs' 510(k) clearance for LumosityRx in December 2025 as a prescription digital therapeutic for adult ADHD highlights the competitive momentum in this space. Click Therapeutics and Boehringer Ingelheim's USD 50 million Series D investment in April 2026 aims to commercialize CT-155 for schizophrenia’s experiential negative symptoms, showcasing the strengthening of pharma partnerships in CNS-focused digital therapeutics.
By Business Model: DTC Dominates but Fee-for-Service Signals Structural Shift
In 2025, the direct-to-consumer model captured 60.34% of the digital therapeutics market, reflecting the widespread adoption of app-based distribution and employer-sponsored wellness initiatives. This model enabled quick user access and allowed vendors to scale without relying on comprehensive clinical reimbursement. It aligned with the market's early dynamics, where products gained traction through direct engagement, cash payments, or employer benefits. While DTC led in 2025, the market is now shifting toward more accountable payment frameworks.
Fee-for-service is projected to grow at a 29.15% CAGR through 2031, signaling a shift toward contracts tied to utilization and outcomes. Institutional buyers are prioritizing accountability in activation, adherence, and clinical usage, making fee-for-service contracts more appealing than traditional subscription models. The business-to-business segment remains significant, particularly where vendors collaborate with employers, health systems, or health plans to offer white-labeled or tailored care solutions.
By End User: Patients Lead Volume, Providers Drive Fastest Adoption
In 2025, patients accounted for 34.55% of the end-user mix, highlighting the pivotal role of consumer-centric delivery in the digital therapeutics market. Direct access, mobile distribution, and minimal entry barriers positioned patients at the forefront of adoption, particularly for programs not requiring formal prescriptions or intensive provider oversight. Meanwhile, provider-led utilization is gaining importance, driven by clearer billing codes, clinical pathways, and integration into standard care. Patients remained the largest end-user segment in 2025, while providers are expected to play a more prominent role during the forecast period.
Providers are projected to grow at a 27.44% CAGR from 2026 to 2031, supported by clearer reimbursement pathways and a shift toward clinician-prescribed digital solutions. A 2025 study highlighted that while physicians still view digital therapeutics as complementary tools, their integration into multimodal care and guideline-linked practices is increasing with clearer reimbursement avenues. Payers and employers are also becoming significant end users, focusing on measurable outcomes, contract structures, and medical cost impacts.
Geography Analysis
In 2025, North America accounted for 41.25% of the global digital therapeutics market, making it the largest regional contributor by revenue and the most commercially advanced market. This leadership stemmed from the FDA's regulatory framework, a strong employer self-insurance base, active venture-backed developments, and institutional readiness for software-driven care models. The 2025 Physician Fee Schedule introduced reimbursement codes for digital mental health treatment devices, creating a formal billing mechanism despite pending national pricing.
Europe remained the second-largest regional market, with Germany leading due to its DiGA model, the most structured national reimbursement pathway for digital therapeutics. In 2025, the DiGA program recorded 695,000 activated prescriptions, costing EUR 171 million (USD 184 million), reflecting 64% year-over-year growth. From January 2026, Germany required at least 20% of DiGA reimbursement pricing to be tied to measured outcomes, favoring platforms with robust real-world data systems. Other European countries, including the UK, France, Italy, and Spain, are progressing gradually, while partnerships like GAIA and Daiichi Sankyo Europe demonstrate the use of the German pathway for broader commercialization.
The Asia-Pacific region is the fastest-growing digital therapeutics market, with a projected CAGR of 27.60% from 2026 to 2031. Growth is driven by rising chronic disease prevalence, expanding digital health infrastructure, and formal software-as-medical-device pathways in Japan, South Korea, and Australia. By 2025, South Korea approved 14 digital therapeutics products, including the insomnia treatment Somzz, showcasing regulatory progress. Japan's PMDA framework and Australia's TGA pathway are advancing structured approval and reimbursement processes, particularly in mental health and diabetes care.

Competitive Landscape
At the global level, the digital therapeutics market is moderately concentrated. However, competition intensifies within specific clusters, notably in cardiometabolic care, CNS conditions, and musculoskeletal support. No single vendor dominates the landscape. Instead, competitive strength hinges on factors like evidence quality, reimbursement alignment, regulatory preparedness, and seamless integration with payer or provider workflows. Between 2025 and 2026, consolidation picked up pace.
There remain untapped opportunities in areas like gastrointestinal and respiratory disorders, as well as multi-morbidity care. While evidence is accumulating in these domains, no vendor has yet established a dominant foothold. In ADHD and cognitive care, LumosityRx’s FDA clearance in December 2025 marked its entry into a space where success increasingly hinges on clinical validation over brand recognition. AI-driven personalization is becoming a standard expectation, as RCT evidence increasingly supports adaptive interventions over generic ones. Omada Health’s February 2026 launch of 'Omada for Cholesterol' demonstrated a strategic shift, focusing on horizontal expansion across cardiometabolic conditions instead of limiting itself to a single ailment.
Collaborations between pharmaceutical companies and digital therapeutic developers are gaining momentum, connecting clinical evidence, commercialization efforts, and targeted patient populations. A notable example is the USD 50 million partnership between Click Therapeutics and Boehringer Ingelheim for CT-155 in schizophrenia care. Regulatory compliance remains a critical competitive advantage, as vendors with established FDA SaMD and European regulatory capabilities can introduce new indications faster and with lower execution risks.
Digital Therapeutics Industry Leaders
Omada Health, Inc.
Teladoc Health, Inc.
Noom, Inc.
Click Therapeutics, Inc.
Kaia Health Software GmbH
- *Disclaimer: Major Players sorted in no particular order

Recent Industry Developments
- June 2026: Hims & Hers Health finalized its acquisition of Eucalyptus, expanding its digital health presence across the US, UK, Australia, Canada, France, Germany, Ireland, Spain, and Japan. This strategic acquisition positions the combined entity to deliver companion digital therapeutic programs across nine markets, supporting the company's 2030 revenue target of USD 6.5 billion.
- May 2026: DarioHealth Corp. expanded its hypertension management program within Solera Health’s network, doubling its addressable market to over 500,000 eligible lives and extending coverage to pre-hypertensive members.
- May 2026: ResMed and ŌURA partnered to integrate wearable sleep health data with ResMed’s clinical care pathways, creating a seamless connection between consumer data and clinical-grade sleep management.
- May 2026: Signant Health acquired Ametris (formerly ActiGraph), combining eCOA solutions with wearable-derived digital measures to address gaps in DTx clinical trial infrastructure.
- April 2026: Click Therapeutics and Boehringer Ingelheim announced a USD 50 million Series D investment and the transfer of full product rights for CT-155, a digital therapeutic for schizophrenia, marking the largest DTx-pharma partnership of 2026.


Global Digital Therapeutics Market Report Scope
As per the scope of the report, the digital therapeutics market refers to the sale of evidence-based, clinically evaluated software programs that deliver therapeutic interventions to patients to prevent, manage, or treat a medical disorder or disease. Digital therapeutics can be used independently or in conjunction with traditional medications and therapies. This market includes products that are used to support the following therapeutic areas: diabetes care, mental and behavioral health, cardiovascular health, and musculoskeletal health.
The digital therapeutics market is segmented by type, application, indication, business model, end-user, and geography. By type, the market includes software, hardware, and services. By application, the market is segmented into prevention, management, and treatment. By indication, the market is categorized into diabetes, obesity, gastrointestinal disorders, cardiovascular disease, central nervous system disorders, respiratory disorders, smoking cessation, and other indications. By business model, the market is segmented into direct-to-consumer, business-to-business, and fee-for-service. By end-user, the market is segmented into patients, providers, payers, and employers. By geography, the market is analyzed across North America, Europe, Asia-Pacific, the Middle East and Africa, and South America. The report also covers the estimated market sizes and trends for 17 countries across major regions globally. The report offers the market sizes and forecasts in terms of value (USD) for the above segments.
| Softwares |
| Hardware |
| Services |
| Prevention |
| Management |
| Treatment |
| Diabetes |
| Obesity |
| Gastrointestinal Disorders |
| Cardiovascular Disease |
| Central Nervous System Disorders |
| Respiratory Disorders |
| Smoking Cessation |
| Other Indications |
| Direct-to-Consumer |
| Business-to-Business |
| Fee-for-Service |
| Patients |
| Providers |
| Payers |
| Employers |
| North America | United States |
| Canada | |
| Mexico | |
| Europe | Germany |
| United Kingdom | |
| France | |
| Italy | |
| Spain | |
| Rest of Europe | |
| Asia-Pacific | China |
| India | |
| Japan | |
| Australia | |
| South Korea | |
| Rest of Asia-Pacific | |
| Middle East and Africa | GCC |
| South Africa | |
| Rest of Middle East and Africa | |
| South America | Brazil |
| Argentina | |
| Rest of South America |
| By Type | Softwares | |
| Hardware | ||
| Services | ||
| By Application | Prevention | |
| Management | ||
| Treatment | ||
| By Indication | Diabetes | |
| Obesity | ||
| Gastrointestinal Disorders | ||
| Cardiovascular Disease | ||
| Central Nervous System Disorders | ||
| Respiratory Disorders | ||
| Smoking Cessation | ||
| Other Indications | ||
| By Business Model | Direct-to-Consumer | |
| Business-to-Business | ||
| Fee-for-Service | ||
| By End User | Patients | |
| Providers | ||
| Payers | ||
| Employers | ||
| Geography | North America | United States |
| Canada | ||
| Mexico | ||
| Europe | Germany | |
| United Kingdom | ||
| France | ||
| Italy | ||
| Spain | ||
| Rest of Europe | ||
| Asia-Pacific | China | |
| India | ||
| Japan | ||
| Australia | ||
| South Korea | ||
| Rest of Asia-Pacific | ||
| Middle East and Africa | GCC | |
| South Africa | ||
| Rest of Middle East and Africa | ||
| South America | Brazil | |
| Argentina | ||
| Rest of South America | ||


Key Questions Answered in the Report
What is the 2031 outlook for digital therapeutics?
The digital therapeutics market is forecast to reach USD 38.54 billion by 2031 from USD 12.51 billion in 2026, growing at a 25.24% CAGR over 2026 to 2031.
Which type segment leads revenue in digital therapeutics?
Softwares led the market in 2025 with a 53.78% share, while services is expected to grow faster at a 27.10% CAGR through 2031.
Which disease area is currently the largest for digital therapeutics solutions?
Diabetes was the largest indication in 2025 with 29.55% share, supported by strong commercial use in cardiometabolic care and measurable outcome tracking.
Why is CNS becoming a faster-growing area for digital therapeutic adoption?
CNS disorders is projected to grow at a 28.76% CAGR through 2031 because of stronger product pipelines, more regulatory activity, and deeper demand in ADHD, depression, and schizophrenia care.
Which region has the strongest current position in digital therapeutics?
North America led with 41.25% share in 2025 because of stronger regulatory structure, deeper employer adoption, and more advanced reimbursement experimentation.
What is the biggest operational challenge for digital therapeutics companies?
Reimbursement fragmentation and weak patient persistence remain the main operational barriers, with digital depression interventions showing a mean completion rate of 44.2% in the cited review.
Page last updated on:


