Digital Signage Services Market Size and Share
Market Overview
| Study Period | 2020 - 2031 |
|---|---|
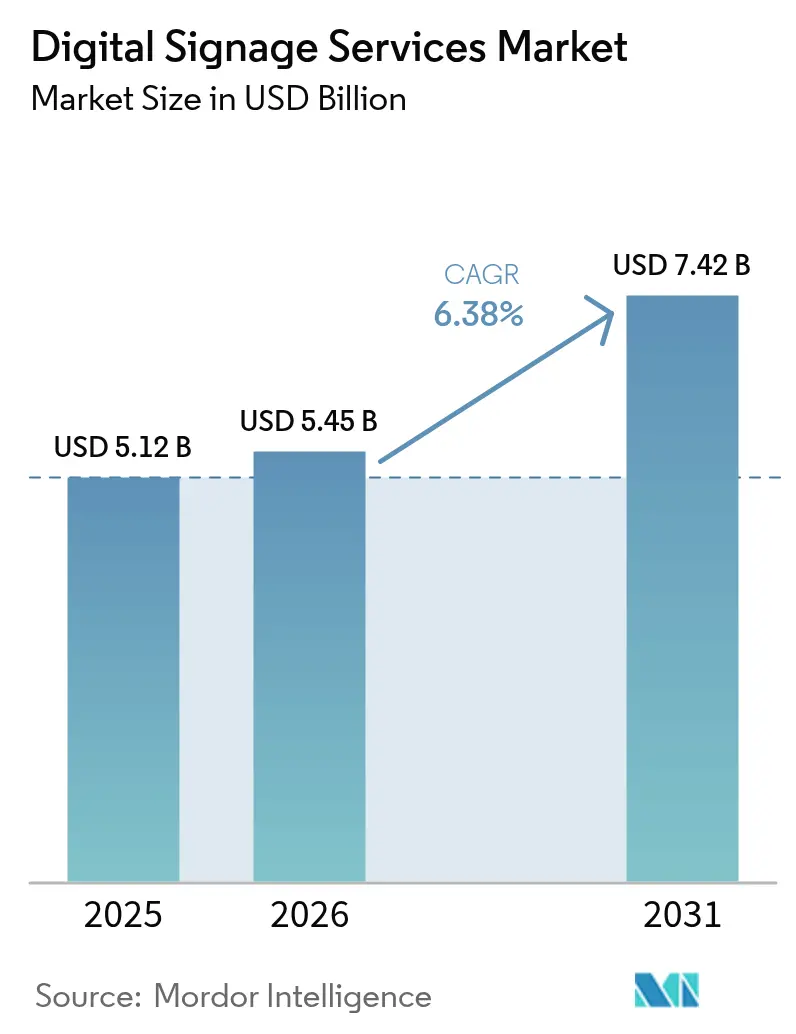
| Market Size (2026) | USD 5.45 Billion |
| Market Size (2031) | USD 7.42 Billion |
| Growth Rate (2026 - 2031) | 6.38% CAGR |
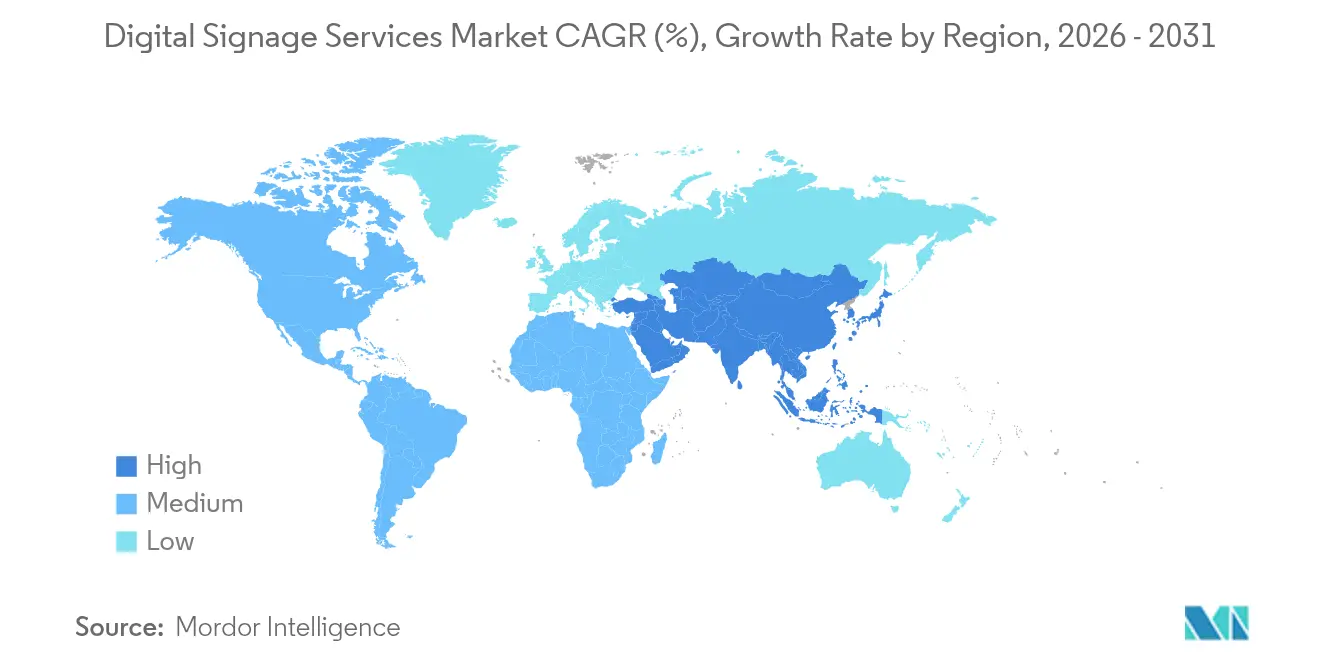
| Fastest Growing Market | Asia Pacific |
| Largest Market | North America |
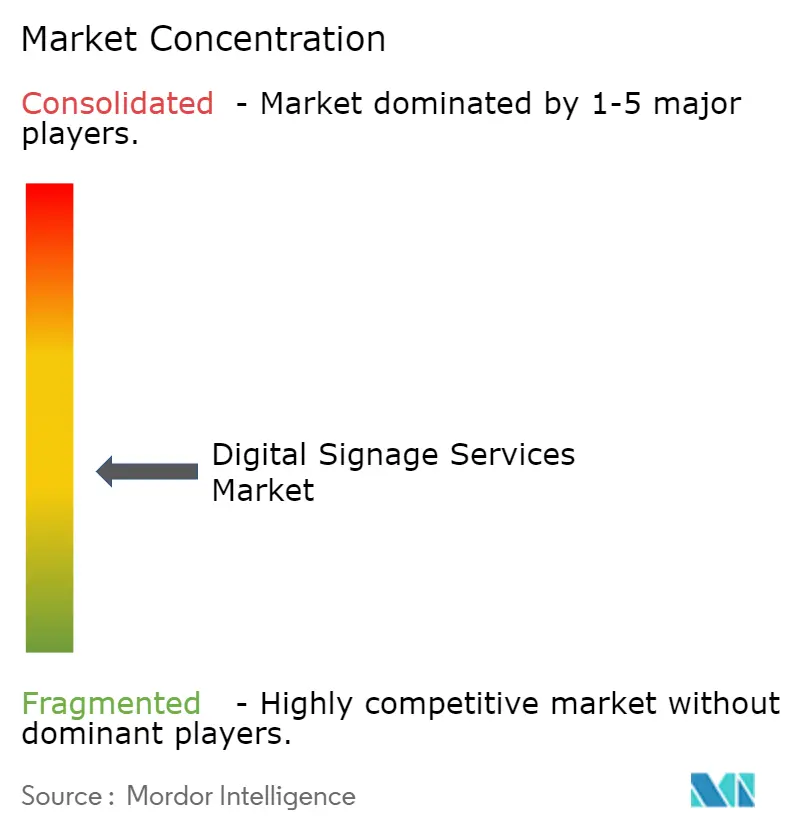
| Market Concentration | Medium |
Major Players *Disclaimer: Major Players sorted in no particular order Image © Mordor Intelligence. Reuse requires attribution under CC BY 4.0. | |
Digital Signage Services Market Analysis by Mordor Intelligence
Digital Signage Services market size in 2026 is estimated at USD 5.45 billion, growing from 2025 value of USD 5.12 billion with 2031 projections showing USD 7.42 billion, growing at 6.38% CAGR over 2026-2031. The rise reflects enterprises moving from static billboards to connected display networks that demand specialist installation, cloud management, maintenance and analytics. Retail digitization, transportation-hub modernization, healthcare way-finding and energy-efficient LED retrofits are the strongest growth engines. Subscription-based content management is widening access for small and medium businesses, while 4K and 8K video walls are elevating long-term support revenues. Service providers that combine cybersecurity compliance, real-time data integration and hardware-agnostic cloud platforms are strengthening their competitive edge.
Key Report Takeaways
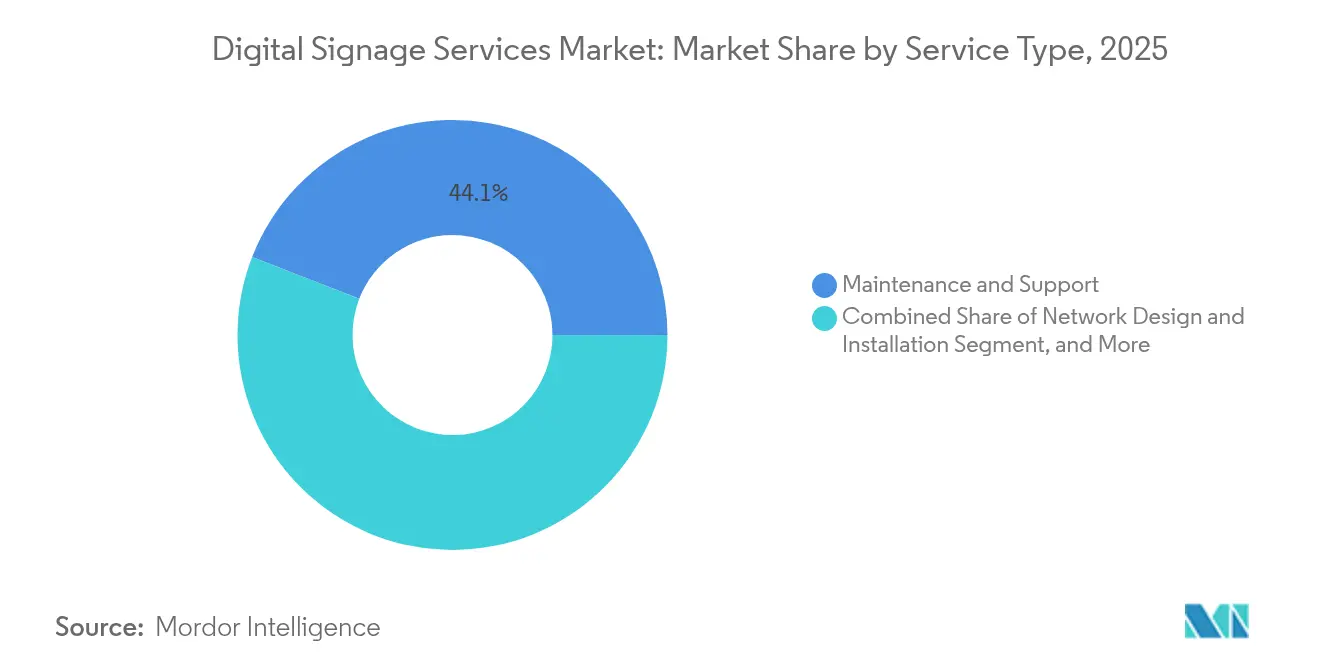
- By service type, Maintenance and Support held 44.10% of the Digital Signage Services market share in 2025 while Managed / Cloud Network Services is advancing at an 7.95% CAGR to 2031
- By deployment mode, On-premise Managed solutions accounted for 58.90% of the Digital Signage Services market size in 2025, whereas Cloud / Hosted Managed services show a 7.52% CAGR through 2031.
- By location, indoor installations commanded 63.95% share of the Digital Signage Services market size in 2025; outdoor installations are projected to grow at 7.05% CAGR to 2031.
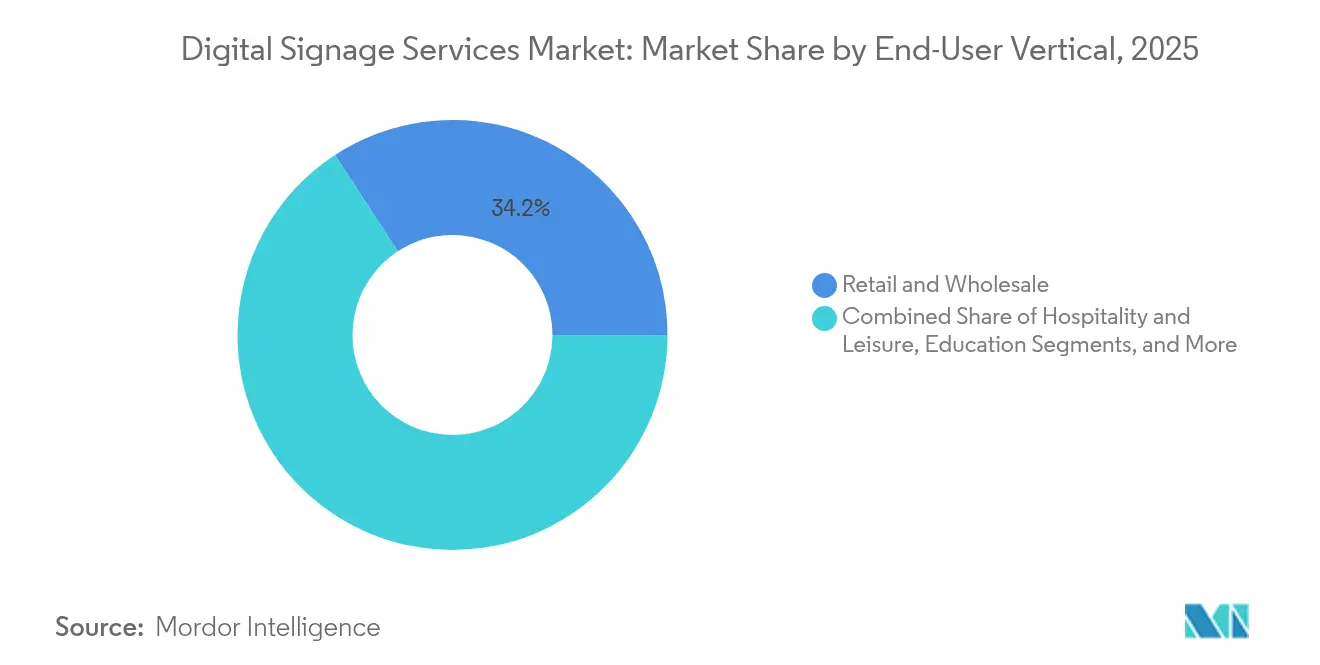
- By end-user vertical, retail led with 34.20% revenue share in 2025; healthcare is the fastest-growing vertical at 8.35% CAGR until 2031.
- By display format, video walls held 27.75% revenue share in 2025; interactive touch screens are set to expand at 8.85% CAGR to 2031.
- By geography, North America captured 37.40% regional revenue in 2025; Asia-Pacific is the fastest-growing geography at 6.95% CAGR through 2031.
Note: Market size and forecast figures in this report are generated using Mordor Intelligence’s proprietary estimation framework, updated with the latest available data and insights as of 2026.
Global Digital Signage Services Market Trends and Insights
Drivers Impact Analysis*
| Driver | (~) % Impact on CAGR Forecast | Geographic Relevance | Impact Timeline |
|---|---|---|---|
| Retail demand for dynamic in-store messaging | +1.8% | North America, spillover to Europe | Medium term (2-4 years) |
| Transportation hubs modernize passenger communication | +1.2% | Global, early in North America and Europe | Long term (≥ 4 years) |
| Rapid deployment of 4K / 8K LED walls | +1.5% | Developed markets | Medium term (2-4 years) |
| Subscription-based CMS adoption by SMBs | +1.1% | Asia-Pacific core, expanding to emerging markets | Short term (≤ 2 years) |
| Healthcare way-finding and patient engagement screens | +0.9% | Global | Long term (≥ 4 years) |
| Energy-efficiency mandates driving LED retrofits | +0.8% | Europe and North America, expanding to Asia-Pacific | Medium term (2-4 years) |
| Source: Mordor Intelligence | |||
Retail demand for dynamic in-store messaging
Retailers redesigned store communication around real-time data feeds. Walmart’s roll-out of digital price screens across 2,300 stores represented a USD 200 million capital program that needs ongoing content orchestration and device monitoring. Convenience chains such as 7-Eleven run more than 8,400 cloud-managed displays that synchronize promotions with inventory levels.[1]signageOS Team, “CRI Expanded 7-Eleven Network,” signageos.io Specialist integrators benefit from consulting revenues tied to data architecture and workflow automation. Regional grocers like Kwik Trip reported USD 1.9 million in annual savings after shifting to system-on-chip displays that reduce hardware points.[2]PPDS Editorial, “Kwik Trip,” ppds.com
Transportation hubs modernize passenger communication
Bus, rail and airport operators are replacing isolated displays with unified, cloud-hosted networks that push live travel data across sites. Greyhound connected over 50 cities using Philips D-Line and P-Line screens managed through a single content platform.[3]PPDS Editorial, “Greyhound,” ppds.com Centralized control simplifies template standards, branding and emergency alerts while creating multi-year service contracts covering design, integration and 24 × 7 support. Multilingual content, accessibility compliance and mobile hand-off features widen project scope for service providers.
Rapid deployment of 4K/8K LED walls
Next-generation LED walls introduced at InfoComm 2024 require colour calibration, heat management and predictive diagnostics beyond conventional LCD installs.[4]Samsung Newsroom, “Samsung SmartThings Pro and Next-Gen Display Tech at InfoComm,” news.samsung.com LG plans to double Business Solutions revenue to KRW 10 trillion by 2030 on the back of fine-pitch LED projects bundled with life-cycle service agreements. The complexity drives demand for quarterly inspection, module swap programs and operator training services.
Subscription-based CMS adoption by SMBs
Seventy percent of Asia-Pacific SMBs accelerated digital transformation and now prioritise cloud services that spread costs as monthly fees, according to the Asia Small and Medium-Sized Enterprise Monitor 2024.[5]Samsung Newsroom, “Samsung SmartThings Pro and Next-Gen Display Tech at InfoComm,” news.samsung.com Subscription platforms bundle hosting, updates and remote support, lowering barriers for franchises and regional chains. Providers gain predictable recurring revenue while offering advanced analytics formerly restricted to large enterprises.
*Our forecasts treat driver/restraint impacts as directional, not additive. The impact forecasts reflect baseline growth, mix effects, and variable interactions.
Segment Analysis
By Service Type: Maintenance anchors revenues while cloud services accelerate
Maintenance and Support accounted for 44.10% of the Digital Signage Services market share in 2025, underscoring the importance of round-the-clock diagnostics, firmware updates and field repairs. Managed / Cloud Network Services is expanding at an 7.95% CAGR as enterprises favor remote monitoring, automated content distribution and analytics dashboards. The Digital Signage Services market size tied to break-fix contracts is therefore evolving toward predictive models that bundle spare-part pools and device health alerts.
Ongoing cloud migration is reshaping revenue mixes. Providers wrap subscription billing around hosting, API integrations and performance reporting, creating stable recurring cash flows. Consulting, content creation and analytics services ride this shift by helping clients connect inventory feeds, loyalty data and audience metrics to dynamic playlists. Specialist touchless-interaction projects add incremental services as retailers aim for hygienic experiences.


By Deployment Mode: On-premise leadership faces cloud momentum
On-premise Managed solutions held 58.90% of the Digital Signage Services market size in 2025 as healthcare, finance and government users insisted on local servers and data residency. Cloud / Hosted Managed platforms are growing at 7.52% CAGR, propelled by SMBs that lack in-house IT support and by multi-site brands seeking centralized control.
Hybrid topologies are emerging that store content locally yet draw scheduling logic from the cloud, balancing uptime with scalability. Vendors differentiate through encrypted media pipelines, role-based access and automated patching frameworks. As bandwidth costs fall, even data-sensitive sectors pilot cloud sandboxes for non-personal content, signaling future share gains for hosted services.
By Location: Indoor installations dominate while outdoor networks surge
Indoor deployments captured 63.95% of the Digital Signage Services market share in 2025, benefiting from controlled lighting, temperature and lower vandalism risk. Outdoor networks, including roadside LED billboards and transit kiosks, are advancing at 7.05% CAGR thanks to smart-city funding and programmatic advertising demand.
Service providers tailor weatherproof enclosures, high-brightness calibration and remote environmental monitoring to meet stringent uptime targets. Semi-outdoor locations such as drive-through lanes drive demand for specialized cabling, anti-glare coatings and thermal management. Energy-efficiency retrofits, often mandated by local regulations, further expand maintenance and upgrade contracts across all location categories.
By End-User Vertical: Retail leads but healthcare grows fastest
Retail and wholesale delivered 34.20% of 2025 revenue, reflecting heavy deployment of shelf-edge labels, queue-management screens and omnichannel promotion playlists. Healthcare is poised for an 8.35% CAGR as hospitals invest in way-finding, patient-call and educational displays to improve visitor flow and staff efficiency. The Digital Signage Services market size linked to transportation, hospitality and education also expands steadily on passenger-information, guest-engagement and campus-alert projects.
Vertical specialization shapes service offerings. Retail clients prioritize ERP integration and dynamic pricing engines, whereas healthcare buyers demand HIPAA-compliant networks and antimicrobial touch surfaces. Transportation operators seek GPS data feeds and multilingual templates, pushing integrators to master both content logic and edge-device telemetry.
By Display Format: Video walls prevail while interactive screens outpace
Video walls generated 27.75% of 2025 revenue due to bezel-less arrays that power immersive brand activations and command-center dashboards. Interactive touch screens follow with a 8.85% CAGR as self-checkout, visitor registration and classroom collaboration scale across sectors. The Digital Signage Services market size around kiosks, menu boards and digital posters is buoyed by programmatic ad software that optimizes playback by weather and foot traffic.
High-resolution LED canvases demand precision calibration, heat dissipation design and quarterly health checks, locking in premium support fees. Interactive estates require UX testing, gesture-sensor tuning and privacy-compliant data capture. Emerging transparent and holographic displays, though niche, create consulting opportunities for content choreography and spatial design, further diversifying service revenues.
Geography Analysis
North America kept 37.40% of 2025 revenue based on large-scale retail make-overs, nationwide transportation networks and early cloud adoption. Walmart’s 2,300-store price label project and 7-Eleven’s 8,400-display estate underline deal sizes that require multi-year managed-service contracts. Government stimulus for infrastructure upgraded bus and rail passenger information, further fuelling demand.
Asia-Pacific is the fastest-growing region at 6.95% CAGR to 2031. High urban growth, competitive retail markets and supportive SME digitalisation grants drive uptake. Subscription CMS solutions trim capex, fostering entry for local retailers and QSR chains. Strong panel manufacturing ecosystems in China and South Korea shorten supply cycles and lower hardware prices.
Europe advances steadily yet absorbs compliance overheads. Firms increased security budgets to satisfy the NIS 2 Directive. Energy-efficiency directives and city-level carbon targets encourage LED retrofits and life-cycle service agreements. EU recovery funds cushion SME adoption costs even as the Digital Signage Services industry navigates complex privacy regulations.

Competitive Landscape
Samsung Electronics has led the Digital Signage Services Market for fifteen straight years with a 33% global unit share in 2023, bundling hardware, software and managed services into turn-key programs. LG Electronics aims to double Business Solutions revenue to KRW 10 trillion by 2030, focused on premium LED and service depth.
Service-centric acquisitions continued. BroadSign integrated Navori to broaden hosted CMS capabilities. Vertiseit purchased Visual Art to add creative and regional scale. Stratacache absorbed a German Scala partner to extend European field service. These moves signal a race for recurring revenue over hardware margins.
White-space opportunities persist in healthcare, education and government, where accessibility mandates and integration complexity deter price-only competitors. Cloud-native platforms that integrate audience analytics and AI-driven content optimisation are emerging disruptors.
Digital Signage Services Industry Leaders
Noventri
BlueStar, Inc.
eyefactive GmbH
Zetadisplay AB
Trison World
- *Disclaimer: Major Players sorted in no particular order

Recent Industry Developments
- February 2025: LG Electronics targeted 60% sales growth in the United States B2B segment with an emphasis on digital signage services and premium cloud-managed displays.
- January 2025: LG Electronics recorded KRW 87.73 trillion sales in 2024, a 6.6% rise attributed partly to B2B signage solution.
- November 2024: The EU Agency for Cybersecurity released its NIS Investments report highlighting a jump in security spending that affects cloud-signage deployments.
- October 2024: Vertiseit acquired Visual Art, strengthening managed-service capacity in Northern Europe
- June 2024: Samsung unveiled SmartThings Pro and modular LED innovations at InfoComm 2024, widening integration service scope


Global Digital Signage Services Market Report Scope
The study's scope includes the revenues accrued from digital signage service activities ranging from network design, installation, technical support, networking services, and content creation/consultation. The study tracks the key market trends, forecasts, and developments for the major regions listed in the scope. It also focuses on the correlation between the growth in digital signage hardware/software and the service industry. The study also focuses on the impact of COVID-19 on the market ecosystem. In the report scope, the existing vendor landscape also covered, which consists of major players operating in the market.
| Network Design and Installation |
| Maintenance and Support |
| Content Creation and Consulting |
| Managed/Cloud Network Services |
| Analytics and Reporting Services |
| Other Specialized Services (Interactive and Touchless Integration) |
| On-premise Managed |
| Cloud/Hosted Managed |
| Indoor |
| Outdoor |
| Semi-Outdoor |
| Retail and Wholesale |
| Transportation and Logistics |
| Hospitality and Leisure |
| Healthcare |
| Education |
| Corporate and BFSI |
| Government and Public Institutions |
| Sports and Entertainment Venues |
| Others |
| Video Walls |
| Kiosks and Self-Service Terminals |
| Menu Boards |
| Digital Posters and Billboards |
| Interactive Touch Screens |
| Transparent and Holographic Displays |
| North America | United States | |
| Canada | ||
| Mexico | ||
| Europe | Germany | |
| United Kingdom | ||
| France | ||
| Spain | ||
| Rest of Europe | ||
| South America | Brazil | |
| Rest of South America | ||
| Asia-Pacific | China | |
| Japan | ||
| India | ||
| South-East Asia | ||
| Rest of Asia-Pacific | ||
| Middle East and Africa | Middle East | Gulf Cooperation Council Countries |
| Turkey | ||
| Rest of Middle East | ||
| Africa | South Africa | |
| Rest of Africa | ||
| By Service Type | Network Design and Installation | ||
| Maintenance and Support | |||
| Content Creation and Consulting | |||
| Managed/Cloud Network Services | |||
| Analytics and Reporting Services | |||
| Other Specialized Services (Interactive and Touchless Integration) | |||
| By Deployment Mode | On-premise Managed | ||
| Cloud/Hosted Managed | |||
| By Location | Indoor | ||
| Outdoor | |||
| Semi-Outdoor | |||
| By End-User Vertical | Retail and Wholesale | ||
| Transportation and Logistics | |||
| Hospitality and Leisure | |||
| Healthcare | |||
| Education | |||
| Corporate and BFSI | |||
| Government and Public Institutions | |||
| Sports and Entertainment Venues | |||
| Others | |||
| By Display Format | Video Walls | ||
| Kiosks and Self-Service Terminals | |||
| Menu Boards | |||
| Digital Posters and Billboards | |||
| Interactive Touch Screens | |||
| Transparent and Holographic Displays | |||
| By Geography | North America | United States | |
| Canada | |||
| Mexico | |||
| Europe | Germany | ||
| United Kingdom | |||
| France | |||
| Spain | |||
| Rest of Europe | |||
| South America | Brazil | ||
| Rest of South America | |||
| Asia-Pacific | China | ||
| Japan | |||
| India | |||
| South-East Asia | |||
| Rest of Asia-Pacific | |||
| Middle East and Africa | Middle East | Gulf Cooperation Council Countries | |
| Turkey | |||
| Rest of Middle East | |||
| Africa | South Africa | ||
| Rest of Africa | |||


Key Questions Answered in the Report
What is the current size of the Digital Signage Services Market?
The market is valued at USD 5.45 billion in 2026 and is forecast to reach USD 7.42 billion by 2031.
Which service category generates the most revenue?
Maintenance and Support services led with 44.10% revenue share in 2025
Which region is expanding fastest?
Asia-Pacific shows the highest growth at 6.95% CAGR during 2026-2031.
Why are cloud-managed services growing?
Enterprises and SMBs prefer cloud platforms for centralized control, remote updates and subscription-based pricing, driving a 7.52% CAGR in cloud-hosted deployments.
What are the main restraints on market growth?
High cybersecurity compliance costs in Europe and price-driven competition from low-service integrators are the most significant limiting factors.
How consolidated is the competitive landscape?
Top vendors account for slightly more than 60% of revenue, indicating moderate concentration that still allows niche specialists to thrive.
Page last updated on:


