
Digital Signage Media Player Market Size and Share
Market Overview
| Study Period | 2020 - 2031 |
|---|---|
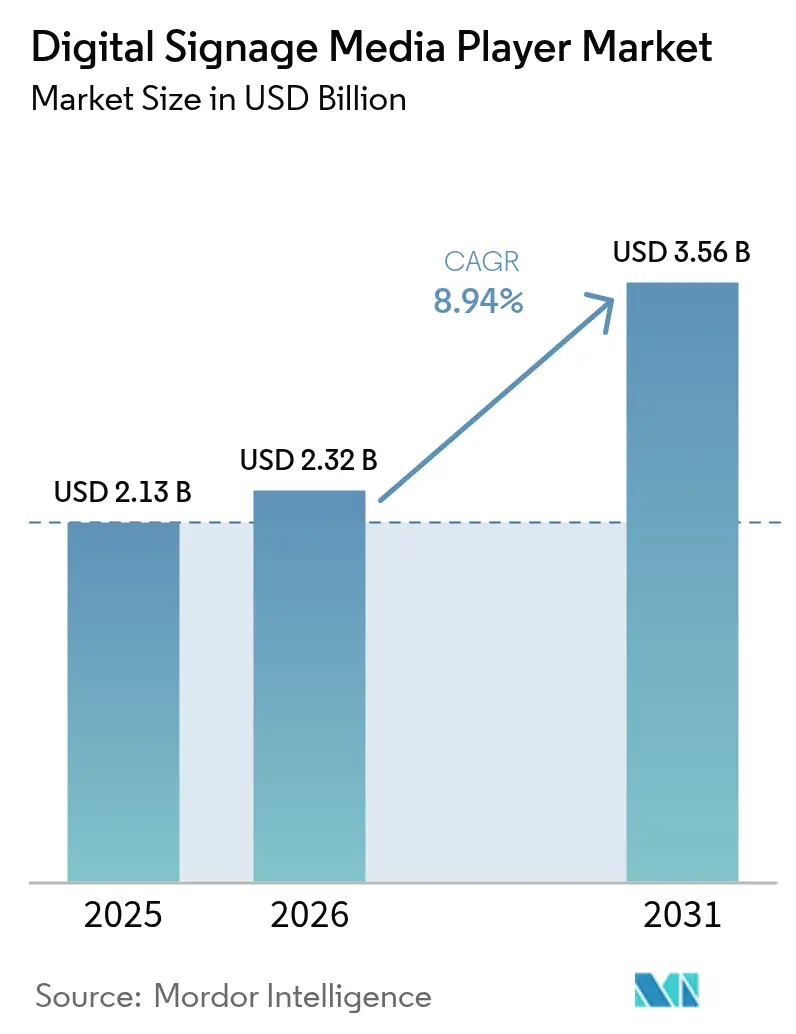
| Market Size (2026) | USD 2.32 Billion |
| Market Size (2031) | USD 3.56 Billion |
| Growth Rate (2026 - 2031) | 8.94 % |
| Fastest Growing Market | Asia Pacific |
| Largest Market | North America |
| Market Concentration | Medium |
Major Players *Disclaimer: Major Players sorted in no particular order Image © Mordor Intelligence. Reuse requires attribution under CC BY 4.0. | |
Digital Signage Media Player Market Analysis by Mordor Intelligence
Digital Signage Media Player market size in 2026 is estimated at USD 2.32 billion, growing from 2025 value of USD 2.13 billion with 2031 projections showing USD 3.56 billion, growing at 8.94% CAGR over 2026-2031. Growth is propelled by the rapid pairing of next-generation System-on-Chip chipsets with on-device artificial intelligence that lets operators automate content decisions at the screen level. Media processors integrating 4K and 8K decoding now fit inside compact form factors, enabling retail chains, transit hubs, and corporate campuses to scale dynamic messaging without bulky servers. Falling solid-state storage prices, improving Wi-Fi 6 performance, and cloud-native content tools further widen the addressable base of small and mid-sized enterprises, while lower LCD and LED panel prices sustain momentum in cost-sensitive regions. Competitive intensity is rising as display makers embed media players directly into commercial panels, challenging standalone player vendors to differentiate through software, analytics, and security features.
Key Report Takeaways
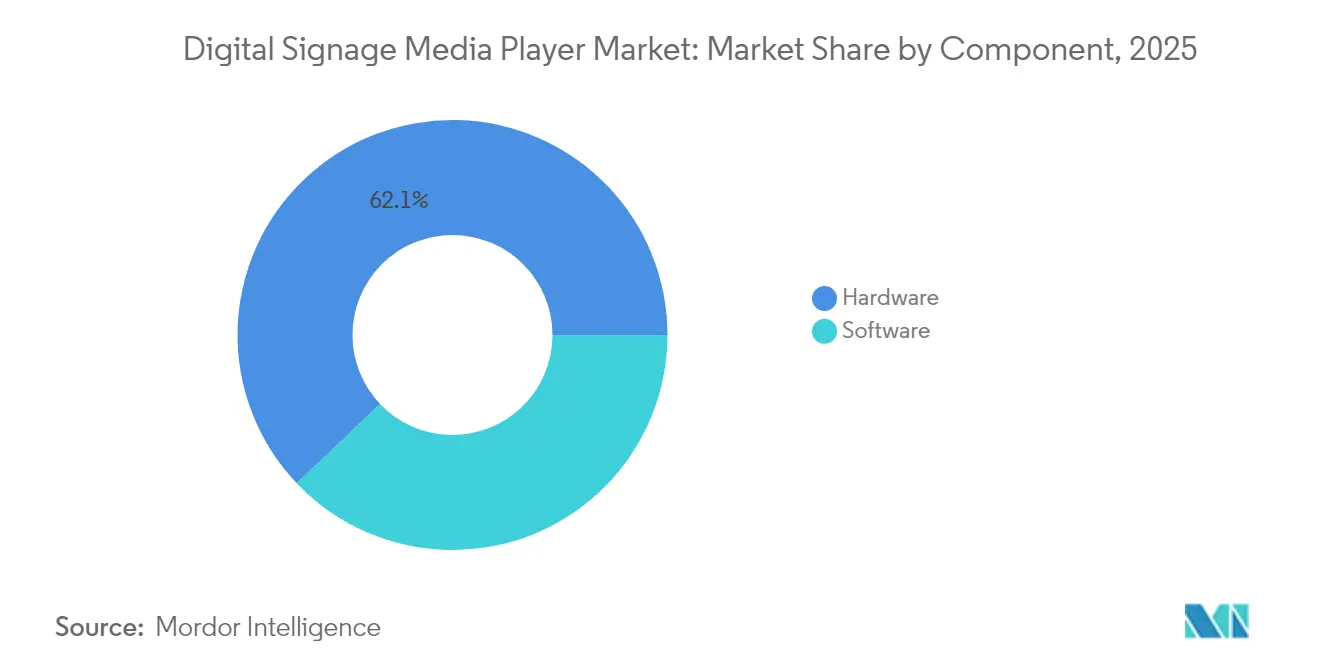
- By component, hardware led with 62.10% of the Digital Signage Media Player market share in 2025, while software is expanding at a 10.12% CAGR through 2031.
- By product, advanced-level units captured 46.30% revenue in 2025; enterprise-level solutions are projected to grow at a 10.22% CAGR to 2031.
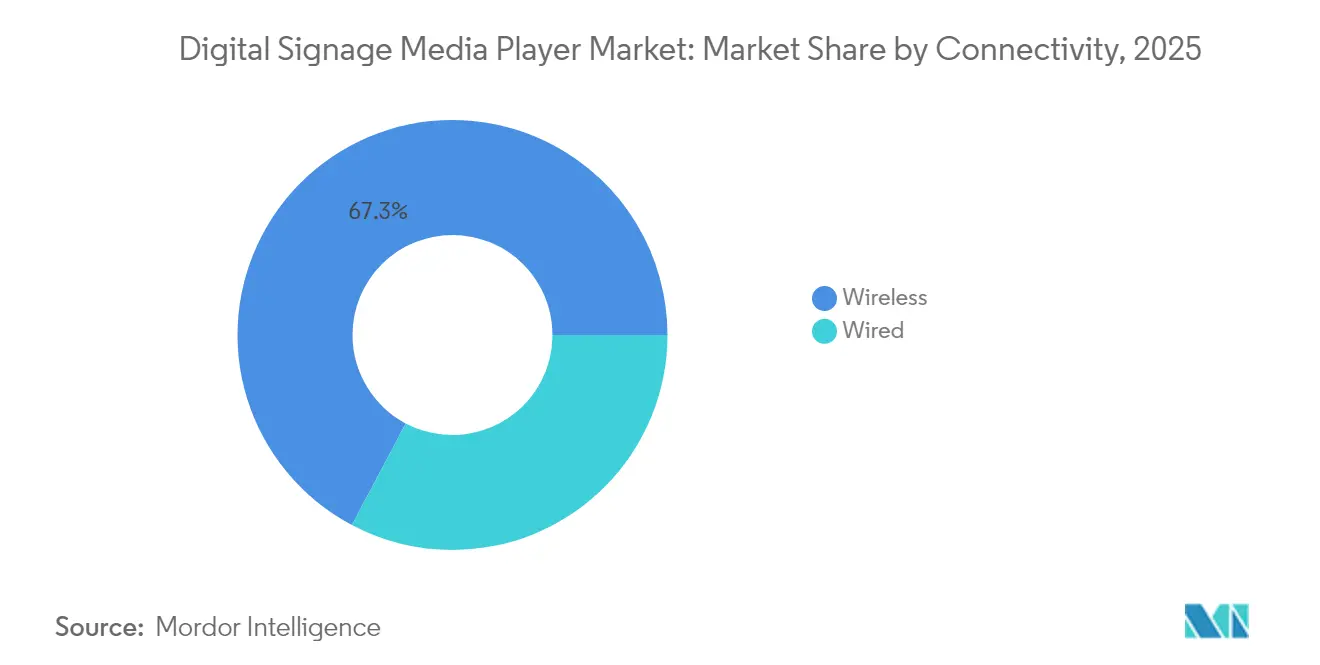
- By connectivity, wireless options accounted for 67.25% deployments in 2025 and are progressing at an 11.48% CAGR to 2031.
- By application, retail held a 36.35% share of the Digital Signage Media Player market size in 2025, whereas transportation is rising at an 11.09% CAGR through 2031.
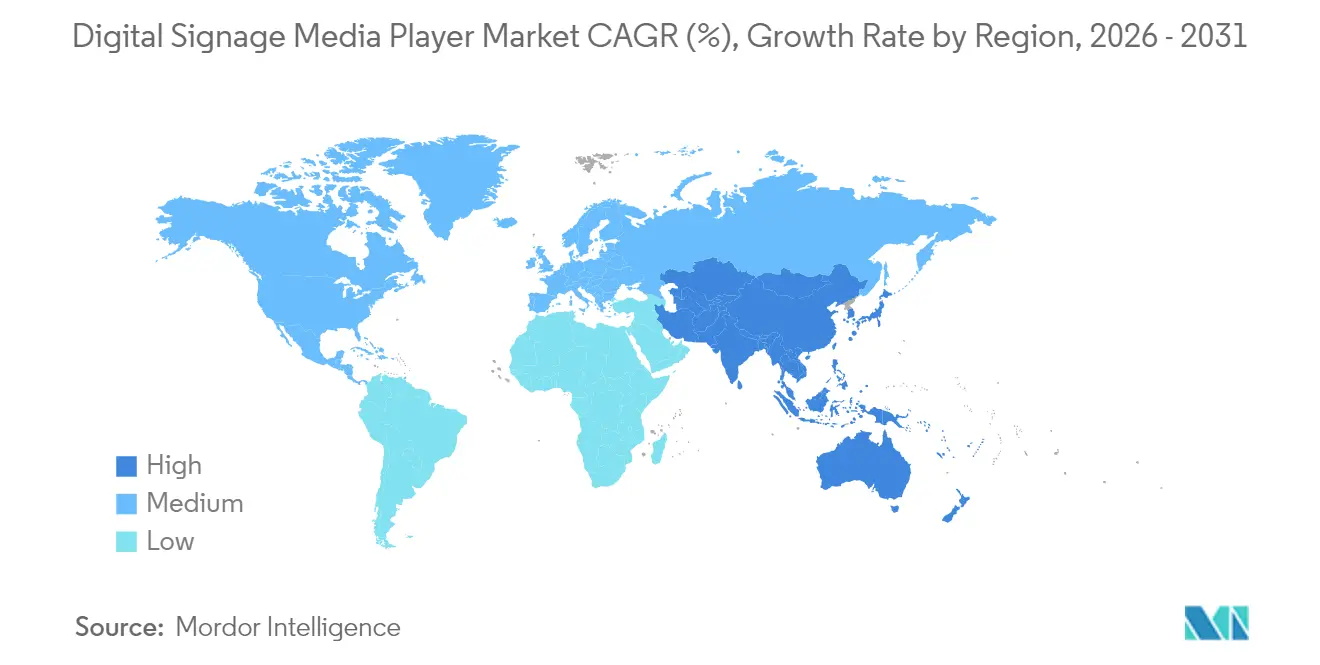
- By geography, North America commanded 32.85% revenue in 2025, and Asia-Pacific exhibits the top CAGR at 11.95% to 2031.
Note: Market size and forecast figures in this report are generated using Mordor Intelligence’s proprietary estimation framework, updated with the latest available data and insights as of 2026.
Market Trends and Insights
Drivers Impact Analysis of Digital Signage Media Player Market*
| Driver | (~) % Impact on CAGR Forecast | Geographic Relevance | Impact Timeline |
|---|---|---|---|
| Proliferation of 4K/8K SoC-based media players | +2.10% | Global, with early adoption in North America and EU | Medium term (2-4 years) |
| Falling SSD and DRAM prices lowering BOM cost | -+1.80% | Global, particularly benefiting APAC manufacturing | Short term (≤ 2 years) |
| Declining LCD/LED signage hardware prices | +1.40% | Global, with strongest impact in price-sensitive APAC markets | Short term (≤ 2 years) |
| Retail analytics demand for real-time content triggers | +1.90% | North America and EU retail markets, expanding to APAC | Medium term (2-4 years) |
| Edge-AI inference enabling hyper-local ads | +1.60% | Global, with premium adoption in developed markets | Long term (≥ 4 years) |
| Open-source CMS ecosystems shortening refresh cycles | +0.90% | Global, particularly impacting SME deployments | Short term (≤ 2 years) |
| Source: Mordor Intelligence | |||
Proliferation of 4K/8K SoC-based media players
Media-grade chipsets such as MediaTek MT9679 integrate native 8K decoding while consuming 40% less power than discrete GPU boards, cutting rack-space needs and service calls in transit hubs and corporate campuses.[1]MediaTek Newsroom, “MediaTek Announces MT9629 and MT9679 SoCs for Digital Signage Applications,” mediatek.com BrightSign’s XT1145 line illustrates how single-board designs eliminate external servers, shrinking the total cost of ownership. The compact architecture also resists dust ingress and vibration, unlocking outdoor and industrial niches. As more displays ship with built-in computing, the Digital Signage Media Player market gains fresh demand for software-centric orchestration rather than replacement hardware.
Falling SSD and DRAM prices are lowering BOM cost
NAND flash prices surged 77% in 2024, yet per-gigabyte economics still improved as higher-density dies reached volume scale. Vendors responded by doubling onboard storage on mid-tier players, enabling richer video and AI models without external drives. Although DRAM pricing climbed on AI server demand, controller advances allowed tighter memory footprints that offset cost spikes. The net result keeps entry-level price points stable, sustaining deployments among small retailers and QSR chains across Southeast Asia.
Retail analytics demand for real-time content triggers
Samsung’s SmartSigns Pro bundles AI cameras with its VXT cloud platform at USD 199 per display per month, letting franchisees tailor ads to dwell time and sentiment inside stores.[2]Business Wire, “Samsung, Cielo Partner to Redefine Retail Advertising with AI-Powered Digital Signage Technology,” iconnect007.com Real-time triggers lift conversion rates and provide proof-of-play metrics, strengthening ROI cases during budget reviews. The template also satisfies brand compliance by locking layouts yet localizing offers, a critical feature for multi-store grocery operators. As privacy rules tighten, retailers favor on-device analytics that never stream facial data to the cloud, reinforcing the need for high-performance local processors within the Digital Signage Media Player market.
Edge-AI inference enabling hyper-local ads
Axiomtek and Edge Signal now ship fanless players with neural accelerators that perform object detection at under 50 ms latency, enabling bus-shelter displays to modify creative based on pedestrian density. The design reduces upstream bandwidth, an attribute prized by telecom-led smart-city pilots in Western Europe.[3]Bird & Bird, “China TMT Annual Review 2024 and Outlook 2025 (II),” twobirds.com Beyond advertising, the same silicon monitors queue length, inventory gaps, and safety gear adherence, feeding enterprise dashboards without specialized cameras. These multi-use cases widen the justification for premium hardware SKUs that command higher margins.
Restraints Impact Analysis of Digital Signage Media Player Market*
| Restraint | (~) % Impact on CAGR Forecast | Geographic Relevance | Impact Timeline |
|---|---|---|---|
| Fragmented signage OS and CMS standards | -1.20% | Global, particularly affecting multi-vendor deployments | Medium term (2-4 years) |
| Cyber-security vulnerabilities in SoC firmware | -0.80% | Global, with heightened concern in regulated industries | Short term (≤ 2 years) |
| Supply-chain volatility of industrial-grade GPUs | -1.50% | Global, with acute impact on specialized applications | Short term (≤ 2 years) |
| Rising e-paper alternatives for low-power signage | -0.70% | Global, particularly impacting outdoor and battery-powered applications | Long term (≥ 4 years) |
| Source: Mordor Intelligence | |||
Fragmented signage OS and CMS standards
Samsung’s retirement of MagicINFO Cloud requires customers to migrate to VXT or rebuild on another stack by May 2026, illustrating the cost of proprietary lock-in.[4]M-Medientechnik, “Samsung VXT The Innovative Digital Signage CMS for Advanced Solutions,” m-medientechnik24.de Hospitality groups operating mixed fleets from multiple vendors often juggle three or more dashboards, inflating training and maintenance hours. Although open-source suites like Xibo promote RESTful APIs, certification gaps keep large system integrators cautious. The absence of a neutral standards body delays mass adoption of plug-and-play peripherals, slowing rollouts in price-sensitive public-sector tenders inside the Digital Signage Media Player market.
Cyber-security vulnerabilities in SoC firmware
HKCERT has cataloged privilege-escalation flaws in outdated Linux kernels embedded in media players, warning that attackers can pivot into broader corporate networks.[5]HKCERT, “IoT Security Guidelines for Digital Signage Systems,” hkcert.org Firmware patches are seldom automated, leaving devices un-updated for years in ceiling mounts or kiosk enclosures. Industries such as health care and air transport now require FIPS-validated encryption and secure boot, features still missing from most consumer-grade boards. Compliance gaps force buyers to favor pricier ruggedized appliances or to deploy out-of-band security gateways, adding cost and complexity.
*Our forecasts treat driver/restraint impacts as directional, not additive. The impact forecasts reflect baseline growth, mix effects, and variable interactions.
Digital Signage Media Player Market Segment Analysis
By Component:
Software momentum counters hardware scaleHardware accounted for 62.10% of the Digital Signage Media Player market in 2025 thanks to ongoing demand for commercial-grade displays, solid-state drives, and mounting brackets. System-on-Chip integration is lowering the bill-of-materials, yet the sheer volume of panels shipping with embedded processors keeps revenue tilted toward physical assets. Conversely, software is charting a 10.12% CAGR to 2031 as subscription-based content management, AI analytics, and fleet orchestration unlock recurring revenue. The blended model lets vendors transition from one-time hardware sales to annuity streams, a shift welcomed by investors seeking margin resilience. Samsung’s VXT suite bundles creative tools, device telemetry, and AI text-to-image generation in a single license that pairs neatly with its displays. Smaller integrators white-label open-source back-ends, competing on vertical templates for education and hospitality. As enterprises recalibrate total cost of ownership, buyers emphasize lifetime software roadmap and security patch cadence over CPU clock speeds, nudging procurement matrices toward SaaS metrics.
The evolution is steering the Digital Signage Media Player market toward holistic offerings where hardware reliability and software agility co-define value propositions. Manufacturers respond by pre-installing operating systems, secure boot loaders, and zero-touch enrollment keys that compress deployment timelines from weeks to hours. On the user side, marketing teams favor cloud dashboards that support campaign A/B tests and remote proof of play, reducing truck rolls. As data becomes the primary monetization lever, analytics plug-ins that quantify dwell time, gender mix, and traffic patterns are fast becoming standard SKUs. The result is a virtuous loop: richer insights drive bigger ad budgets, spurring upgrades to higher-capacity players with on-device GPUs, which in turn feed more data back to software layers.



By Product:
Enterprise-level solutions seize growth spotlightAdvanced-level units held 46.30% revenue in 2025 by striking balance between cost and performance, yet enterprise-grade models are projected to rise at 10.22% CAGR, the quickest among product tiers. Enterprise buyers demand high-availability features such as redundant power inputs, secure element chips, and IT-friendly APIs, elevating average selling price. The segment also mandates 24/7 duty cycles, extended temperature tolerance, and five-year firmware support, attributes seldom found in entry-level hardware. Partnerships such as LG-BrightSign integrate BrightSignOS within panel firmware, blending enterprise-class control with streamlined installation. These collaborations collapse procurement complexity, allowing corporate real-estate teams to specify an all-in-one SKU that marries display and player.
Market perception is shifting as CIOs equate signage endpoints with IoT nodes that must comply with zero-trust frameworks. Enterprise models now embed TPM 2.0 chips, VPN clients, and PKI-based authentication, helping organizations pass internal security audits. Multinational retailers run multi-zone networks across continents; here, unified device analytics and over-the-air firmware upgrades are non-negotiable. This uptick in functional depth supports higher gross margins and reduces churn, cementing enterprise models as the financial engine of the Digital Signage Media Player market.
By Connectivity:
Wireless adoption reshapes deployment economicsWireless accounted for 67.25% of 2025 installations and is accelerating at 11.48% CAGR as operators exploit Wi-Fi 6 throughput and 5G fixed-wireless access to sidestep costly cable runs. Retailers retrofitting older storefronts no longer drill walls for Cat-6, instead pairing players with centrally managed access points that QoS-prioritize 4K streams. Transit agencies install LTE-backed media players on buses and trains to serve geo-fenced ads, widening the Digital Signage Media Player market size for mobile placements. The cost savings per location often reach USD 500, quickly offsetting slightly higher wireless player ASPs.
Wired Ethernet keeps its niche in mission-critical control rooms and airport apron displays where packet loss may compromise safety. Here, Power over Ethernet simplifies power delivery while still guaranteeing deterministic bandwidth. Hybrid architectures emerge in convention centers where backbone fiber fans into Wi-Fi 6 repeaters, letting organizers mix fixed and temporary screens. Vendors broaden portfolios with combo SKUs featuring dual gigabit ports plus Wi-Fi 6E and Bluetooth, letting buyers match site-specific constraints without platform reboots.
By Application:
Transportation surge challenges retail dominanceRetail maintained 36.35% share of the Digital Signage Media Player market size in 2025, benefiting from early digital out-of-home adoption and the migration of printed point-of-purchase material to dynamic displays. The sector continues to refresh networks to 4K HDR to preserve shopper attention amid rising e-commerce competition. Transportation, however, is moving faster with an 11.09% CAGR as airports, metro systems, and highway authorities modernize wayfinding and infotainment. Transport for London equipped 41 Elizabeth Line stations with synchronized LED ribbons that deliver timetable data plus targeted ads. Such programs demonstrate how real-time APIs integrate transit feeds, weather, and emergency alerts into a single playlist.
Corporate offices expand usage beyond lobby walls into desk booking panels and digital room signage that sync with calendar systems, increasing device density per square foot. Hospitality chains layer guest-facing menu boards with back-of-house workforce communications, doubling screen count on shared infrastructure. Education and government adopt emergency-override features, valuing the instant priority override of routine content. Healthcare networks deploy multilingual check-in kiosks and wayfinding corridors, capitalizing on HIPAA-compliant media players that encrypt cached patient data.
Geography Analysis
North America Digital Signage Media Player Market
North America led the Digital Signage Media Player market in 2025 with 32.85% revenue, buoyed by early adoption of 4K and 8K displays, mature retail ecosystems, and aggressive customer-experience budgets. U.S. quick-service restaurants standardized menu-board rollouts across thousands of outlets, generating multi-year refresh cycles. Canadian airports launched smart-gate programs using AI-ready players to merge advertising with touchless boarding guidance, underscoring the region’s appetite for security-certified hardware. Vendors benefit from strong service revenues because enterprises outsource content creation and network management, further enlarging lifetime contract value.
APAC Digital Signage Media Player Market
Asia-Pacific is the pace-setter with a 11.95% CAGR to 2031, powered by urban rail expansions, new mall openings, and government-backed smart-city grants. Chinese city clusters approve integrated street-furniture tenders that bundle 5G small cells with LED displays, stimulating bulk orders from local ODMs. Southeast Asian airports push bilingual passenger-information systems ahead of regional travel booms, while Japanese retailers pilot computer-vision loyalty kiosks in convenience stores. Falling panel prices combined with low labor costs make large-format video walls economical, helping the region challenge North America’s dominance in the Digital Signage Media Player market.
Europe, LATAM and Middle East Digital Signage Media Player Market
Europe remains an influential center owing to stringent data-protection rules that shape player firmware and CMS design. General Data Protection Regulation drives demand for on-premises content hosting, elevating security-enabled appliances over cloud-only rivals. Energy-efficiency targets encourage adoption of mini-LED backlights and power-saving SoCs, creating a green-signage premium segment. Public-private partnerships fund digital bus stops and city-wide wayfinding in Scandinavian capitals, and cultural institutions retrofit museums with interactive guides. Meanwhile, Latin America accelerates through retail modernization and stadium upgrades tied to global sporting events, and the Middle East prioritizes hospitality and government information projects linked to economic diversification.

Regulatory Landscape
Digital signage deployments are increasingly shaped by energy-efficiency and product-compliance regimes that apply to the display endpoint and, indirectly, to the always-on media player attached to it. In the European Union, Commission Regulation (EU) 2019/2021 sets Ecodesign requirements for electronic displays, including limits and measurement requirements for off, standby, and networked standby power modes, influencing how players are configured for sleep schedules and remote wake. The European Commission also opened a public consultation on 13 November 2024 to assess updates to Ecodesign and energy labelling rules for electronic displays, with feedback collected through February 2025, keeping efficiency and information-disclosure requirements in active review for signage fleets.
Comparable rules apply in the United Kingdom through the Ecodesign for Energy-Related Products and Energy Information (EU Exit) Regulations 2021 (SI 2021/745), which explicitly covers electronic displays used for digital signage and reinforces UKCA-oriented conformity needs for commercial deployments. In the United States, ENERGY STAR specifications for signage displays are used as a procurement and sustainability benchmark, which can affect player selection when buyers prioritize whole-system power profiles and networked standby behavior. Separately, security and data-handling obligations in regulated verticals (for example, HIPAA and FERPA environments) are pushing operators toward platform-level compliance controls that enforce content governance and device policy across distributed endpoints.
Competitive Landscape
The Digital Signage Media Player market exhibits moderate fragmentation as vertically integrated display giants vie with specialized software firms. Samsung blends commercial panels, VXT SaaS, and managed services, letting enterprises source an end-to-end stack from one vendor. The model bundles security certifications, API connectors, and lifecycle support, mitigating multi-vendor friction during global rollouts. LG counters by embedding BrightSignOS inside its latest UV5N displays, erasing the need for external players while preserving BrightSign’s developer ecosystem. These alliances illustrate a shift toward co-development where hardware form factor and software roadmap align at inception.
Independent player makers emphasize agility and platform neutrality. BrightSign introduces reference designs licensed to OEM partners, securing per-unit royalties without carrying panel inventory. Axiomtek stakes ground in ruggedized fanless models for factory floors and transport fleets, functions where major display vendors play less aggressively. Open-source CMS providers court systems integrators by offering white-label code, enabling regional resellers to build niche vertical templates quickly. This horizontal strategy nurtures long-tail adoption in emerging economies, expanding the overall Digital Signage Media Player market.
Analytics and AI now define competitive advantage. Vendors integrate Tensor cores or NPU accelerators directly on media boards, handing marketers real-time audience demographics. Cloud dashboards return proof-of-play data to ad exchanges, fueling programmatic digital-out-of-home budgets. Those unable to supply secure data pipelines risk relegation to commodity status. Consequently, mergers and acquisitions target code assets rather than hardware capacity, as seen in BroadSign’s purchase of Navori to widen its CMS portfolio and fortify its European footprint.
Digital Signage Media Player Industry Leaders
Advantech Co., Ltd.
3M Company
BrightSign, LLC
AOPEN, Inc.
Barco NV
- *Disclaimer: Major Players sorted in no particular order

Digital Signage Media Player Market Companies Covered in this Report
- Advantech Co., Ltd.
- AOPEN, Inc.
- BrightSign, LLC
- IAdea Corporation
- ONELAN Limited (Uniguest)
- Cisco Systems, Inc.
- Dell Technologies Inc.
- Hewlett-Packard Enterprise Company
- Barco NV
- Christie Digital Systems USA, Inc.
- 3M Company
- LG Electronics Inc.
- Samsung Electronics Co., Ltd.
- NEC Corporation (Sharp NEC Display Solutions Ltd.)
- Stratacache, Inc.
- Broadsign International, LLC
- Disguise Technologies Limited
- Dataton AB
- AV Stumpfl GmbH
- Green-Hippo Ltd. (tvONE)
- 7thSense Design Ltd.

Market Opportunities and Future Outlook
An identifiable white space is emerging around edge-AI capable players and software that reduces reliance on cloud processing while keeping deployments compliant with tightening privacy and security requirements. Retail and transportation operators are adopting on-device analytics to support real-time content triggers without streaming sensitive camera data, which aligns with buyer needs for secure boot, encryption, and auditability in regulated settings. On the platform layer, modular and headless approaches are gaining traction for multi-vendor fleets that need to avoid proprietary CMS lock-in, particularly as vendors sunset legacy stacks and require migrations on defined timelines.
Large public venue and transit projects continue to expand addressable installations where media players must integrate with complex content pipelines, safety constraints, and uptime requirements. Examples in 2026 include LG Electronics deploying large-scale LED installations at Frankfurt Airport Terminal 3, and CAYIN Technology supplying SMP-2200 media players for a major mall digital signage network in the Philippines (launched in March 2026), highlighting ongoing demand for higher-reliability playback, remote management, and integration with venue operations. At the same time, industry reporting in 2026 points to hardware cost volatility tied to memory and AI-compute demand, which increases the value of efficient SoC-based designs, lifecycle support, and fleet management tiers that help operators standardize configurations and reduce service visits across distributed networks.
Recent Industry Developments in Digital Signage Media Player Market
- June 2026: BrightSign announced BrightSign Control Plus, a premium tier of its device management offering, to increase visibility and centralized control across distributed signage networks. This expands BrightSign's software and services attach in a market where enterprises prioritize fleet uptime, configuration governance, and operational telemetry at scale.
- June 2025: BrightSign launched new AI toolkits at InfoComm 2025 to help customers build more customized digital signage experiences using on-device and workflow-level AI capabilities. This supports differentiation beyond commodity playback hardware by enabling integrators and brands to deploy interactive and data-driven content more consistently across fleets.
- June 2024: BrightSign introduced new solutions at InfoComm 2024 aimed at giving customers and partners more flexibility in how signage systems are deployed and managed. The updates reinforced momentum toward modular deployments and partner-led solution building, aligning with buyer demand for hardware-agnostic rollouts and easier lifecycle operations.


Digital Signage Media Player Market Report Scope and Research Methodology
Market Definition and Coverage
This market covers the revenue earned from digital signage media players that store, schedule, and play digital content on commercial displays, along with the related software that enables device control and content delivery across signage networks.
Scope exclusions: We exclude display panels, mounting hardware, installation labor, and non-signage consumer streaming boxes that are not bought for commercial digital signage use.
Segments Covered in This Report
- By Component
- Hardware
- Software
- By Product
- Entry-Level
- Advanced-Level
- Enterprise-Level
- By Connectivity
- Wired
- Wireless
- By Application
- Retail
- Hospitality
- Corporate
- Transportation
- Education
- Government
- By Geography
- North America
- United States
- Canada
- Mexico
- South America
- Brazil
- Argentina
- Rest of South America
- Europe
- Germany
- United Kingdom
- France
- Italy
- Spain
- Russia
- Rest of Europe
- Asia-Pacific
- China
- Japan
- India
- South Korea
- South-East Asia
- Rest of Asia-Pacific
- Middle East and Africa
- Middle East
- Saudi Arabia
- United Arab Emirates
- Turkey
- Rest of Middle East
- Africa
- South Africa
- Nigeria
- Rest of Africa
- Middle East
- North America
Data Sources, Market Sizing, and Validation
Desk Research
Desk work starts by mapping how media players are shipped, installed, and refreshed across signage deployments, then linking that to revenue in USD. For this, we refer to public sources such as US Census trade data, UN Comtrade, and national ICT statistics. We also review standards and guidance from bodies such as ISO and IEEE where it clarifies connectivity and device requirements.
To ground end market demand, we also use sources such as World Bank and IMF macro series, public procurement and tender portals, and a mix of company filings, investor presentations, and reputable press coverage that discuss signage rollouts and retrofit cycles. Paid subscriptions are used only for company financials and intelligence, patent databases, and shipment-level import or export reads where available. This helps validate assumptions on volumes and pricing movement. The sources listed here are illustrative, and other public documents were also used for data collection, validation, and clarification during the study.
Primary Interviews and Surveys
Primary inputs were collected through expert interviews and structured surveys with a mix of device ecosystem participants, channel-side respondents, and end user operations teams that manage signage networks. Because this is a global market, we covered demand signals across APAC, EMEA, and the Americas so pricing, replacement cycles, and adoption pace could be checked against different rollout patterns.
Distribution of primary research fieldwork respondents
| Company type | Respondent position | Region |
|---|---|---|
| Top tier: 38% | CXOs: 14% | APAC: 42% |
| Mid tier: 42% | Functional/Unit leaders: 36% | EMEA: 32% |
| Smaller Players: 20% | Managers: 50% | Americas: 26% |
Market-Sizing & Forecasting
Sizing is built using a top-down approach where the demand pool is reconstructed from digital signage network expansion and refresh activity, then translated into media player value using typical units per installation and prevailing average selling prices. To keep totals realistic, we corroborate outputs with selective bottom-up approximations, such as sample rollups of supplier revenues, channel checks on shipment volumes, and average selling price times volume calculations for commonly deployed device classes.
Inputs that matter in this market include installed base growth of digital signage endpoints, replacement and upgrade cycle timing, shifts from wired to wireless connectivity, the share of entry versus advanced and enterprise grade players in new deployments, and the direction of ASPs as higher performance requirements rise (for example, 4K playback and multi-zone content). Where gaps exist in bottom-up checks, they are handled through conservative ranges and then tightened using expert feedback and cross-checks against trade and procurement signals.
For forecasting, scenario analysis is used so the model reflects different rollout speeds by vertical, along with slower or faster refresh cycles during budget upturns or slowdowns. These scenarios are then anchored to a single base case after respondents confirm which adoption path matches near-term pipeline visibility.
Data Validation & Update Cycle
Validation is done through repeated cross-checks between the model and independent signals, followed by variance explanations that must be documented before final sign-off. When outputs look out of line, the assumptions that usually drive the swing, such as unit per site, ASP progression, and refresh cycles, are re-tested, and respondents may be re-contacted to confirm what changed.
A multi-step internal review is used so totals, growth rates, and regional splits tie back to the stated scope and the key input series. Reports are refreshed annually, with interim updates when a material change affects pricing, supply, or adoption. Before delivery, a final analyst pass is completed so the published view reflects the latest available information.
Mordor Intelligence's Digital Signage Media Player Market Size Versus Other Published Estimates
Published market sizes for digital signage media players can look far apart because the scope boundary is not consistent, and because pricing and unit assumptions get refreshed at different times. Differences also show up when one study treats software as included with players and another keeps it outside the market value.
Installed-base signals from signage endpoint rollouts, import and export patterns for small form factor computing devices, and channel feedback on replacement cycles are the checks that keep Mordor Intelligence aligned to the media player demand pool. This also explains why its 2026 value can land below broader definitions that fold in adjacent signage hardware or longer service bundles.
Benchmark comparison
| Source | Market Size | Gaps in Research Methodology |
|---|---|---|
| Mordor Intelligence | USD 2.32 B (2026) | |
| Global Research Publisher A | USD 3.74 B (2025) | Uses a digital signage market segmentation lens for hardware and can capture a wider set of player-like endpoints across deployments, with base year value shaped by its own ASP curve and device classification. |
| Industry Consultancy B | USD 4.50 B (2024) | Presents a broader global value that appears to blend adjacent signage stack items and a longer forecast window, which can lift the starting year through higher assumed attach and pricing levels. |
The spread in the table mostly comes from how tightly a study separates dedicated media players from neighboring signage hardware and bundled software value, and from how the starting year is priced and converted into USD. By keeping the model tied to observable deployment and refresh signals, then sanity-checking with practical volume and ASP ranges, our estimate stays traceable to repeatable steps that a buyer can audit.


Key Questions Answered in the Report
How big is the Digital Signage Media Player market in 2026?
The Digital Signage Media Player market size reached USD 2.32 billion in 2026 and is forecast to grow at a 8.94% CAGR to USD 3.56 billion by 2031.
Which region is growing fastest for digital signage media players?
Asia-Pacific is expanding at a 11.95% CAGR through 2031, outpacing all other regions due to extensive transport upgrades and smart-city investments.
What connectivity option dominates current deployments?
Wireless configurations account for 67.25% of installations and are advancing at an 11.48% CAGR as Wi-Fi 6 and 5G reduce cabling costs.
Which application segment is gaining share most quickly?
Transportation networks are the fastest-growing application, rising at an 11.09% CAGR as airports and rail operators modernize passenger information systems.
Why are enterprise-level media players attracting interest?
Enterprises prefer models that bundle AI processing, advanced security, and remote fleet management, pushing the enterprise tier to a 10.22% CAGR through 2031.
How are vendors addressing cybersecurity concerns?
Leading suppliers embed secure boot, TPM 2.0 chips, and regular over-the-air firmware updates to comply with zero-trust frameworks in regulated sectors.
Page last updated on:


 Your data is secure and never sold or shared.


