Market Overview
| Study Period | 2020 - 2031 |
|---|---|
| Forecast Data Period | 2026 - 2031 |
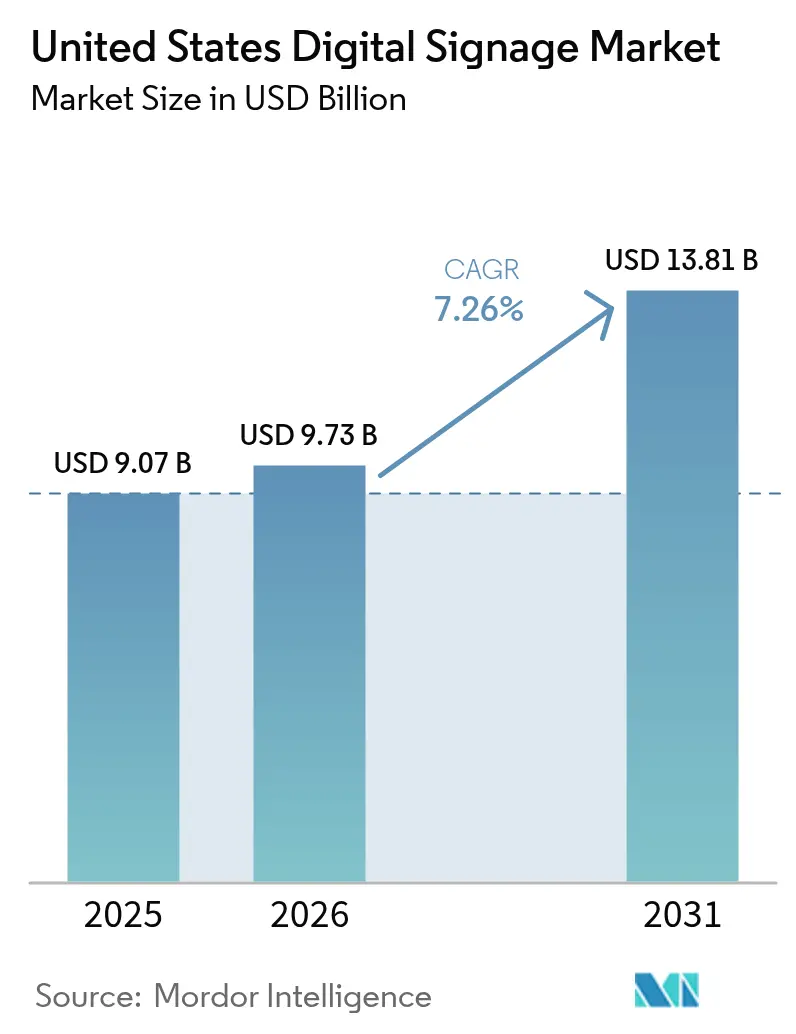
| Base Year Market Size (2025) | USD 9.07 Billion |
| Market Size (2026) | USD 9.73 Billion |
| Market Size (2031) | USD 13.81 Billion |
| Growth Rate (2026 - 2031) | 7.26% CAGR |
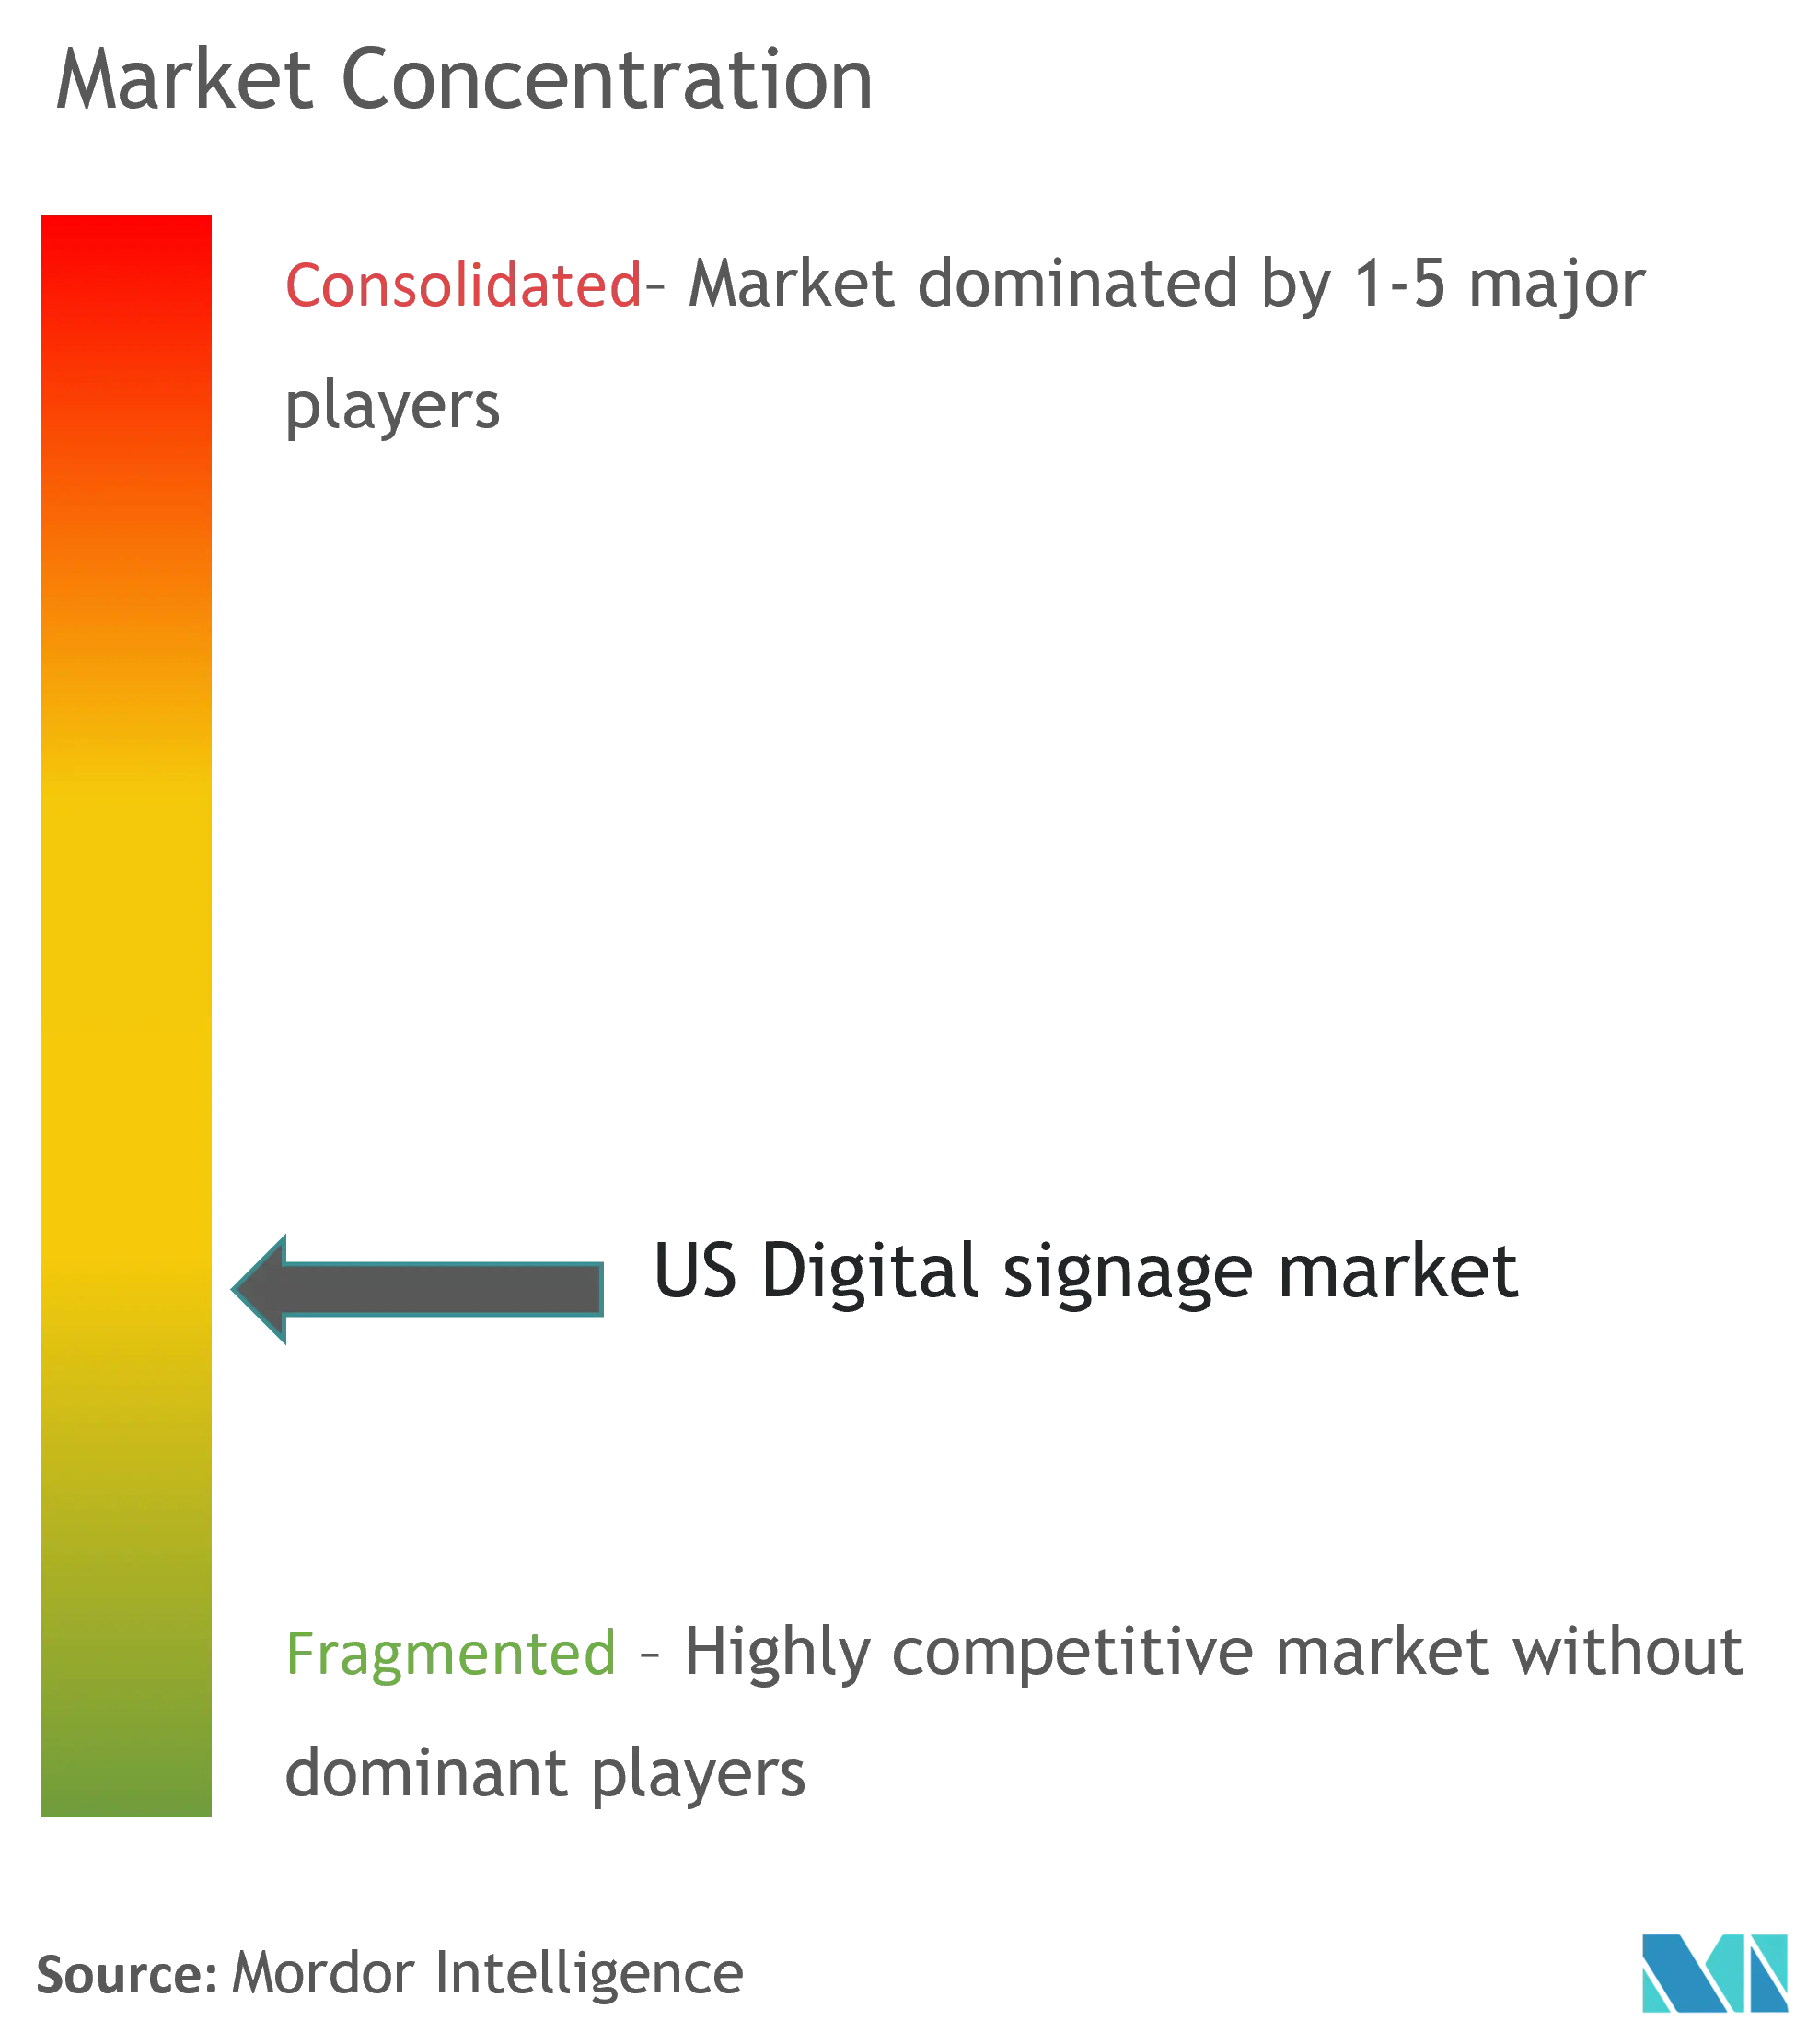
| Market Concentration | Medium |
Major Players *Disclaimer: Major Players sorted in no particular order Image © Mordor Intelligence. Reuse requires attribution under CC BY 4.0. | |
United States Digital Signage Market Analysis by Mordor Intelligence
The United States digital signage market size was valued at USD 9.07 billion in 2025 and estimated to grow from USD 9.73 billion in 2026 to reach USD 13.81 billion by 2031, at a CAGR of 7.26% during the forecast period (2026-2031). Rising programmatic buying of digital-out-of-home (DOOH) inventory, large-scale retail digital transformation, and the embedding of displays into smart-building platforms are the three structural growth engines behind the current expansion of the United States digital signage market. National DOOH ad spending is scaling in tandem with the broader out-of-home sector, which crossed USD 9 billion in total revenue in early 2025 and now derives roughly one-third of that revenue from digital formats. Hardware continues to dominate revenue, yet proof-of-performance analytics, subscription-based content management systems, and creative services are shifting profit pools toward recurring software and services lines. Energy-efficient OLED, high-brightness LCD, and reflective e-paper displays give end users a widening menu of technology choices, enabling more precise alignment with venue-specific visual, sustainability, and cost objectives
Key Report Takeaways
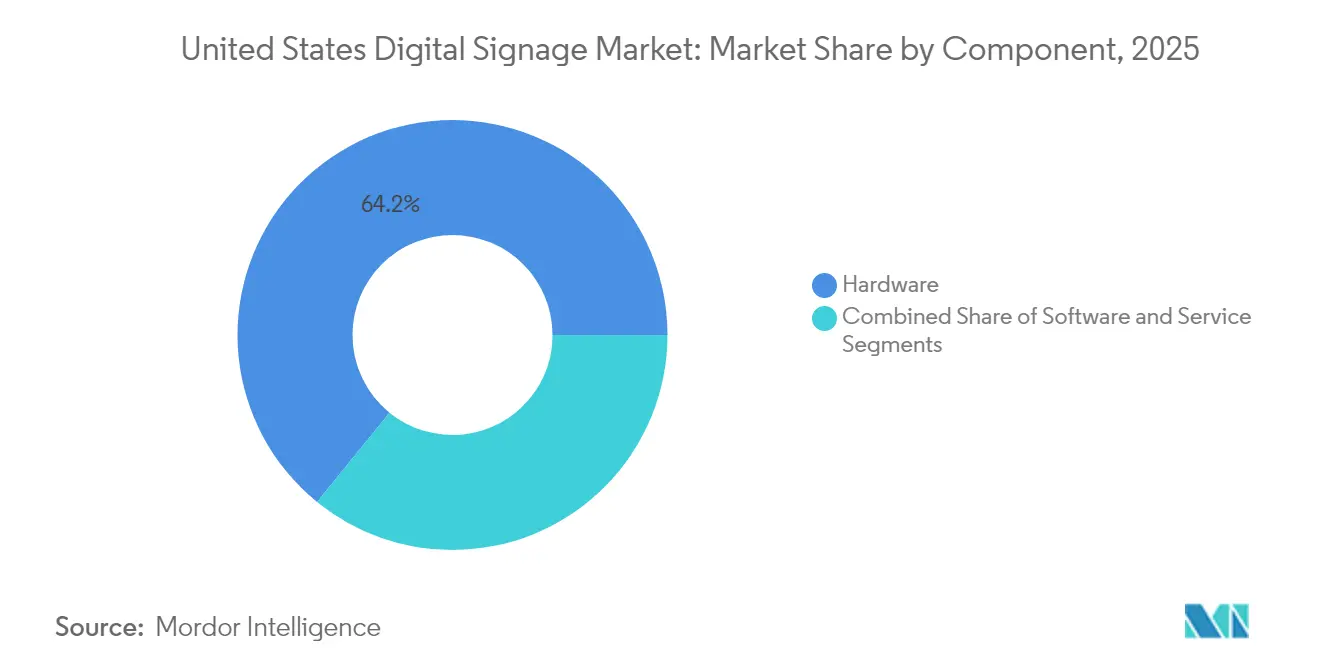
- By component, hardware held 64.15% of the United States digital signage market share in 2025, while services are forecast to expand at an 8.12% CAGR through 2031.
- By display technology, LCD/LED solutions captured 70.96% revenue share in 2025; OLED is the fastest-growing technology at a 9.74% CAGR to 2031.
- By screen size, 32-inch to 52-inch panels accounted for 48.05% of the United States digital signage market size in 2025; displays above 52-inch are advancing at a 10.28% CAGR.
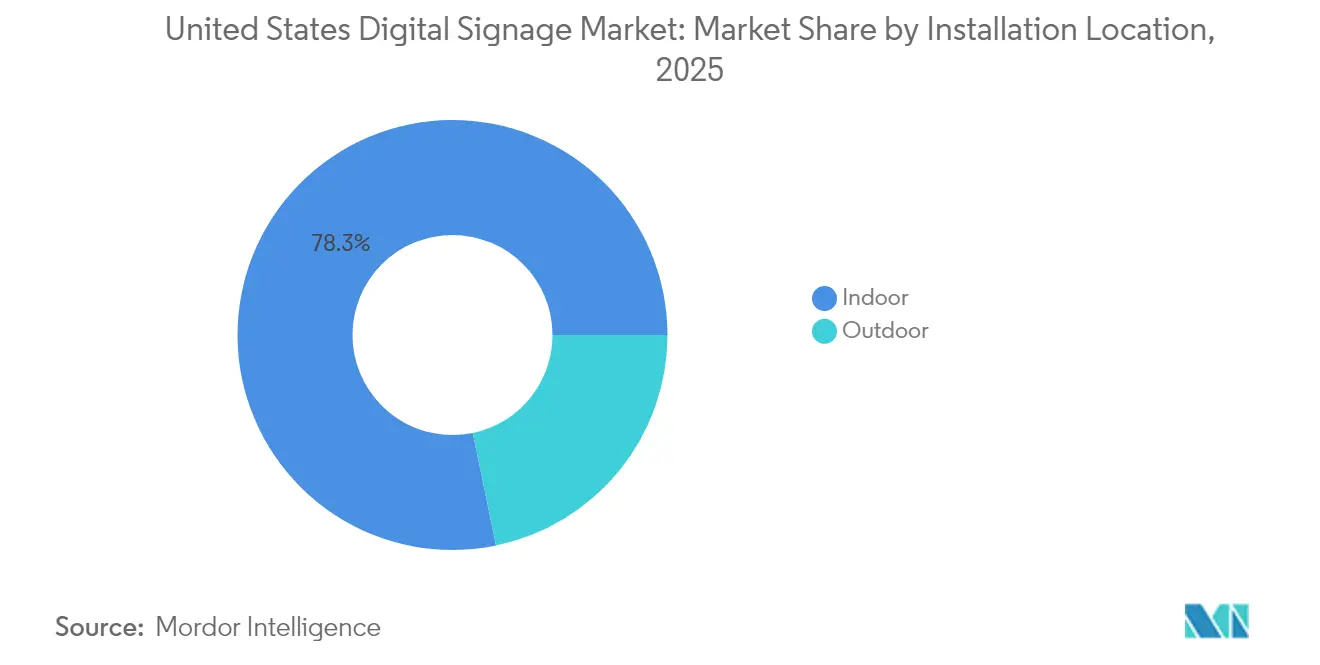
- By installation location, indoor deployments represented 78.25% of revenue in 2025, whereas outdoor installations are projected to rise at a 11.95% CAGR.
- By end user, retail commanded 28.15% of the United States digital signage market size in 2025, but healthcare is projected to lead growth with an 11.49% CAGR.
- By region, the South led with 34.05% revenue share in 2025; the West is set to grow the fastest at an 8.03% CAGR through 2031.
Note: Market size and forecast figures in this report are generated using Mordor Intelligence’s proprietary estimation framework, updated with the latest available data and insights as of 2026.
United States Digital Signage Market Trends and Insights
Drivers Impact Analysis*
| Driver | (~) % Impact on CAGR Forecast | Geographic Relevance | Impact Timeline |
|---|---|---|---|
| Surge in United States DOOH ad-spend | +2.1% | National, concentrated in major metropolitan areas | Medium term (2-4 years) |
| Retail digital-transformation mandates | +1.8% | National; early gains in South and West | Short term (≤ 2 years) |
| Turnkey signage-as-a-service offerings | +1.3% | National; SME uptake in Midwest and Northeast | Medium term (2-4 years) |
| Context-aware and programmatic advertising growth | +1.5% | Urban centers with spill-over to suburbs | Long term (≥ 4 years) |
| Smart-building integration with signage networks | +0.9% | Commercial districts in large cities | Long term (≥ 4 years) |
| Low-power e-paper and reflective displays | +0.7% | Government and education sites | Medium term (2-4 years) |
| Source: Mordor Intelligence | |||


Surge in United States DOOH Ad-Spend
DOOH programmatic exchanges now allow advertisers to trade impressions almost in real time, elevating measurability and attribution in ways previously unattainable in static outdoor media. More than three-quarters of surveyed consumers reported taking action after seeing a DOOH message, reinforcing advertiser confidence in the format.[1]Outdoor Advertising Association of America, “Out of Home Advertising Revenue Surpasses USD 9 Billion, Highest Revenue Volume to Date,” oaaa.org Telecommunications operators have entered the space through high-profile acquisitions, a signal that nationwide fiber and 5G networks can be monetized through advertising as well as connectivity. AI-generated creative iterations cut campaign setup times and allow content to adjust to local weather, traffic, or audience demographics, which further boosts return on ad spend. Because the same data layers power connected-TV buying, cross-screen frequency and reach management are becoming routine, solidifying DOOH as a critical pillar in omnichannel marketing.
Retail Digital-Transformation Mandates
Brick-and-mortar still captures the majority of U.S. shopping activity, prompting chains to embed displays into aisles, shelves, and checkout zones to encourage incremental purchases and to synchronize with e-commerce promotions. Retailers are re-architecting stores so that inventory, customer-relationship tools, and visual messaging all draw from a shared real-time data lake. Digital menu boards in quick-service restaurants, endless-aisle kiosks in big-box stores, and electronic shelf labels in grocery stores are visible manifestations of the same imperative: curate, inform, and transact in context. Early deployments in the South and West demonstrate revenue uplifts on promoted SKUs, which are accelerating budget approvals for rollouts across other regions.
Turnkey Signage-as-a-Service Offerings
Enterprise buyers are pivoting away from one-off display purchases toward bundled hardware, software, content, and analytics that are delivered as monthly operating expenses. Vendors advertise guaranteed uptime and centralized remote management, reducing the strain on lean IT teams inside mid-market companies. Recurring revenue has also become an attractive hedge for display manufacturers facing panel price volatility; consequently, most tier-one OEMs now maintain or partner with cloud CMS platforms and field services. Smart analytics modules that quantify dwell time, demographic mix, and conversion rates create a continuous feedback loop, giving CFOs concrete ROI metrics that justify renewals.
Context-Aware and Programmatic Advertising Growth
Sensor arrays and data feeds now inform real-time creative decisions on weather, traffic congestion, or social media trends, moving campaigns from merely dynamic to genuinely context-aware. Self-service DOOH demand-side platforms mirror the workflow of display or video ad buying, which lowers the operational barrier for small brands entering the United States digital signage market. Cross-device retargeting-linking a roadside impression to a subsequent mobile ad-creates coherent brand stories and measurable paths to purchase. As addressable inventory expands, publishers are investing in verification tools that confirm viewability standards similar to online channels, which further normalizes DOOH within digital media budgets.
Restraints Impact Analysis*
| Restraint | (~) % Impact on CAGR Forecast | Geographic Relevance | Impact Timeline |
|---|---|---|---|
| Data-privacy and opt-in compliance hurdles | -0.8% | Stricter enforcement in California and Northeast | Short term (≤ 2 years) |
| High capex for large-format and interactive displays | -1.2% | Nationwide; sharper effect on SMEs | Medium term (2-4 years) |
| Municipal brightness and motion regulations | -0.6% | Select cities (e.g., Philadelphia, San Francisco) | Medium term (2-4 years) |
| Supply-chain volatility in semiconductor components | -0.5% | National | Short term (≤ 2 years) |
| Source: Mordor Intelligence | |||
Data-Privacy and Opt-In Compliance Hurdles
Multiple states have enacted statutes that parallel the California Consumer Privacy Act, compelling venue operators to obtain explicit consent before capturing or processing biometric and behavioral data. Municipal codes now regulate display luminance - for instance, Philadelphia limits maximum brightness to 6,500 nits by day and 450 nits at night while mandating automated dimming controls.[2]City of Philadelphia, “Digital Signs,” codelibrary.amlegal.com Such requirements force integrators to embed secure data pipelines, audit logs, and privacy-by-design principles, adding both engineering and legal costs. National advertisers must subsequently tailor campaigns for a patchwork of local standards, dampening scale economies.
High Capex for Large-Format/Interactive Displays
Interactive video walls, gesture-based exhibits, and ultra-large single panels can cost multiples of standard signage installations once structural reinforcements, dedicated cooling, and redundant power are included. Capital-constrained small and medium enterprises often defer these projects or opt for smaller, non-interactive alternatives, slowing penetration in certain verticals. Rapid product cycles mean that displays become technically obsolete well before the end of mechanical life, compounding investment risk. Energy usage can exceed sustainability targets in jurisdictions with stringent carbon requirements, thereby adding long-term operating expense to an already elevated initial outlay.
*Our forecasts treat driver/restraint impacts as directional, not additive. The impact forecasts reflect baseline growth, mix effects, and variable interactions.
Segment Analysis
By Component: Services Drive Profitability Shift
The hardware segment accounts for 64.15% of the revenue market share. Services revenue is forecast to grow at an 8.12% CAGR, reshaping value capture inside the United States digital signage market. Although hardware generated almost two-thirds of 2025 revenue, buyers increasingly favor cloud-based content management, network monitoring, and analytics that convert one-time capital expense into predictable operating expense. Many manufacturers, therefore, bundle displays, media players, and field maintenance under multi-year subscriptions. National chain rollouts illustrate that services lower the total cost of ownership by eliminating ad-hoc truck rolls and by automating content updates across thousands of screens.
Managed services also encompass creative development, data integration, and campaign optimization. These capabilities appeal to retailers, healthcare providers, and municipalities lacking in-house design or IT resources yet seeking to maximize engagement. With AI tools detecting traffic patterns and demographics, service partners can deploy context-specific playlists that improve campaign relevance. Continued migration toward services is expected to nudge the United States digital signage market toward higher gross margin profiles, reinforcing consolidation among firms able to fund nationwide support networks.


By Display Technology: OLED Premium Positioning
LCD and direct-view LED continue to account for 70.96% of revenue, yet OLED’s 9.74% CAGR underscores a discernible shift toward premium visual performance. Retail flagships, corporate lobbies, and high-end hospitality venues cite OLED’s near-infinite contrast and ultra-wide viewing angles as brand differentiation levers. Several Fortune 500 campuses in the West region have migrated entrance lobby video walls from LED to tiled OLED canvases, evidencing wallet share gains.
OLED’s energy efficiency also dovetails with corporate sustainability programs, a factor that carries weight in jurisdictions employing emissions reporting. Flexible substrates allow architects to curve displays around pillars or create ceiling-mounted ribbons, unlocking design possibilities unattainable with rigid LCD. Projection remains a niche for auditoriums, while e-paper addresses sun-facing or battery-powered assets. Continued cost declines in OLED manufacturing are anticipated to expand addressable applications, giving the technology a growing footprint within the United States digital signage market.
By Screen Size: Large-Format Immersion Trend
Panels above 52 inches are projected to grow at a 10.28% CAGR as venue operators chase immersive storytelling. One airport digital concourse upgrade replaced eight 46-inch screens with six 75-inch units, reducing bezels by 60% and elevating dwell-time metrics. Integrators report that the per-square-inch cost of 65-inch commercial panels has fallen below USD 20, enhancing ROI models for large wall placements.
Conversely, the 32"-52" category retains 48.05% of the United States digital signage market share because it balances visibility with installation flexibility. Checkout lanes, meeting rooms, and transit shelters typically favor this mid-range bracket due to spatial constraints. Sub-32-inch screens fulfill niche requirements like shelf-edge messaging and infotainment inside rideshare vehicles, where proximity renders larger sizes impractical.
By Installation Location: Outdoor Growth Acceleration
Indoor environments generated 78.25% of 2025 revenue, yet outdoor deployments are on track for a 11.95% CAGR as infrastructure legislation channels federal dollars into transit and municipal communications projects. Philadelphia International Airport’s plan to triple its 1,500-screen network exemplifies large-scale outdoor upgrades funded through the Infrastructure Investment and Jobs Act. High-brightness, IP-rated enclosures command premium prices but also enable venue owners to monetize foot or vehicle traffic via programmatic ad exchanges.
Indoor installations remain essential in retail aisles, healthcare corridors, and corporate campuses. Here, lower environmental stress widens the technology palette to include OLED and fine-pitch LED. Growing demand for hybrid work communications and real-time occupancy dashboards further anchors indoor volume.
By End User: Healthcare Transformation Leadership
Retail sustained a 28.15% revenue share in 2025, yet healthcare’s 11.49% CAGR points to structural demand tied to patient-centric facility design. Wayfinding kiosks in hospital lobbies cut average staff inquiries by double-digit percentages, while waiting-room infotainment screens improve perceived wait times. HIPAA-compliant content workflows and antimicrobial coating options strengthen the value proposition for specialized healthcare integrators. Transportation hubs leverage displays for operational alerts, gate changes, and real-time advertising inventory, while banks employ signage to expedite queue management and upsell financial products. Government agencies continue rolling out e-paper noticeboards in court buildings and DMV offices, citing readability and energy savings. Entertainment venues deploy ultra-large LED canvases to amplify live events and to open new sponsorship revenue streams.
United States Digital Signage Market Geography Analysis
The South held 34.7% of 2024 revenue for the United States digital signage market, propelled by rapid retail build-outs, airport expansions in Atlanta and Dallas, and pro-business tax regimes that entice corporate headquarters relocations. Large quick-service restaurant chains headquartered in the region serve as anchor customers for drive-thru menu boards and curbside pickup screens. Real-estate developers in Miami are integrating displays into mixed-use projects, creating media facades that double as architectural elements and revenue sources.
The West, growing at 8.1% CAGR, embodies the convergence of technology innovation and sustainability mandates. Silicon Valley offices specify IoT-connected signage that links to smart-building dashboards, while entertainment studios in Los Angeles commission immersive LED volumes for both visitor experiences and virtual production. California’s energy codes favor OLED and reflective display technologies, nudging buyers toward high-efficiency options that support state climate goals.
The Northeast and Midwest post steady, albeit slower, growth trajectories. The Northeast’s dense transit infrastructure provides stable demand for real-time passenger information displays and DOOH ad inventory in subway systems. Banks in New York deploy compliance-driven messaging to satisfy regulatory disclosure rules. In the Midwest, healthcare networks and university campuses are aggregating procurement across multiple facilities to standardize hardware and service contracts, thereby capturing volume discounts without compromising feature sets.
Competitive Landscape
The marketplace remains moderately fragmented, with the top five vendors accounting for just over half of shipments. Samsung, LG, Sharp NEC head the hardware tier, each bundling proprietary CMS software and analytics to anchor customer relationships. Tier-one integrators now pitch “network-in-a-box” packages- commercial displays, media players, mounting systems, and managed content- for one monthly fee, responding to the service-led pivot inside the United States digital signage market.
Software-centric challengers leverage cloud-native architectures and AI content engines that optimize playlists against real-time audience sensing data. These firms typically partner with OEMs for white-label media players, allowing them to focus R&D budgets on machine learning and campaign measurement dashboards. Consolidation is underway: telecommunications carriers see displays as edge compute and advertising real estate, evidenced by high-value acquisitions that fold ad-tech stacks into national fiber networks.
Technical standardization efforts such as HDBaseT 3.0 ensure that 4K video, USB, and power can traverse a single cable for up to 100 meters, reducing installation complexity and broadening use cases.[4]Sharp NEC Display Solutions of America, “HDBaseT 3.0 to Large Displays, Projectors, Video Walls,” news.sharpusa.com Manufacturers that certify early on HDBaseT or similar protocols gain a competitive edge among enterprise buyers seeking long-term interoperability. Niche specialists retain pricing power in verticals that demand certifications- HIPAA for healthcare, PCI-DSS for banking, or MIL-STD shock ratings for defense facilities- thereby keeping the competitive field dynamic despite hardware commoditization.
United States Digital Signage Industry Leaders
Samsung Electronics Co. Ltd.
Panasonic Corporation
Sony Corporation
Cisco System, Inc.
NEC Corporation
- *Disclaimer: Major Players sorted in no particular order

Recent Industry Developments
- April 2025: Philadelphia International Airport expanded its network to about 1,500 digital displays and announced plans to triple that count, funded through Infrastructure Investment and Jobs Act allocations.
- March 2025: The Outdoor Advertising Association of America reported that total U.S. out-of-home revenue exceeded USD 9 billion for the first time, underscoring sustained demand for DOOH activations.
- December 2024: Solomon Partners, affiliate of Natixis, part of Groupe BPCE, projected a 6%–8.5% global CAGR for digital signage through 2033, spotlighting AV-as-a-Service momentum and leaner manufacturing carbon footprints.
- June 2024: Samsung and LG unveiled end-to-end signage subscriptions that bundle displays, CMS software, and AI analytics to drive recurring revenue.


Research Methodology Framework and Report Scope
Market Definitions and Key Coverage
Our study defines the United States digital signage market as all professionally installed networked display systems, LCD, LED, OLED, projection, and e-paper, plus the software and services that schedule, deliver, and analyze content across retail, transit, corporate, education, healthcare, hospitality, government, and entertainment venues.
Scope Exclusion: Standalone consumer televisions pressed into ad-hoc advertising or menu board use are not counted.
Segmentation Overview
- By Component
- Hardware
- LCD/LED Displays
- OLED Displays
- Media Players
- Projection Screens and Projectors
- Other Hardware
- Software
- Services
- Hardware
- By Display Technology
- LCD/LED
- OLED
- Projection
- e-Paper and Reflective
- By Screen Size
- Less than 32-inch
- 32-inch to 52-inch
- Greater than 52-inch
- By Installation Location
- Indoor
- Outdoor
- By End User
- Retail
- Transportation
- Hospitality and QSR
- BFSI
- Education
- Government and Public Institutions
- Healthcare
- Corporate and Commercial Offices
- Entertainment and Sports Venues
- By Geography
- Northeast
- Midwest
- South
- West
Detailed Research Methodology and Data Validation
Primary Research
Our team interviewed display OEM product managers, CMS software executives, systems integrators, and media-owner networks across the Northeast, Midwest, South, and West. These conversations validated usage intensity, service attach rates, and upcoming procurement budgets, which desk research alone could not reveal.
Desk Research
Mordor analysts began with public datasets such as the US Census Bureau's Annual Retail Trade Survey, Bureau of Labor Statistics' establishment counts, Federal Communications Commission filings on public display power regulations, and import values for flat-panel modules from the US International Trade Commission. Trade bodies, including the Digital Signage Federation and the Out-of-Home Advertising Association of America, provided shipment ranges and DOOH spend. Company 10-Ks, investor decks, and press releases deepened insight into display average selling prices and replacement cycles, while D&B Hoovers and Dow Jones Factiva filled financial and news gaps. This list is illustrative; many additional open and paid sources were consulted for cross-checks and clarification.
Market-Sizing & Forecasting
The baseline value is produced through a top-down model that reconstructs annual U.S. demand from installed-base estimates, screen replacement intervals, and DOOH advertising outlays, followed by selective bottom-up roll-ups of major vendor billings to align totals. Key variables include: 1) commercial flat-panel import volume, 2) weighted ASP trends for 32- to 55-inch displays, 3) retail floor space growth, 4) DOOH media spend shifts, and 5) hospital bed additions that drive way-finding installs. A multivariate ARIMA forecast, stress-tested by scenario analysis supplied by interviewed experts, projects figures through 2030; gaps in supplier data are bridged using channel-check averages and conservative interpolation.
Data Validation & Update Cycle
Outputs pass a three-layer review where analysts test variance against historical ratios, flag outliers for re-interview, and secure lead-analyst sign-off. The model refreshes annually, with interim revisions triggered by material events such as tariff changes or large federal infrastructure grants.
Why Mordor's US Digital Signage Baseline Stands Firm
Published estimates often diverge because firms pick different component mixes, end-use boundaries, and year bases.
Key gap drivers here stem from whether services revenue is included, how aggressively rising OLED ASP declines are assumed, and the cadence at which models are refreshed. Mordor reports current-year values and folds in software and managed-service revenue, whereas some publishers strip these out or use older currency conversions, creating visible spreads.
Benchmark comparison
| Market Size | Anonymized source | Primary gap driver |
|---|---|---|
| USD 9.07 B (2025) | Mordor Intelligence | - |
| USD 6.36 B (2024) | Regional Consultancy A | Excludes software and service revenue; relies on 2023 ASPs without currency update |
| USD 5.70 B (2023) | Trade Journal B | Narrow vertical scope, omits transit and corporate campuses |
| USD 3.30 B (2024) | Industry Association C | Hardware-only count, sample of kiosk vendors extrapolated nationwide |
Taken together, the comparison shows that when scope breadth, refreshed price decks, and transparent triangulation are applied, Mordor's figure offers decision-makers the most balanced and reproducible baseline.


Key Questions Answered in the Report
What is the current size of the United States digital signage market?
The United States digital signage market stands at USD 9.73 billion in 2026 and is on track to reach USD 13.81 billion by 2031.
Which component segment is growing the fastest?
Services, encompassing installation, content management, and analytics, are forecast to expand at an 8.12% CAGR through 2031 as enterprises favor subscription models.
Why are OLED displays gaining momentum?
OLED offers superior contrast, wide viewing angles, and energy efficiency, leading to a 9.74% CAGR as premium venues prioritize visual impact and sustainability.
How significant are outdoor installations compared with indoor deployments?
Indoor sites still account for 78.25% of 2025 revenue, but outdoor screens are rising rapidly at a 11.95% CAGR due to infrastructure funding and programmatic ad demand.
Which region is expanding the quickest?
The West is the fastest-growing region, advancing at an 8.03% CAGR on the back of technology sector concentration, sustainability mandates, and venture-backed innovation.
What is the biggest restraint to market growth?
High capital expenditure for large-format and interactive displays remains the chief brake on wider adoption, especially among cost-sensitive SMEs, trimming projected CAGR by an estimated 1.2%.
Page last updated on:


