In-dash Navigation System Market Size and Share
Market Overview
| Study Period | 2020 - 2031 |
|---|---|
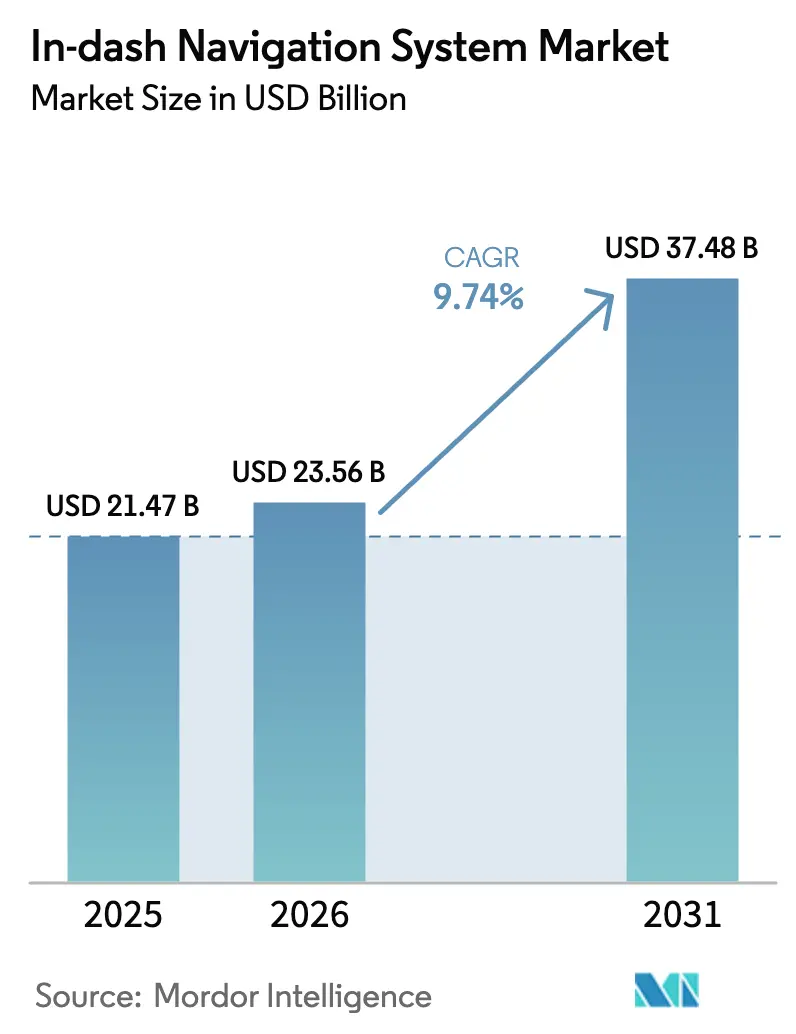
| Market Size (2026) | USD 23.56 Billion |
| Market Size (2031) | USD 37.48 Billion |
| Growth Rate (2026 - 2031) | 9.74% CAGR |
| Fastest Growing Market | Asia Pacific |
| Largest Market | North America |
| Market Concentration | Medium |
Major Players *Disclaimer: Major Players sorted in no particular order Image © Mordor Intelligence. Reuse requires attribution under CC BY 4.0. | |
In-dash Navigation System Market Analysis by Mordor Intelligence
The in-dash navigation system market size is expected to grow from USD 21.47 billion in 2025 to USD 23.56 billion in 2026 and is forecast to reach USD 37.48 billion by 2031 at 9.74% CAGR over 2026-2031. Strong demand for connected driving experiences, safety-oriented features, and regulatory pushes for embedded emergency-call capability are the most powerful tailwinds. Automakers continue to embed high-definition mapping and augmented reality guidance, while electric-vehicle (EV) penetration raises the bar for route-planning accuracy, range management, and charging-station visibility. Strategic alliances between hardware suppliers and software specialists shorten innovation cycles and reinforce ecosystem play, ensuring continuous feature roll-outs through over-the-air (OTA) updates. Smart cockpit designs with large, curved OLED displays also fuel upgrade cycles, particularly in premium and EV segments where buyers prioritize immersive infotainment.
Key Report Takeaways
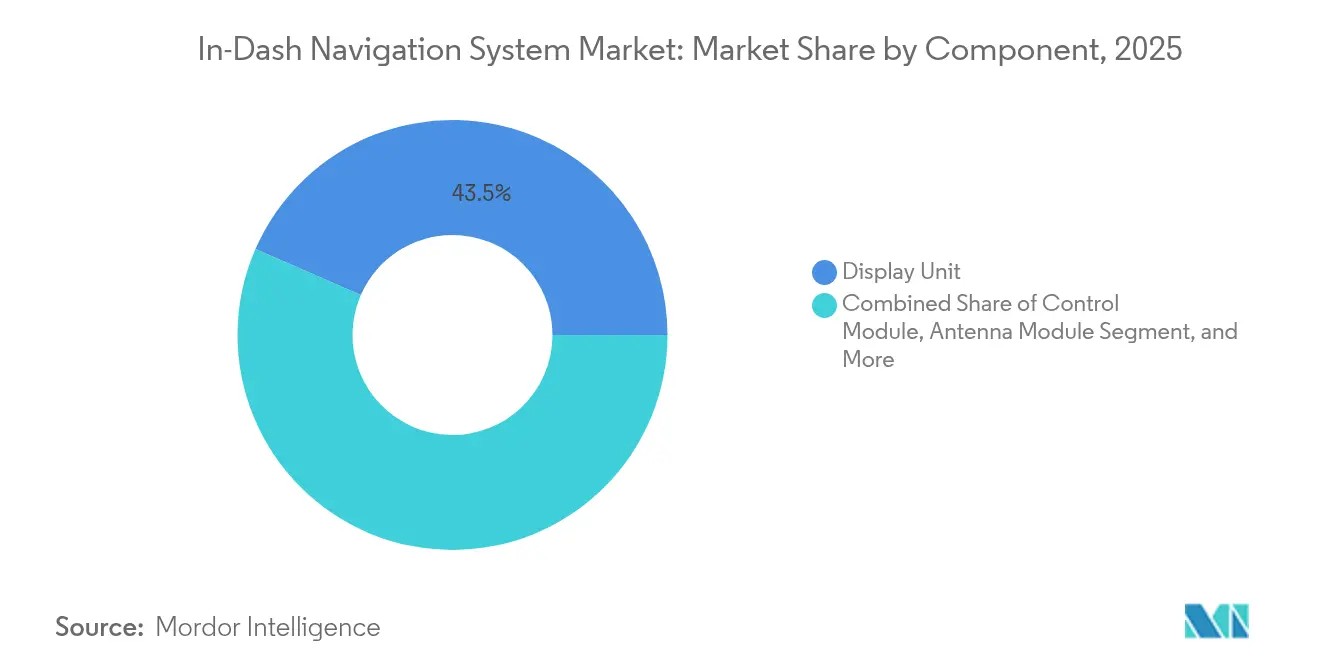
- By component, display units led with a 43.45% revenue share of the in-dash navigation system market in 2025; software and services are set to grow at an 11.43% CAGR through 2031.
- By technology, 3-D maps accounted for 56.62% of the in-dash navigation system market share in 2025, while augmented reality navigation is projected to expand at a 12.95% CAGR to 2031.
- By connectivity, embedded solutions commanded 62.15% of the in-dash navigation system market size in 2025, whereas integrated/smartphone solutions are advancing at a 12.21% CAGR between 2026-2031.
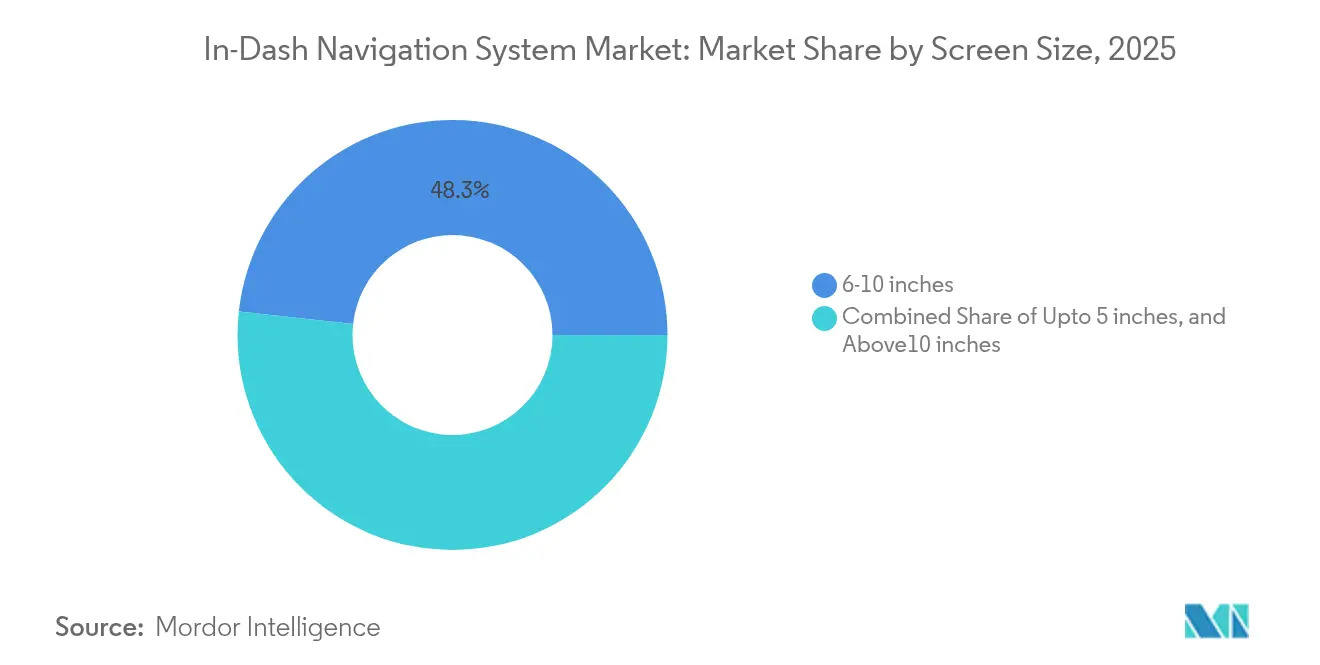
- By screen size, the 6-10 inch category held 48.25% of the in-dash navigation system market size in 2025, and screens larger than 10 inches are rising at a 10.59% CAGR over the same horizon.
- By sales channel, OEM-fitted units represented 70.88% of the in-dash navigation system market in 2025, but the aftermarket is forecast to accelerate at a 13.82% CAGR through 2031.
- By vehicle type, passenger cars occupied 80.35% of the in-dash navigation system market in 2025; electric vehicles are the fastest-growing sub-segment at a 13.52% CAGR.
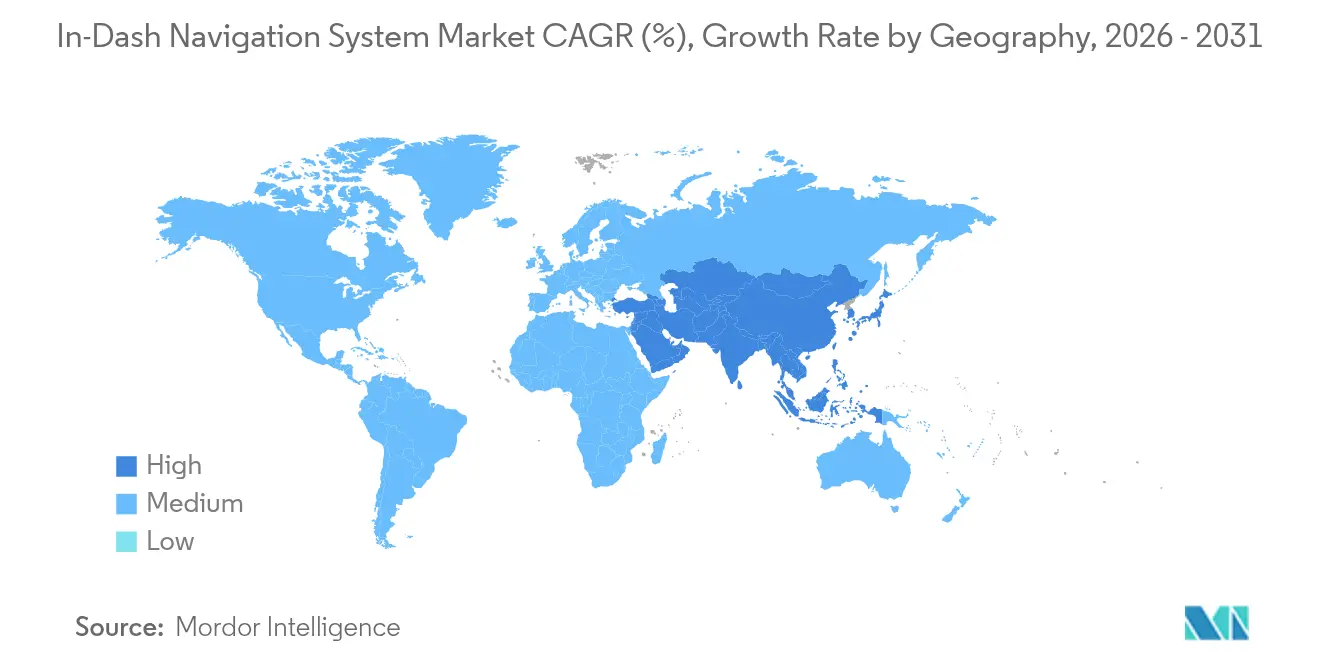
- By geography, Asia Pacific led with a 34.05% revenue share in 2025, while the Middle East and Africa region is projected to grow at a 10.03% CAGR from 2026-2031.
Note: Market size and forecast figures in this report are generated using Mordor Intelligence’s proprietary estimation framework, updated with the latest available data and insights as of 2026.
Global In-dash Navigation System Market Trends and Insights
Drivers Impact Analysis*
| Driver | (~) % Impact on CAGR Forecast | Geographic Relevance | Impact Timeline |
|---|---|---|---|
| OTA-updated HD maps for Level-3 ADAS | +1.5% | Europe, North America, premium APAC | Medium term (2-4 years) |
| Mandated embedded eCall units | +1.8% | North America, EU | Short term (≤ 2 years) |
| Large-format displays in Chinese EVs | +1.4% | China, global EV spillover | Short term (≤ 2 years) |
| Automaker-tech firm 3-D mapping alliances | +1.2% | Global tech hubs | Medium term (2-4 years) |
| LBS subscription revenue for OEMs | +1.0% | North America, Europe, developed APAC | Long term (≥ 4 years) |
| V2X-enabled predictive navigation | +0.8% | South Korea, Japan, parts of EU & NA | Long term (≥ 4 years) |
| Source: Mordor Intelligence | |||
OTA-updated HD Maps for Level-3 ADAS
European regulators now recognise Level-3 autonomy, spurring OEM expenditure on OTA-capable mapping backbones. BMW cut map-update cycles from quarterly to weekly across 2025 models, sharpening lane-level guidance and ADAS hand-off accuracy.[1]BMW, “BMW Group Innovation – Connectivity Technologies,” bmwgroup.comMercedes-Benz complements the approach with AR overlays that project arrows and speed prompts directly onto camera imagery.[2]Mercedes-Benz, “Drive Pilot Autonomous System,” mercedes-benz.comSimilar functionality appears in North American flagships, anchoring premium-segment price points.
Regulatory Mandates for Embedded eCall Navigation Units
North American and European lawmakers require new vehicles to transmit crash coordinates automatically, pushing OEMs toward embedded navigation hardware immune to smartphone unavailability. Suppliers note double-digit contract growth tied directly to eCall compliance, and historical EU data showing 40% faster emergency response strengthens the safety case. The mandate lifts baseline specification, ensuring even mid-tier trims integrate precise positioning and secure data channels rather than relying on mirrored mobile apps.. Continental AG reported a 35% surge in OEM purchase orders explicitly citing eCall compliance.[3]Continental, “Emergency Call (eCall) Systems,” continental-automotive.com
Demand for Large-format Displays in Chinese EVs
Chinese EV makers popularized 12-inch-plus “digital canvases” that display simultaneous navigation, battery status, and infotainment widgets without clutter. Research presented at industry forums demonstrates up to 23% lower glance frequency versus smaller screens. Global brands replicate the template in upcoming EV launches, locking in demand for high-resolution graphical cores and adaptive UI software that scales across multiple panel sizes while maintaining low distraction metrics.
Automaker–Tech Firm 3-D Mapping Alliances
Joint ventures between tier-one suppliers and mapping specialists compress development by 40%, according to Harman International.[4]Harman, “Harman News,” news.harman.comTomTom and Bosch pool sensor feeds and satellite imagery to deliver lane-level HD maps for automated driving. Shared toolchains let OEMs overlay brand-specific UX layers while tapping common back-end data.
Restraints Impact Analysis*
| Restraint | (~) % Impact on CAGR Forecast | Geographic Relevance | Impact Timeline |
|---|---|---|---|
| Smartphone mirroring eroding mid-segment adoption | -1.1% | Global, price-sensitive markets | Short term (≤ 2 years) |
| Automotive-grade GPU shortages inflating BOM | -0.9% | Global, mass-market OEMs | Short term (≤ 2 years) |
| GDPR & CCPA limiting granular data use | -0.7% | EU, California, global spillover | Medium term (2-4 years) |
| High map-data subscription cost in emerging regions | -0.6% | Latin America, Africa, South Asia | Medium term (2-4 years) |
| Source: Mordor Intelligence | |||
Smartphone Mirroring Cannibalizing Mid-segment Demand
Apple CarPlay and Android Auto adoption now tops 80% of late-model vehicles, giving buyers real-time maps at minimal incremental cost.[5]SAE, “Smartphone Mirroring Technologies in Vehicles,” sae.org New iterations extend mirrored apps into instrument clusters, closing gaps once exclusive to embedded systems. The trend suppresses demand in cost-sensitive trims, though premium buyers still value bespoke AR overlays, deeper ADAS integration, and guaranteed SOS connectivity that phone-based apps cannot deliver reliably.
Automotive-grade GPU Shortages Inflating BOM
Semiconductor fabs prioritize high-volume consumer electronics, leaving automotive-qualified GPU supply thin. Tier-one suppliers report 15-20% component price jumps since 2023, forcing some mass-market models to delay 3-D map rollout or revert to simpler display specs. Premium vehicles absorb surcharges or shift to multi-vendor sourcing, yet persistent shortages risk throttling advanced navigation penetration until additional automotive-grade capacity comes onlin
*Our forecasts treat driver/restraint impacts as directional, not additive. The impact forecasts reflect baseline growth, mix effects, and variable interactions.
Segment Analysis
By Component: Shift Toward Service-centric Monetization
Display units held 43.45% of the in-dash navigation system market in 2025, benefiting from the migration to OLED and QLED panels that boost brightness and support multi-touch. Large curved displays, including the 12.3-inch unit in a 2025 crossover, anchor premium interiors and justify higher sticker prices. The in-dash navigation system market size attached to software and services is widening fastest, tracking an 11.43% CAGR to 2031 as OEMs pivot toward cloud-delivered features whose recurring fees outlast the hardware sale.
Control modules preserve a notable share by orchestrating compute-intensive tasks such as AR rendering, simultaneous sensor fusion, and secure data transport. Antenna assemblies evolve to manage multi-band 5G, V2X, and satellite reception in a compact enclosure, while wiring harnesses shift to high-speed Ethernet frameworks to carry uncompressed video from cameras to screen. Service bundles-real-time traffic, point-of-interest curation, and predictive routing-turn once-static navigation into a living platform that updates continuously, reinforcing long-term customer engagement.


By Technology: Immersive Guidance Gains Momentum
Three-dimensional cartography dominated the landscape with 56.62% market share in 2025, offering elevation cues and landmark textures that simplify navigation in urban canyons. Yet augmented reality promises deeper immersion, recording a 12.95% CAGR as camera feeds merge with digital arrows, lane highlights, and hazard callouts. The in-dash navigation system market benefits from automakers fitting head-up displays that span windshields, pushing guidance into the driver’s natural line of sight.
Camera cost declines, GPU advances, and maturing AR toolkits shorten deployment cycles. Meanwhile, traditional 2-D map layers serve entry models and geographies lacking telematics coverage, though their share erodes steadily. Overall, technology progression mirrors the automotive move toward user-centric design, where guidance steps blend seamlessly with real-world context to minimize mental load.
By Connectivity: Reliability Versus Flexibility
Embedded architectures claimed 62.15% share in 2025, prized for independence from handset signal, guaranteed SOS readiness, and tight linkages to in-vehicle networks. Regulatory eCall mandates further cement their role. The integrated/smartphone cohort, however, is the quickest climber, tracking a 12.21% CAGR as consumers gravitate toward familiar apps and short upgrade cycles. Enhanced mirroring protocols now route audio, video, and contextual data to multiple displays, narrowing experiential gaps.
Tethered modes-where a head unit borrows a phone’s connection but retains dedicated compute-occupy a middle path, balancing cost with decent autonomy. Yet for safety-critical workflows or coverage-challenged routes, embedded remains the default. OEMs often pursue hybrid designs, reserving embedded pipes for regulated or subscription features while letting phones deliver ancillary content.
By Screen Size: Bigger Surfaces, Richer Context
Panels between 6-10 inches captured 48.25% of shipments in 2025, aligning with dashboard ergonomics and production economics. The >10 inch segment grows fastest at 10.59% CAGR, buoyed by EV interiors that replace analog clusters with cinematic canvases. Large displays showcase simultaneous navigation, climate, and media panes without nested menus, enhancing situational awareness.
Displays ≤5 inches maintain relevance among budget cars and aftermarket DIN units, but suppliers enhance pixel density and touch latency to compensate for limited real estate. Premium brands experiment with pillar-to-pillar screens and segmented panoramic layouts, though cost and regulatory glare limits modulate extremes.
By Sales Channel: OEM Dominance Meets Retrofit Opportunity
Factory-installed systems accounted for 70.88% of the in-dash navigation system market in 2025, riding the shift to software-defined vehicles where navigation intertwines with ADAS and cockpit orchestration. Over-the-air add-ons and lifecycle subscriptions sustain OEM revenue beyond the initial sale.
Even so, aftermarket demand accelerates at 13.82% CAGR as owners of legacy fleets seek modern conveniences. Plug-and-play head units boasting wireless Android Auto and CarPlay, large capacitive screens, and AI voice control broaden appeal. Growth hotspots include emerging markets with older car parks and developed economies where second-hand EV buyers retrofit advanced displays.
By Vehicle Type: Electrification Shapes Feature Priorities
Passenger cars made up 80.35% of revenue in 2025, reflecting their large build volumes and consumer appetite for connected tech. Within the cohort, premium trims incorporate AR overlays, multi-screen orchestration, and personalized route analytics. The in-dash navigation system market size linked to electric vehicles expands fastest, clocking a 13.52% CAGR.
Range anxiety transforms navigation into an energy-management tool, combining topography, weather, and driving style to predict battery depletion and propose charging stops. Commercial vehicles adopt route-optimization layers that respect payload limits, hazardous-material restrictions, and fleet telematics, delivering tangible operating-cost savings. Innovations piloted in EVs, such as battery-aware routing, later migrate to combustion platforms, creating a trickle-down of sophisticated guidance.
Geography Analysis
Asia Pacific led the in-dash navigation system market with a 34.05% revenue share in 2025. China’s EV boom spurs demand for large displays and AI-assisted navigation, while Japan and South Korea pioneer V2X-enhanced predictive routing. Regional governments champion intelligent transport blueprints that embed connected navigation into urban-planning frameworks. Supply-chain realignments induced by tariff policies nudge Chinese automakers toward broader export footprints, carrying their display-centric cockpit philosophies into Southeast Asia and Europe.
North America ranks second, where consumers expect seamless cloud connectivity and robust safety functions. Embedded solutions flourish under federal mandates for automatic crash notification, and luxury marques promote AR navigation as a brand signature. Europe closely follows, leveraging stringent safety regulations that codify eCall and granting early approval for Level-3 automation. HD map adoption therefore outpaces other regions, with lane-level accuracy feeding advanced guidance across dense motorway networks.
The Middle East and Africa currently contribute the smallest slice yet register the highest growth rate at 10.03% CAGR. Infrastructure spending and rising vehicle ownership, particularly in Gulf states, encourage leapfrog adoption of the latest cockpit stacks. Latin America presents a heterogeneous outlook: major economies sustain manufacturing hubs and moderate navigation uptake, but high map-subscription costs curb penetration in smaller markets. Localized pricing models and offline map options gradually bridge affordability gaps.

Competitive Landscape
Competition is moderate, with tier-one giants like Continental AG, Robert Bosch GmbH, and Denso Corporation capitalizing on integration depth with OEMs. Pure-play specialists such as TomTom International BV and Garmin Ltd. focus on mapping precision and user-interface leadership. Semiconductor vendors Qualcomm Technologies, Inc. and NVIDIA Corporation shape the feature ceiling through automotive-grade chipsets that run AI inference and complex graphics. The ecosystem approach prevails: success hinges on partnerships uniting silicon, software, and content.
White-space potential includes cost-effective AR navigation for mass-market cars, frictionless interplay between embedded units and smartphone apps, and EV-tailored guidance that optimizes charging logistics. Cloud-native navigation-as-a-service providers surface as disruptors, decoupling innovations from hardware refresh cycles. TomTom’s early lane-level map relationships with global OEMs illustrate how proprietary data sets translate into competitive moats, while Harman International’s cockpit platforms demonstrate speed gains from collaborative development.
In-dash Navigation System Industry Leaders
Robert Bosch GmbH
Continental AG
Denso Corporation
Delphi Automotive Plc
TomTom International BV
- *Disclaimer: Major Players sorted in no particular order


Recent Industry Developments
- April 2025: Mitsubishi Electric expanded its navigation lineup with enhanced voice recognition and refined map rendering.
- April 2025: Continental AG unveiled its AR-HUD 2.0, widening the field of view and sharpening graphics for augmented guidance.
- March 2025: Harman International introduced its Digital Cockpit platform with AI-driven predictive routing and personalized UX.
- March 2025: Robert Bosch GmbH released new GNSS receivers aimed at high-precision navigation with lower power draw.
- January 2025: TomTom International BV secured multiple OEM deals for its latest real-time map platform with deeper ADAS hooks.
- January 2025: Garmin Ltd. premiered an AI voice-first in-dash navigation solution with immersive lane-level 3-D guidance at CES.


Research Methodology Framework and Report Scope
Market Definitions and Key Coverage
Our study defines the in-dash navigation system market as factory-installed or dealer-fitted head units that combine a dedicated display, GPS chipset, gyroscope input, and map software to deliver real-time route guidance inside passenger and commercial vehicles. The boundary covers hardware, firmware, and update services sold with the unit during the vehicle sale or retrofit year.
Scope exclusion: stand-alone smartphone apps or portable plug-and-play GPS devices that sit outside the dashboard are not counted.
Segmentation Overview
- By Component
- Display Unit
- Control Module
- Antenna Module
- Wiring Harness
- Software and Services
- By Technology
- 2-D Maps
- 3-D Maps
- Augmented-Reality Navigation
- By Connectivity
- Embedded
- Tethered
- Integrated/Smartphone
- By Screen Size
- ?5 inches
- 6-10 inches
- >10 inches
- By Sales Channel
- OEM-fitted
- After-market
- By Vehicle Type
- Passenger Cars
- Commercial Vehicles
- Electric Vehicles
- By Geography
- North America
- United States
- Canada
- Mexico
- Europe
- Germany
- United Kingdom
- France
- Italy
- Spain
- Rest of Europe
- Asia-Pacific
- China
- Japan
- South Korea
- India
- South East Asia
- Rest of Asia-Pacific
- South America
- Brazil
- Rest of South America
- Middle East and Africa
- Middle East
- United Arab Emirates
- Saudi Arabia
- Rest of Middle East
- Africa
- South Africa
- Rest of Africa
- Middle East
- North America
Detailed Research Methodology and Data Validation
Primary Research
To validate desk findings, our team interviewed hardware suppliers, digital map licensors, and procurement managers at major automakers across Asia, Europe, and North America. We also ran short consumer pulse surveys through dealer networks to refine fitment assumptions, price sensitivity, and refresh cycle preferences, ensuring regional nuances were captured.
Desk Research
Mordor analysts began with publicly available vehicle production and sales files from OICA, new vehicle registration logs from the US Federal Highway Administration and ACEA, and trade flow snapshots from UN Comtrade that reveal cross-border shipments of navigation head units. Regulatory texts on mandatory e-call and telematics fitment from NHTSA, UNECE, and China MIIT helped us frame the compliance baseline. Additional insights flowed from Society of Automotive Engineers journals, patent families mined via Questel, and company financials accessed in D&B Hoovers that clarified average selling prices and supplier mix. These sources anchored first estimates before any model tuning. A host of other secondary materials were referenced; the list above is illustrative, not exhaustive.
Market-Sizing & Forecasting
A top-down build starts with country-level light vehicle production and import volumes, which are then multiplied by model-specific factory and aftermarket installation rates to generate unit demand. Average unit revenue verified through supplier roll-ups produces the base year value. Select bottom-up checks, sampled head unit shipments and dealer channel audits, tightened ranges. Key inputs include electrified vehicle share, shift toward larger displays, ADAS penetration, telematics regulation timelines, currency trends, and map update attach rates. Multivariate regression anchored on these drivers forecasts adoption over the forecast period, while scenario analysis adjusts for chip supply shocks and policy swings. Gaps in bottom-up evidence are bridged by regional proxy ratios agreed in expert calls.
Data Validation & Update Cycle
Outputs run through variance scans versus historic OEM revenue filings, customs tags, and trade association spot checks. Any anomaly above a predefined threshold triggers re-engagement with sources before senior analyst sign-off. Reports refresh annually, and material events such as supply chain disruptions prompt interim updates; a final sense check is completed just before client delivery.
Why Mordor's In-Dash Navigation System Baseline Commands Reliability
Published estimates differ because firms pick divergent product mixes, base years, and forecast levers. Our disciplined scope, yearly refresh cadence, and dual-pronged model keep figures grounded and comparable.
Key gap drivers include whether aftermarket-only devices are bundled, if broader infotainment revenues are folded in, currency conversions locked at outdated rates, and how aggressively electrification or AR navigation upticks are baked into projections.
Benchmark comparison
| Market Size | Anonymized source | Primary gap driver |
|---|---|---|
| USD 21.47 B (2025) | Mordor Intelligence | - |
| USD 21.91 B (2024) | Global Consultancy A | Combines off-dash portable GPS units, inflating base |
| USD 18.48 B (2023) | Industry Association B | Uses production data for passenger cars only, omits commercial vehicles |
| USD 18.80 B (2024) | Regional Consultancy C | Applies flat ASP across regions, ignores premium display price uplift |
The comparison shows that variances arise mainly from scope breadth and pricing depth. By aligning unit counts with verified fitment ratios and region-specific ASPs, Mordor's baseline remains the most transparent and repeatable yardstick for decision makers.


Key Questions Answered in the Report
What is the in-dash navigation system market size in 2026?
The market is valued at USD 23.56 billion in 2026.
What compound annual growth rate is forecast for the in-dash navigation system market from 2026 to 2031?
Analysts project a 9.74% CAGR through 2031.
Which component segment is expected to expand the quickest during the forecast window?
Software and services are forecast to rise at an 11.43% CAGR, outpacing hardware categories.
How much of the market do embedded connectivity solutions control today?
Embedded systems held 62.15% of revenue share in 2025 and remain the dominant architecture.
Which geographic region is projected to post the fastest growth between 2026 and 2031?
The Middle East and Africa region is set to log a 10.03% CAGR, the strongest globally.
Why are electric vehicles a growth catalyst for in-dash navigation suppliers?
EVs depend on precise route planning for range and charging, driving a 13.52% CAGR for navigation systems tailored to electric mobility.
Page last updated on:


