Market Overview
| Study Period | 2020 - 2031 |
|---|---|
| Forecast Data Period | 2026 - 2031 |
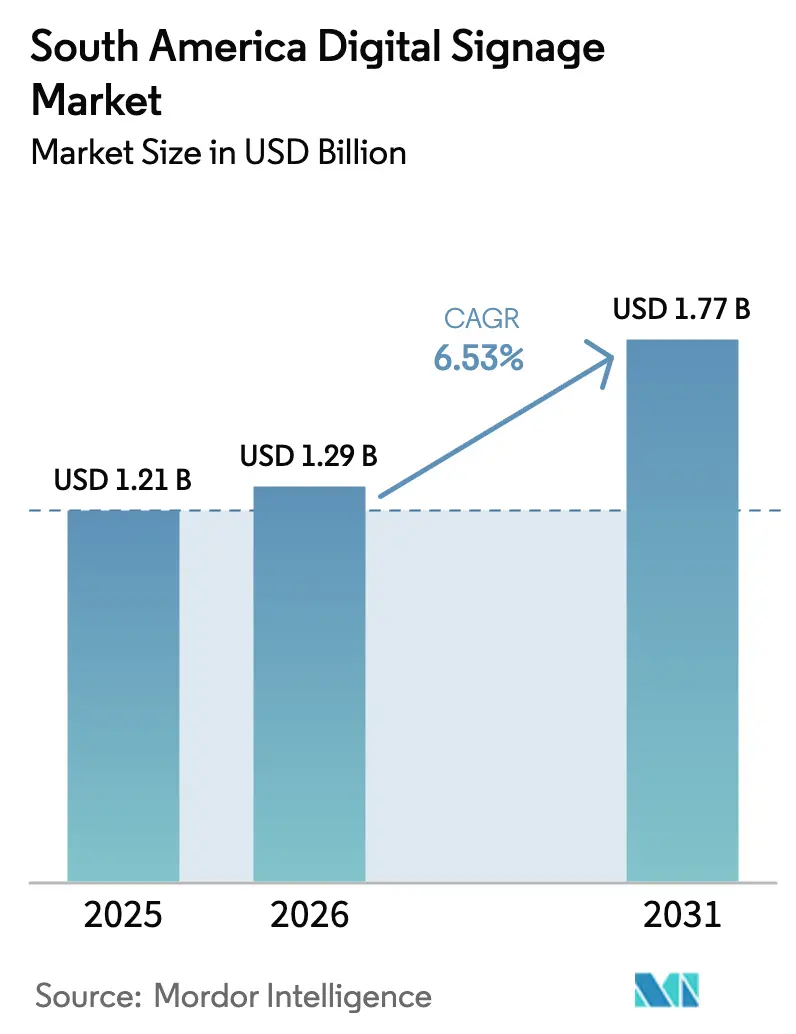
| Base Year Market Size (2025) | USD 1.21 Billion |
| Market Size (2026) | USD 1.29 Billion |
| Market Size (2031) | USD 1.77 Billion |
| Growth Rate (2026 - 2031) | 6.53% CAGR |
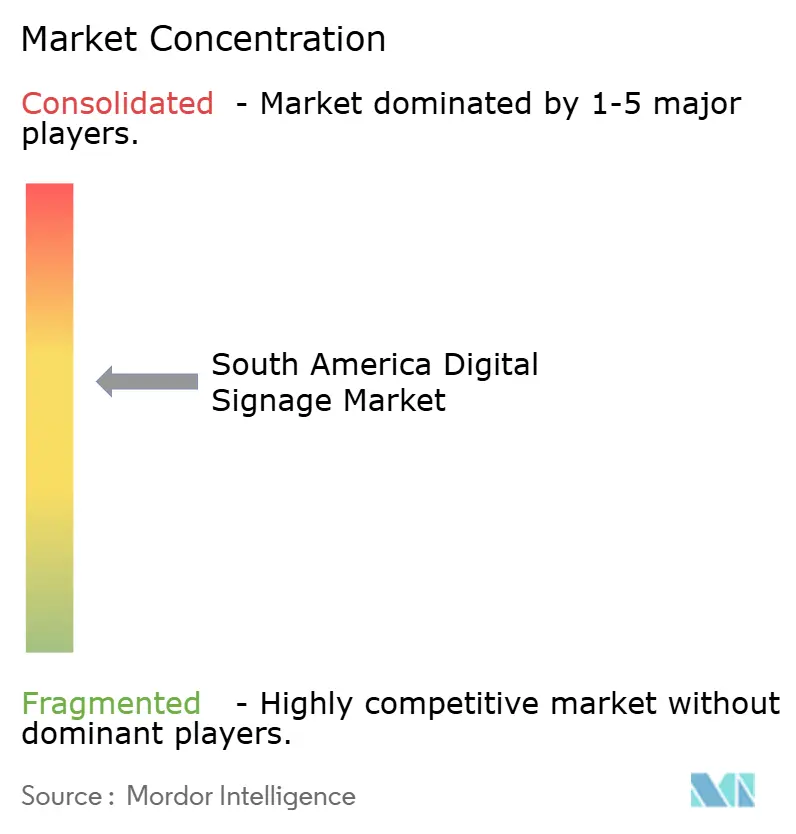
| Market Concentration | Medium |
Major Players *Disclaimer: Major Players sorted in no particular order Image © Mordor Intelligence. Reuse requires attribution under CC BY 4.0. | |
South America Digital Signage Market Analysis by Mordor Intelligence
The South America digital signage market size was valued at USD 1.21 billion in 2025 and estimated to grow from USD 1.29 billion in 2026 to reach USD 1.77 billion by 2031, at a CAGR of 6.53% during the forecast period (2026-2031). A confluence of retail-media adoption, programmatic digital-out-of-home (DOOH) trading, and smart-city investments is expanding the addressable base of networked screens across malls, transit hubs, and public plazas. Hardware remained the largest cost center in 2025, yet operators are pivoting toward managed services that monetize audiences through data-driven content rotation. Falling panel prices, especially for large-format LED, are lowering entry barriers for mid-tier municipalities, while e-paper modules open off-grid opportunities in the Amazon Basin and Andean highlands. Regulatory uncertainty persists, but rising broadband penetration and 5G rollout underpin the region’s capacity for real-time bidding and cloud-based content management.
Key Report Takeaways
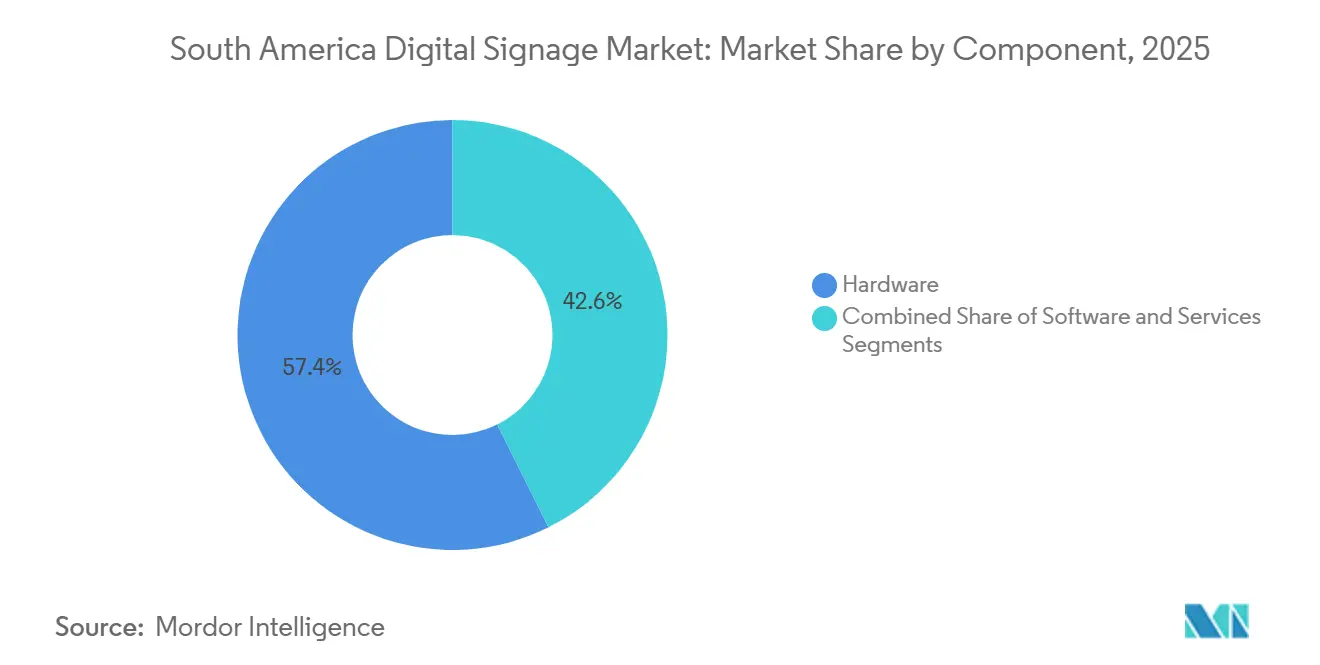
- By component, hardware led with 57.37% of the South America digital signage market share in 2025, whereas service is projected to advance at a 6.84% CAGR through 2031.
- By display technology, LCD and LED panels captured 61.28% share of the South America digital signage market size in 2025, while e-paper is forecast to grow at 7.44% between 2026 and 2031.
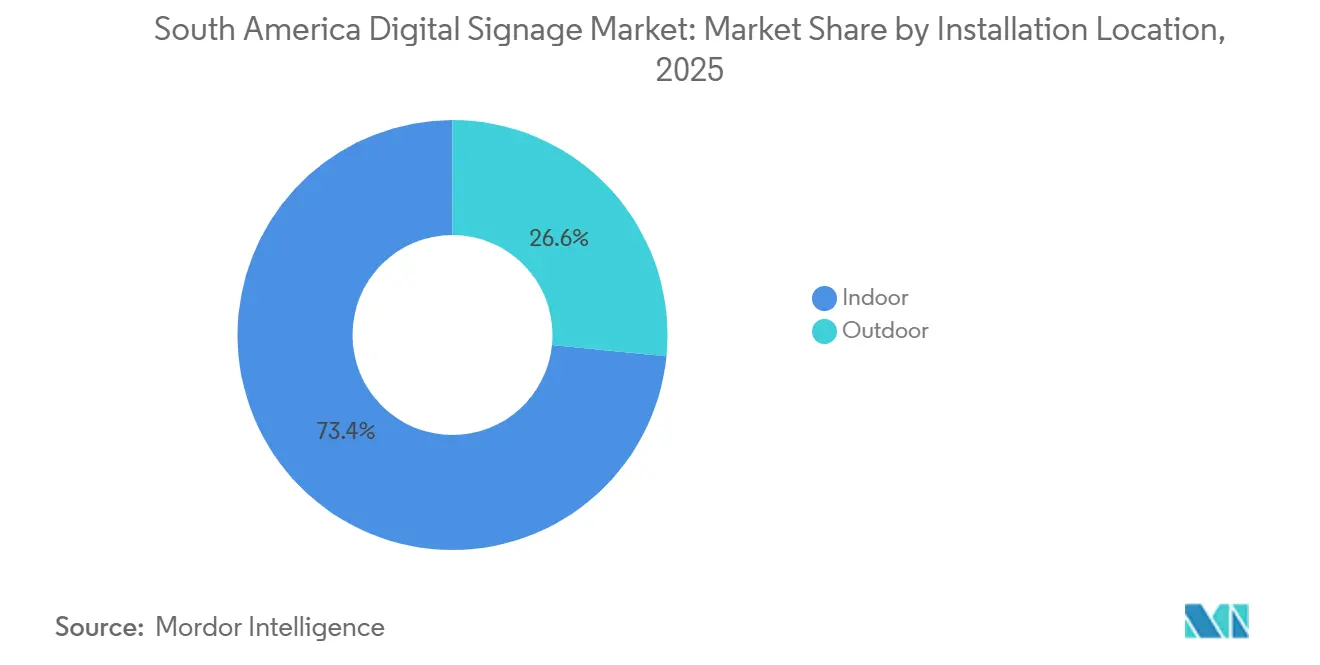
- By installation location, indoor screens accounted for 73.42% in 2025, and outdoor placement is on track for a 6.91% CAGR through 2031.
- By end-user, retail accounted for 30.19% of the market size in 2025, whereas transportation and transit is expected to expand at 7.83% through 2031.
- By country, Brazil commanded 48.61% share of the South America digital signage market in 2025; Peru is poised for the fastest 7.12% CAGR during 2026-2031.
Note: Market size and forecast figures in this report are generated using Mordor Intelligence’s proprietary estimation framework, updated with the latest available data and insights as of January 2026.
South America Digital Signage Market Trends and Insights
Drivers Impact Analysis
| Driver | (~) % Impact on CAGR Forecast | Geographic Relevance | Impact Timeline |
|---|---|---|---|
| Retail Modernization and Omnichannel Investment Up-Trend | +1.2% | Brazil, Argentina, Chile (urban centers: São Paulo, Buenos Aires, Santiago) | Medium term (2-4 years) |
| DOOH Adoption Surge among FMCG and Telecom Advertisers | +1.4% | Brazil (São Paulo, Rio de Janeiro), Argentina (Buenos Aires), Chile (Santiago, Valparaíso) | Short term (≤ 2 years) |
| Declining Capex of Large-Format LCD/LED Panels | +0.9% | Global, with strongest uptake in Brazil and Argentina metro areas | Medium term (2-4 years) |
| Government-Funded Smart-City Kiosk Roll-Outs | +0.8% | Brazil (São Paulo, Brasília), Chile (Santiago), Peru (Lima, Trujillo), Argentina (Buenos Aires) | Long term (≥ 4 years) |
| Programmatic DOOH Exchanges Localized for ES-PT Markets | +1.3% | Brazil (national), Argentina (Buenos Aires metro), Chile (Santiago), expanding to Peru | Short term (≤ 2 years) |
| E-Paper Signage for Off-Grid Amazon and Andean Logistics | +0.6% | Brazil (Amazon basin), Peru (Andean highlands), Chile (remote mining corridors) | Long term (≥ 4 years) |
| Source: Mordor Intelligence | |||
Retail Modernization and Omnichannel Investment Up-Trend
Retail chains are embedding connected screens into aisle ends, checkout lanes, and pharmacy counters to synchronize in-store promotions with mobile apps and e-commerce storefronts. Brazil’s retail-media revenue grew 42.3% in 2024, and 81% of surveyed brands plan to boost spending in 2026 as screens shift from brand awareness assets to performance marketing endpoints that track conversions. Loyalty data allows grocers to serve real-time offers, while QR codes accelerate mobile redemption, a tactic that lifted Mercado Libre’s Black Friday sales by 80% year over year. Argentina’s grocery operators pursue similar models to offset store-expansion costs, and Chilean retailers now prioritize high-brightness indoor displays that circumvent a light-pollution ordinance mandating overnight shutdown of outdoor screens.[1]Valor International, “Brazil ad spending forecast to reach R$28bn in 2025,” valorinternational.globo.com
DOOH Adoption Surge among FMCG and Telecom Advertisers
Fast-moving consumer goods and telecom brands are reallocating budgets from static billboards to programmatic DOOH that supports audience measurement and flexible daypart buying. JCDecaux and VIOOH switched on programmatic access to São Paulo street furniture in August 2024, demonstrating uplift in both brand recall and website traffic for pilot advertiser InfinitePay. A VIOOH survey notes 87% of incremental DOOH spend in Brazil now migrates from online channels rather than legacy out-of-home formats.[2]ICLG, “Telecoms, Media and Internet Laws and Regulations Chile 2026,” iclg.com Telcos promoting 5G bundles leverage transit-hub screens to engage commuters at wait times, while new advertiser categories such as betting platforms add depth to demand. Coverage gaps outside tier-one cities remain a challenge, yet rising 4G and 5G penetration promises wider inventory activation.
Declining Capex of Large-Format LCD and LED Panels
Panel makers have amortized manufacturing lines, driving down the cost of 55-inch to 98-inch commercial displays and making direct-view LED viable for mid-market landlords. Samsung’s 487-square-meter LED wall at Lima’s Plaza Norte, completed in June 2024, underscores the affordability of landmark builds that once required projector arrays. LG’s UV5N series embeds BrightSignOS to cut media-player procurement, lowering total cost of ownership. New modules are also 40% more energy-efficient, a critical factor where electricity tariffs are rising and grid stability is uneven.[3]IEA, “LED energy consumption trends,” iea.org
Government-Funded Smart-City Kiosk Roll-Outs
Brazil, Chile, Peru, and Argentina earmark public funds for interactive kiosks that provide wayfinding, public-service alerts, and commercial advertising. Peru’s five-region broadband initiative and a World Bank-backed traffic-management system for Lima open pathways for bundled screen deployments that monetize ad inventory to recover capital costs. Municipal authorities increasingly demand audience analytics and emergency messaging override features, pushing integrators toward robust content-management platforms compliant with data-protection statutes.
Restraints Impact Analysis
| Restraint | (~) % Impact on CAGR Forecast | Geographic Relevance | Impact Timeline |
|---|---|---|---|
| High Upfront System and Integration Costs | -0.7% | Argentina, Peru, Chile (budget-constrained municipalities and SME retailers) | Short term (≤ 2 years) |
| Complex Multi-Vendor Technology Stack | -0.5% | Brazil (São Paulo, Rio), Argentina (Buenos Aires), Chile (Santiago), urban deployments | Medium term (2-4 years) |
| Municipal Permitting Variability across Provinces | -0.4% | Chile (light pollution law), Brazil (São Paulo Cidade Limpa), Argentina (provincial regulations) | Medium term (2-4 years) |
| Power-Consumption Curbs, Grid Instability in Rural Zones | -0.3% | Peru (Andean highlands), Brazil (Amazon basin), Argentina (rural provinces) | Long term (≥ 4 years) |
| Source: Mordor Intelligence | |||
High Upfront System and Integration Costs
End-to-end video-wall implementations can exceed USD 250,000 once displays, media players, software licenses, and installation labor are tallied, a barrier for small retailers and cost-constrained municipalities. Argentina’s currency volatility inflates imported hardware prices, encouraging buyers to delay upgrades or settle for low-spec models that do not support programmatic trading. Revenue-sharing arrangements that defer payment against future ad proceeds exist but remain uncommon outside Brazil.
Municipal Permitting Variability across Provinces
Operators navigate a patchwork of local ordinances that dictate brightness limits, operating hours, and content categories. Chile’s October 2024 light-pollution law forces screens to shut between midnight and 7 am, compressing revenue windows and prompting indoor relocation strategies. Brazil’s São Paulo Cidade Limpa framework bans roadside billboards yet permits digital panels integrated into bus shelters, while Argentine provinces apply varying moratoria on large-format LED, extending approval timelines and raising compliance costs.
Segment Analysis
By Component: Services Monetize Screen Network
Hardware retained 57.37% of the South America digital signage market share in 2025 as retailers and transit authorities invested in panels, mounts, and cabling. The services category is projected to deliver a 6.84% CAGR, reflecting demand for content scheduling, uptime monitoring, and programmatic ad sales that convert fixed sponsorships into impression-based revenue.
The services boom signals a shift from capital expenditure to recurring operating expenditure models. Integrators bundle creative production, data analytics, and compliance reporting so retailers spanning 200 stores across Brazil, Argentina, and Chile can outsource technical complexity. Cloud platforms that embed artificial intelligence for predictive maintenance and dynamic creative optimization carry subscription fees, moving vendors toward annuity revenue streams.


By Display Technology: E-Paper Targets Off-Grid Logistics
LCD and LED panels captured 61.28% of the South America digital signage market size in 2025, prized for brightness and a broad range of dimensions suited to indoor retail and outdoor transit assets. E-paper, although niche, will accelerate at 7.44% as solar-powered modules enable always-readable signage in Amazonian river ports and Andean logistics corridors.
E Ink’s Spectra 6 achieves full-color refresh rates suitable for electronic shelf labels and bus-stop schedules, while Samsung’s 13-inch bio-resin e-paper display aligns with municipal sustainability mandates. OLED and micro-LED remain high-cost options reserved for luxury retail and flagship corporate lobbies, whereas legacy projection systems decline as direct-view LED prices fall.
By Installation Location: Outdoor Scales with Permitting Reforms
Indoor placements constituted 73.42% of the market share in 2025, fueled by grocers, pharmacies, and banks embedding checkout screens that drive impulse buys. Outdoor inventory is slated for a 6.91% CAGR through 2031 as municipalities authorize large-format LED in high-footfall plazas and along transit corridors.
Samsung’s Plaza Norte mega-screen demonstrates how shopping-center landlords monetize foot-traffic spillover into adjacent transit nodes, while Chilean operators reposition assets in metro stations to bypass overnight curfews imposed on roadside panels. Hybrid semi-outdoor environments such as subway mezzanines require ruggedized enclosures yet benefit from captive commuter dwell time.
By End-User Industry: Transit Delivers Fastest Growth
Retail commanded 30.19% of the market size in 2025, leveraging screen networks to cross-sell high-margin items and sell third-party ad slots. Transportation and transit is poised to surge at 7.83% as airports, metro systems, and bus-rapid-transit lines bundle passenger information with commercial messaging to offset operating subsidies.
SITA’s deployments at São Paulo Guarulhos and Rio Galeão integrate flight updates with retail promotions, elevating passenger experience while generating incremental revenue. Facial-recognition boarding trials in Rio bus depots foreshadow contextually triggered advertising, though privacy oversight remains an open debate.
Geography Analysis
Brazil continues to anchor nearly half of the South America digital signage market, propelled by São Paulo’s agency clusters and retail-media adoption that climbed 42.3% in 2024. Out-of-home now represents 11.8% of the national advertising mix, and 87% of new programmatic budgets cannibalize other digital channels rather than traditional billboards. SITA’s airport rollouts and metro upgrades extend inventory beyond retail, though screen owners still grapple with limited audience data in secondary cities.
Peru registers the region’s fastest expected CAGR of 7.12% because public broadband grants, 5G activation, and World Bank traffic management funds build the digital backbone needed for cloud-managed networks. The Plaza Norte LED wall has become a showcase for municipal authorities exploring revenue-sharing concessions. Operators must, however, adapt pricing to lower per-capita ad budgets and offer deferred-payment models.
Argentina, Chile, and the rest of South America contribute the remaining share. Argentina’s 90.6% internet penetration underpins interactive use cases, yet a 30% foreign-ownership cap complicates mergers and acquisitions. Chile’s midnight curfew on outdoor screens shifts capital to indoor deployments and fuels demand for high-brightness daytime panels. Colombia and Paraguay gain access to Broadsign’s programmatic rails, suggesting wider dispersion of inventory despite fragmented regulations.
Competitive Landscape
Global hardware giants Samsung, LG, Sony, and Panasonic dominate premium panels, while middleware, analytics, and ad-trading layers remain fragmented among Broadsign, VIOOH, Vistar Media, and regional start-ups. Samsung’s 487-square-meter LED wall in Lima exemplifies a strategy of high-visibility projects that influence municipal tenders. LG’s dual agreements with BrightSign and Ricoh integrate media-player functionality and wrap hardware with managed services, catering to buyers that prefer single-vendor accountability.
Programmatic exchanges race to lock screen inventory before consolidation. Broadsign aggregates assets across Brazil, Colombia, and Paraguay, while VIOOH moved first in São Paulo and Rio street furniture. Smaller operators fear future fee inflation and lobby industry bodies for open APIs.
Emerging challengers leverage artificial intelligence for predictive maintenance and audience insights. E Ink’s full-color modules address off-grid logistics and sustainability mandates, whereas BrightSign’s AI suite targets dynamic creative optimization. Compliance with Argentina’s data-retention rules and Chile’s light-pollution limits favors larger vendors that can absorb legal and engineering overhead, keeping market concentration at a moderate level.
South America Digital Signage Industry Leaders
LG Electronics Inc.
Samsung Electronics Co., Ltd.
Panasonic Holdings Corporation
Sony Group Corporation
Sharp Corporation
- *Disclaimer: Major Players sorted in no particular order

Recent Industry Developments
- February 2026: Sony unveiled the Crystal LED S Series for corporate lobbies and broadcast studios, widening mid-market access to seamless direct-view LED walls.
- February 2026: Clear Channel Outdoor and CapMetro announced a multi-year partnership to digitize bus and rail advertising assets, enabling real-time service alerts and dynamic ad insertion.
- February 2026: Samsung introduced a 13-inch color e-paper display with bio-resin casing, targeting low-power rural deployments.
- August 2025: LG partnered with Ricoh to distribute professional displays across Latin America, bundling installation and managed services.


South America Digital Signage Market Report Scope
A digital signage system delivers and displays content, such as digital images, video, streaming media, and information. The displayed content is filed, and the schedule information is edited in the content management system. Digital signage, also known as dynamic signage, is a digital display that displays advertisements, broadcasts, television programming, and other content. Digital signs use a variety of technologies, including LED and LCD. They can be observed in public and private spaces, such as eateries, shops, and workplaces.
The South America Digital Signage Market Report is Segmented by Component (Hardware, Software, Services), Display Technology (LCD/LED, OLED, Projection and Screens, E-Paper, Other Display Technologies), Installation Location (Indoor, Outdoor), End-User Industry (Retail, Transportation and Transit, Hospitality and Leisure, Corporate and Banking, Government and Public Spaces, Education and Healthcare, Other End-User Industries), and Country (Brazil, Argentina, Peru, Chile, Rest of South America). The Market Forecasts are Provided in Terms of Value (USD).
By Component
| Hardware |
| Software |
| Services |
By Display Technology
| LCD / LED |
| OLED |
| Projection and Screens |
| E-Paper |
| Other Display Technologies |
By Installation Location
| Indoor |
| Outdoor |
By End-User Industry
| Retail |
| Transportation and Transit |
| Hospitality and Leisure |
| Corporate and Banking |
| Government and Public Spaces |
| Education and Healthcare |
| Other End-User Industries |
By Country
| Brazil |
| Argentina |
| Peru |
| Chile |
| Rest of South America |
| By Component | Hardware |
| Software | |
| Services | |
| By Display Technology | LCD / LED |
| OLED | |
| Projection and Screens | |
| E-Paper | |
| Other Display Technologies | |
| By Installation Location | Indoor |
| Outdoor | |
| By End-User Industry | Retail |
| Transportation and Transit | |
| Hospitality and Leisure | |
| Corporate and Banking | |
| Government and Public Spaces | |
| Education and Healthcare | |
| Other End-User Industries | |
| By Country | Brazil |
| Argentina | |
| Peru | |
| Chile | |
| Rest of South America |


Key Questions Answered in the Report
How large will screen-management services become in South America by 2031?
Services are projected to grow at a 6.84% CAGR, outpacing hardware as operators outsource content, analytics, and compliance tasks.
Which display technology is growing fastest across rural logistics routes?
Solar-powered e-paper is set to expand at 7.44%, favored for zero-power static imaging in off-grid Andes and Amazon applications.
What is driving Peru’s rapid adoption of connected screens?
USD 436 million in broadband grants, 40,000 km of new fiber, and 5G rollouts extend cloud connectivity to provincial hubs, unlocking new deployments.
How are retailers monetizing in-store screens?
Chains embed loyalty data into point-of-sale displays, selling impressions to FMCG brands and treating signage as a performance channel.
Why do advertisers favor programmatic DOOH in Brazil?
Audience measurement, daypart flexibility, and cross-channel attribution have redirected 87% of incremental budgets from online display and video.
What regulatory issues most affect outdoor LED walls?
Municipal curfews on operating hours, light-pollution limits, and variable permitting timelines can shorten revenue windows and raise compliance costs.
What revenue level do analysts expect South America digital signage market to reach by 2031?
Forecasts point to USD 1.77 billion in 2031, up from USD 1.29 billion in 2026.
Page last updated on:


