
Digital Oilfield Services Market Size and Share
Market Overview
| Study Period | 2021 - 2031 |
|---|---|
| Market Size (2026) | USD 32.94 Billion |
| Market Size (2031) | USD 43.37 Billion |
| Growth Rate (2026 - 2031) | 5.63 % |
| Fastest Growing Market | Asia-Pacific |
| Largest Market | North America |
| Market Concentration | Medium |
Major Players *Disclaimer: Major Players sorted in no particular order Image © Mordor Intelligence. Reuse requires attribution under CC BY 4.0. | |
Digital Oilfield Services Market Analysis by Mordor Intelligence
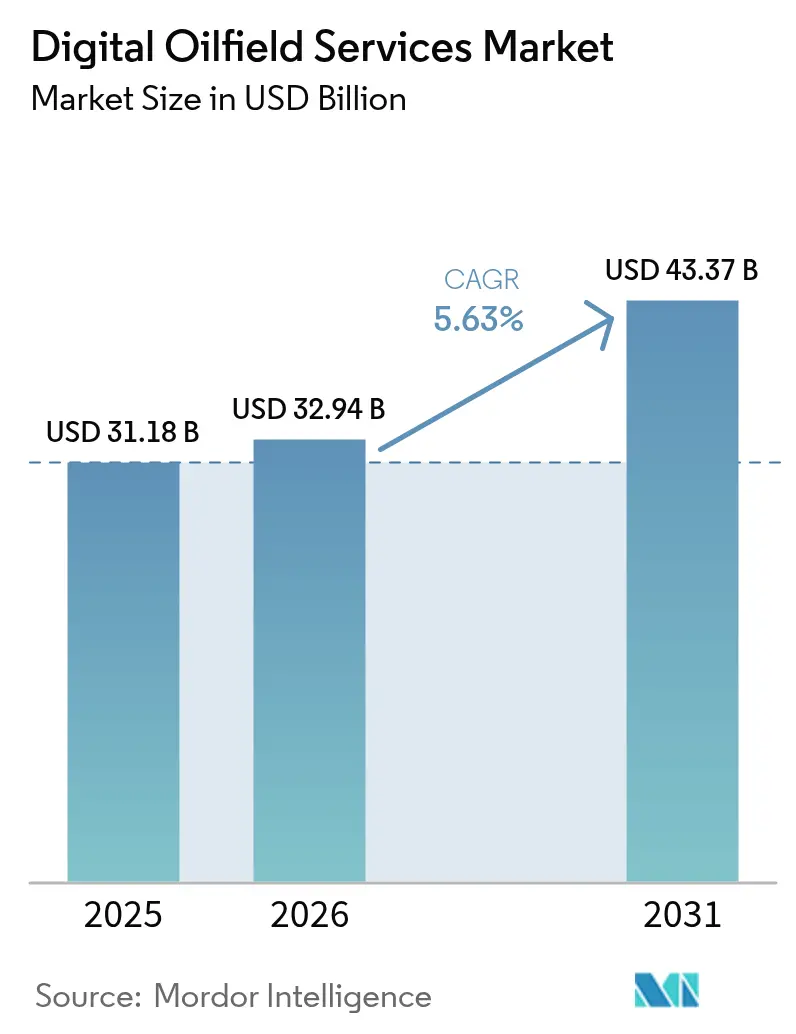
The Digital Oilfield Services Market size was valued at USD 31.18 billion in 2025 and estimated to grow from USD 32.94 billion in 2026 to reach USD 43.37 billion by 2031, at a CAGR of 5.63% during the forecast period (2026-2031).
Operators' focus on real-time production optimization, methane-intensity monitoring, and predictive maintenance is intensifying adoption across every major basin. Investment momentum is underpinned by shale activity in North America, large-scale AI initiatives in the Middle East, and an accelerated digitalization push in the Asia-Pacific region. Integrated hardware-software offerings are displacing point solutions as producers seek unified data architectures that cut non-productive time and streamline regulatory reporting. Meanwhile, tightening cybersecurity requirements are elevating demand for cloud environments built on zero-trust principles, steering capital toward vendors that can secure operational technology without compromising uptime.
Key Report Takeaways
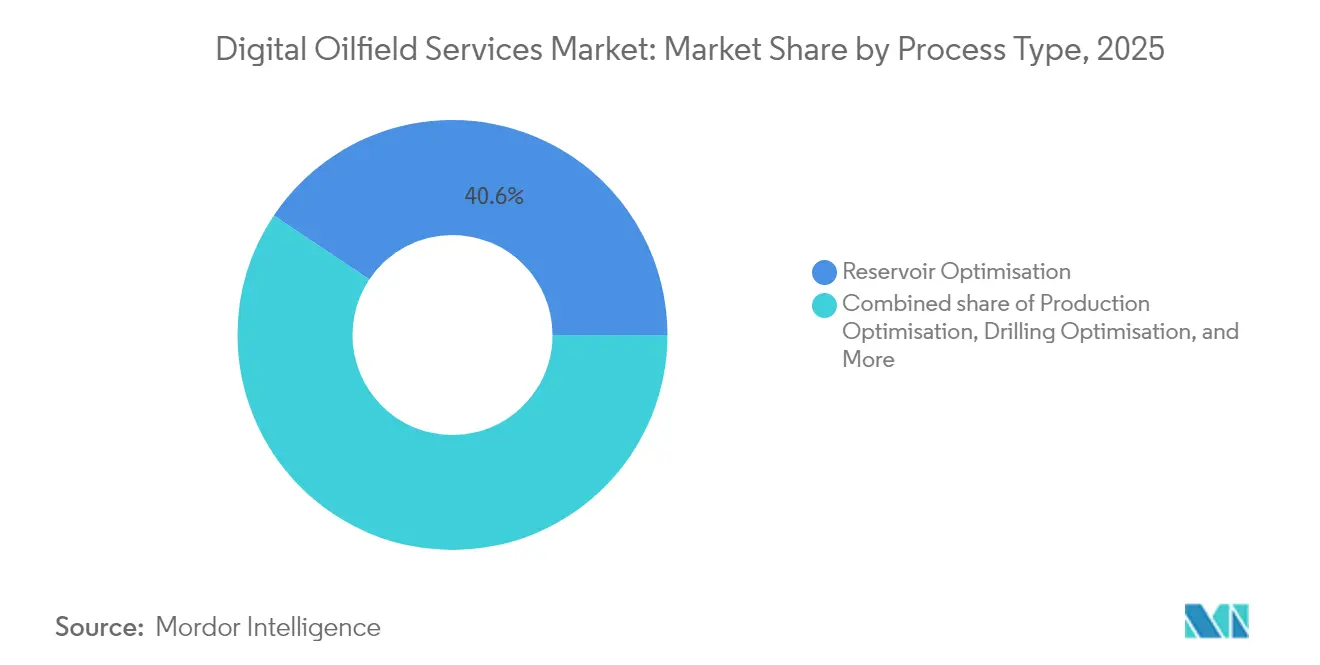
- By process type, reservoir optimization led with a 40.62% revenue share of the digital oilfield services market in 2025, whereas production optimization is projected to post the fastest 6.18% CAGR through 2031.
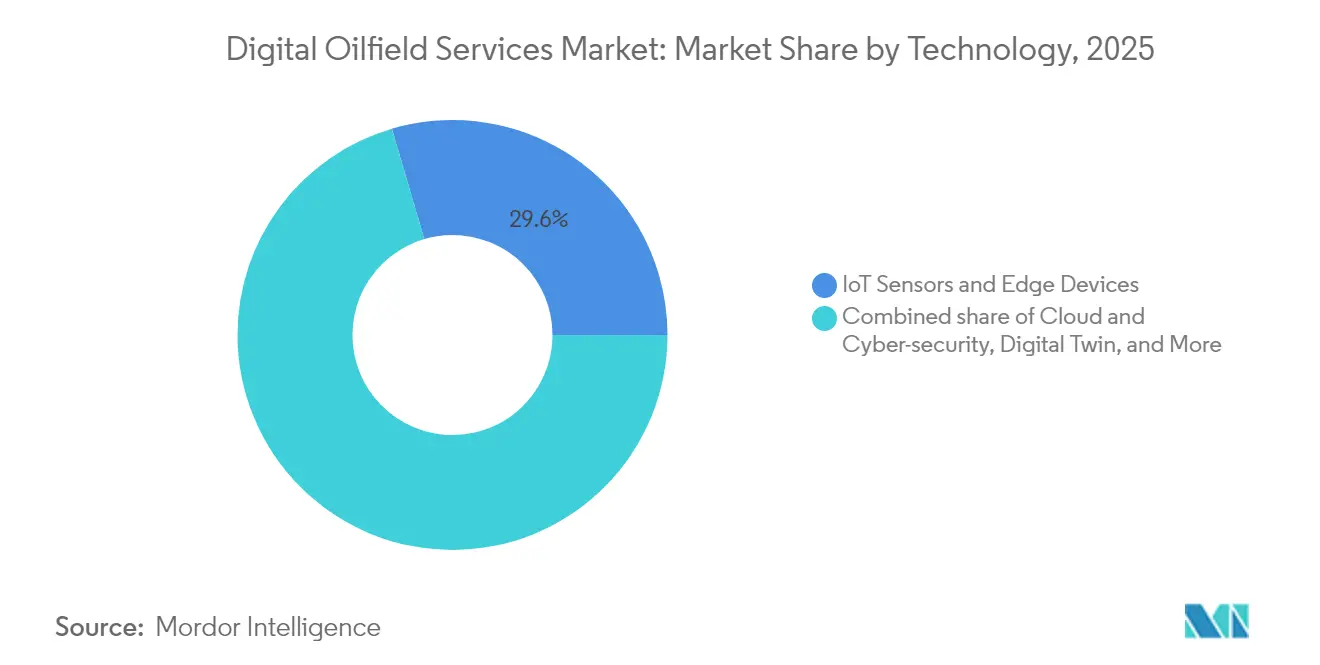
- By technology, IoT sensors and edge devices held 29.55% of the digital oilfield services market share in 2025, while cloud and cybersecurity solutions are expected to grow at an 8.12% CAGR, the highest among technology categories.
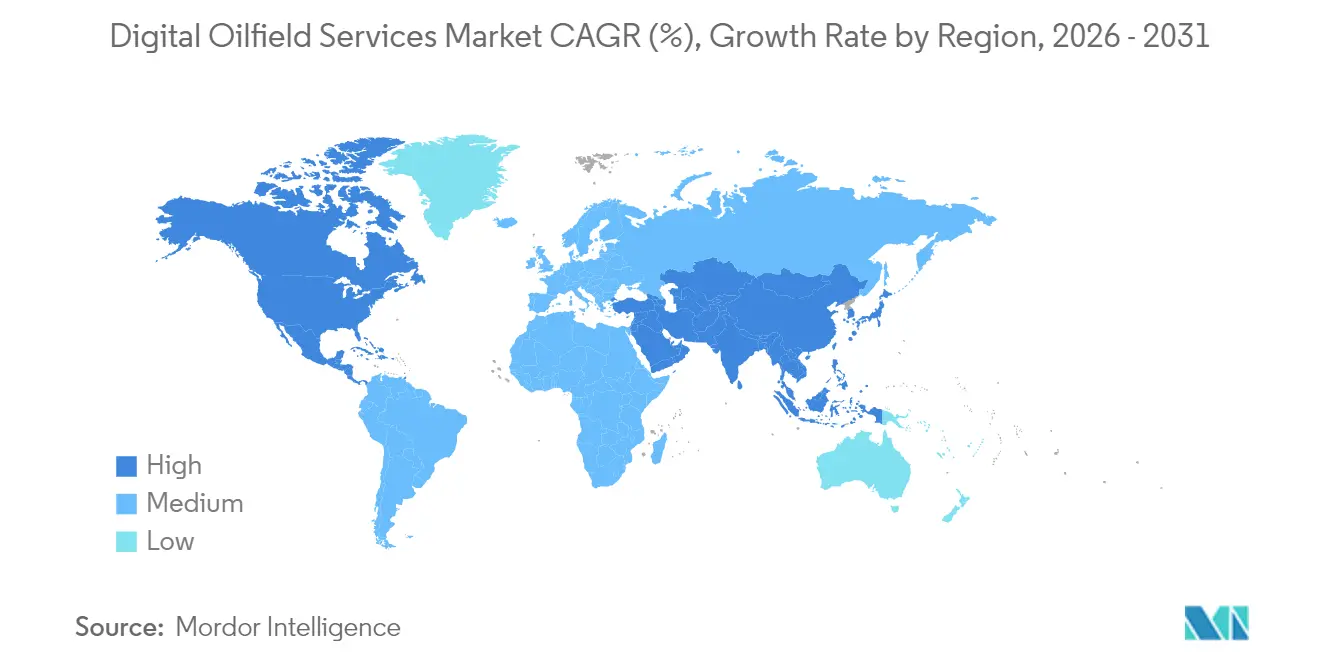
- By geography, North America accounted for 35.62% of 2025 revenue; however, the Asia-Pacific region is set to expand at a 6.98% CAGR, the fastest regional trajectory through 2031.
- SLB, Halliburton, and Baker Hughes collectively controlled just under half of 2024 revenue, and SLB’s USD 7.1 billion acquisition of ChampionX is forecast to unlock USD 400 million in annual synergies by 2028.
Note: Market size and forecast figures in this report are generated using Mordor Intelligence’s proprietary estimation framework, updated with the latest available data and insights as of 2026.
Market Trends and Insights
Drivers Impact Analysis of Digital Oilfield Services Market*
| Driver | (~) % Impact on CAGR Forecast | Geographic Relevance | Impact Timeline |
|---|---|---|---|
| Rising adoption of IIoT & advanced analytics | 1.20% | Global, with North America & Europe leading | Medium term (2-4 years) |
| Increasing need to cut OPEX & non-productive time | 1.00% | Global, particularly in mature fields | Short term (≤ 2 years) |
| Growing investments in shale & tight-oil development | 0.80% | North America core, expanding to Argentina & Australia | Medium term (2-4 years) |
| Edge-AI-based predictive maintenance for ESPs | 0.60% | Global, with highest adoption in US unconventionals | Medium term (2-4 years) |
| Regulatory push for methane-intensity digital twins | 0.50% | North America & Europe, expanding globally | Long term (≥ 4 years) |
| DOF-as-a-Service (subscription) lowering CAPEX | 0.40% | Global, with early adoption in North America | Long term (≥ 4 years) |
| Source: Mordor Intelligence | |||
Rising Adoption of IIoT & Advanced Analytics
Oil and gas remains the largest industrial investor in IoT, and more than 80% of corporate respondents now rank AI-driven analytics among their top three capital priorities.[1]Offshore Technology Focus, “Energy Sector Leads IoT Investment,” offshoretechnologyfocus.com IIoT-linked sensors stream live pressure, flow, and equipment health data from over 150,000 electric submersible pumps, enabling Devon Energy to predict 51 ESP failures with five-day accuracy windows that avoided deferred production.[2]Hart Energy, “Devon Leverages Edge-AI for ESP Reliability,” hartenergy.com Schlumberger’s Agora edge-AI deployment in Ecuador prevented 12,000 barrels of lost production and reduced maintenance costs by optimizing chemical injection in real-time. Combining machine learning with legacy SCADA creates closed-loop controls. Chevron and Halliburton executed feedback-driven completions in Colorado that automatically adjusted energy delivery stage by stage. McKinsey calculates that operators still discard 60-73% of field-generated data, signalling substantial upside in analytics utilization. Edge processors with millisecond latency anchor this transition to autonomous wells, particularly for high-pressure applications where split-second choke control mitigates kick risk.
Increasing Need to Cut OPEX & Non-Productive Time
During the 2020-2021 downturn, operators re-engineered cost bases, and digital programs that delivered structural savings have since scaled across portfolios. Baker Hughes' remote operations centers reduced the average drilling days in the Pinedale Anticline from 35 to 17, resulting in USD 900,000 saved per well. AI-driven asset health models now forecast equipment failure 12 days in advance, replacing reactive maintenance with scheduled interventions. A physics-based workflow in Oman reduced well costs by 20% and cut drilling duration by 27% by optimizing rotary steerable system parameters in real-time. TotalEnergies' predictive models also reduced unexpected downtime, while YPF applied machine learning across thousands of onshore assets to drive repeatable savings into core operational metrics. Such successes confirm that the digital oilfield services market is evolving from efficiency pilots to enterprise-wide programs that embed costs permanently.
Growing Investments in Shale & Tight-Oil Development
Horizontal wells drilled in US shale provinces are 30% faster than pre-digital baselines thanks to AI trajectory engines that eliminate thousands of manual inputs per stand. Nabors Industries demonstrated a 30% speed increase with auto-driller algorithms that learn formation responses in real-time. ConocoPhillips has collapsed non-operated asset decision cycles in the Permian from several days to mere hours, allowing commercial teams to capture 30-day opportunity windows that previously lapsed. Autonomous robots and remote steam-assisted gravity drainage platforms are redefining once-manual heavy-oil tasks and yielding 25-50% cost reductions according to field studies. Capital discipline in tight-oil acreage is driving the further deployment of sensors. Operators that digitize rigs and wellheads capture performance gains simultaneously across tens of wells, reinforcing economies of scale.
Edge-AI-Based Predictive Maintenance for ESPs
Unexpected ESP failures can sideline individual wells for weeks, and with 150,000 units in service, the production stakes are material. Low-power edge devices mounted on downhole cables classify dynagraph signatures locally, flagging anomalies even when satellite links drop. Machine-learning models dispatched at the wellhead provide a 12-day warning of impending failures, empowering field teams to schedule replacements without lost barrels. High-frequency vibration and amperage datasets are fused with reservoir parameters to refine performance envelopes under corrosive conditions. Deploying these algorithms at network boundaries forms closed-loop optimization frameworks that autonomously tune pump speed within safe operating zones.
Restraints Impact Analysis of Digital Oilfield Services Market*
| Restraint | (~) % Impact on CAGR Forecast | Geographic Relevance | Impact Timeline |
|---|---|---|---|
| Cyber-security risks across OT/IT stacks | -0.80% | Global, with highest concern in North America & Europe | Short term (≤ 2 years) |
| Digital-skills gap in brown-field assets | -0.60% | Global, particularly acute in mature regions | Medium term (2-4 years) |
| Data-sovereignty laws slowing cloud roll-outs | -0.40% | Europe, Asia-Pacific, with spillover effects globally | Medium term (2-4 years) |
| High power draw of real-time analytics at remote sites | -0.30% | Global, most critical in offshore & remote onshore locations | Long term (≥ 4 years) |
| Source: Mordor Intelligence | |||
Cyber-security Risks Across OT/IT Stacks
The Colonial Pipeline ransomware event underscored the scale of risk facing converged OT networks.[3]Cloud Security Alliance, “Pipeline Cyber Threats,” cloudsecurityalliance.orgAlthough 90% of energy firms now employ dedicated security teams and 25% tie CEO compensation to cyber targets, only two-thirds systematically back up field data. Insurance premiums surged 315% between 2020 and 2022, yet only 67% of operators carry standalone cyber coverage, opting instead to bet on hardening budgets. Legacy programmable-logic controllers lack modern authentication, and as air-gapped systems are increasingly bridged to enterprise clouds for remote surveillance, this vulnerability becomes more pronounced. Deloitte warns that security must be embedded early in project lifecycles; bolt-on approaches often leave threat vectors unaddressed, exposing companies to production outages and reputational harm.
Digital-Skills Gap in Brown-Field Assets
Automation in the oil & gas industry still lags behind most other heavy industries, and the retirement of senior specialists widens the talent gap.[4] Manhattan Institute, “Automation and the Skills Gap,” manhattan-institute.org The UK upstream sector alone estimates a need for 25,000 recruits by 2025, many in analytics, AI, and cybersecurity. Competency programs now blend e-learning, simulation, and mentoring to cross-skill geoscientists, production engineers, and IT staff. Integrated OT-IT security demands collaboration between two historically siloed teams, yet fewer than half of organizations have formal joint governance models. Remote operations centers also require workforce redesign: tasks once handled offshore must be remapped for onshore monitoring roles, with competency management systems tracking individual progress.
*Our forecasts treat driver/restraint impacts as directional, not additive. The impact forecasts reflect baseline growth, mix effects, and variable interactions.
Digital Oilfield Services Market Segment Analysis
By Process Type:
Production Focus Drives GrowthIn 2025, reservoir optimization captured 40.62% of revenue, confirming its foundational role in extending field life. Production optimization, however, is on track to record a 6.18% CAGR and will absorb a growing share of the digital oilfield services market size between 2026 and 2031. Multivariate allocation engines match real-time pressure data with physics-based models to allocate production fluid streams and identify underperforming zones. Digital twins of gathering networks execute gas-lift optimization every few seconds, delivering sustained output uplifts of 3% compared to natural-gas baselines, with a coefficient of 3.1%. Closed-loop controls that integrate reservoir simulators and surface choke settings automatically adjust rates, aligning daily operations with reservoir management objectives.
The transition toward production-centric spending reflects a plateau in green-field drilling campaigns and a push to raise returns on existing well stock. Autonomous choke management mitigates slugging, while virtual flow meters enable asset teams to reduce the need for physical well tests. Operators also scale digital twins across facilities to coordinate pumps, separators, and energy systems, thereby reducing emissions while minimizing downtime. As a result, the digital oilfield services market aligns with the challenges of mature fields rather than exploration risk.



By Technology:
Cloud Security Accelerates AdoptionIoT sensors and edge devices accounted for the largest 29.55% of 2025 revenue, yet cloud and cybersecurity software is forecast to expand at an 8.12% CAGR, the swiftest pace in the digital oilfield services market. Microsoft Azure Stack, deployed on offshore installations, enables operators to process drilling and production data on the rig while synchronizing critical subsets to hosted analytics environments once bandwidth becomes available. Edge-cloud pairing addresses latency limits and complies with data-residency regulations by keeping sensitive datasets local, thereby ensuring data security and compliance.
Zero-trust architectures underpin these migrations as threat actors increasingly target industrial control layers. Vendors now bundle network micro-segmentation, identity governance, and encryption into turnkey offerings that tie directly into real-time historians. AI-enabled event correlation shortens detection-to-response cycles from hours to minutes, protecting revenue-critical operations. This nexus of scalable processing power and ironclad security is steering technology budgets toward managed platforms, thereby reinforcing the digital oilfield services market’s software-defined trajectory.
Geography Analysis
North America Digital Oilfield Services Market
North America’s leadership derives from its unconventional resource scale, advanced sensor density, and regulatory incentives for methane monitoring. Nabors’ automated rig systems improved drilling penetration rates by 30% and significantly reduced slide sheety, setting the standard for high-frequency data capture. Canada extends digital adoption to oil sands, using hyperspectral analytics to monitor tailings ponds and comply with emerging methane caps, while Mexico tests AI-enabled geosteering in deepwater Campos Basin blocks. Mandatory reporting under the EPA’s Super-Emitter program prompts operators to adopt continuous methane surveillance and digital twins that identify leaks within minutes.
APAC and Middle East Digital Oilfield Services Market
The Asia-Pacific region is emerging as the fastest-growing market for digital oilfield services. China’s intelligent drilling pilots have reduced directional-drilling cycle times by double-digit percentages, supported by national funding for supercomputing clusters. India’s upstream firms are investing in cloud-hosted production surveillance, while Japan’s majors are piloting remote inspection robots on mature offshore assets. The UAE and Saudi Arabia deploy private 5G networks that transmit sub-second well data to centralized AI engines, enabling autonomous gas-lift optimization at scale.
EMEA and South America Digital Oilfield Services Market
Europe leans on digital tools to meet decarbonization targets. Equinor’s North Sea platforms utilize autonomous inspection robots connected to data-fusion hubs developed by Cognite, resulting in reduced offshore crew days and associated emissions. Carbon-capture monitoring relies on subsurface digital twins that track plume migration and ensure wellbore integrity in real time. South America leverages technology transfer from North America, with Argentina’s Neuquén Basin operators deploying edge analytics to navigate sand and water-cut challenges. The Middle East and Africa focus on mature-field digitization: ADNOC’s RoboWell solution autonomously regulates gas lift to sustain five-figure barrel yields, while Nigeria pilots cloud-based drilling analytics to tackle hard-to-reach delta reservoirs.

Regulatory Landscape
Regulation is increasingly shaping digital oilfield deployments through methane measurement, data-governance, and offshore operational integrity requirements. In the European Union, the European Commission published its Strategic Roadmap for Digitalisation and AI in the Energy Sector in June 2026, which points to tighter expectations around energy data integration, deployment of digital and AI solutions, and clearer data-governance practices across the energy value chain. For upstream operators, these requirements can affect how operational datasets are standardized and shared.
In the United States offshore market, the Bureau of Safety and Environmental Enforcement updated the compliance environment for digital measurement and safety by incorporating additional production measurement and safety standards into 30 CFR Part 250, effective in August 2026. Alongside ongoing expectations under 30 CFR Part 250 Subpart H for production safety systems, these updates continue to support demand for verifiable, standards-aligned instrumentation, audit-ready digital records, and cyber-aware architectures that help operators demonstrate operational integrity.
Competitive Landscape
Competition in the digital oilfield services market is intensifying as traditional service giants converge with automation specialists and software pure-plays. SLB’s USD 7.1 billion buy-out of ChampionX in 2025 created the sector’s largest integrated production-solutions portfolio and is projected to generate USD 400 million in pretax synergies within three years. Halliburton advances its intelligent fracturing suite through closed-loop completions that automatically tune energy delivery; its OCTIV Auto Frac product has already executed thousands of autonomous decisions per stage in Colorado pilots. Baker Hughes focuses on electrification and AI-infused production systems, launching Hummingbird electric cementing and SureCONTROL Plus interval valves that reduce emissions and downtime.
Industrial automation vendors, such as Emerson, Honeywell, and Siemens, are defending their market positions by integrating advanced process controllers with edge AI packages. Emerson’s Project Beyond links disparate control layers into a unified software-defined environment underpinned by zero-trust security, targeting brown-field upgrades where legacy systems impede analytics. Data platform specialists Cognite, AVEVA, and AspenTech compete on open APIs that enable producers to build bespoke machine-learning pipelines without re-architecting underlying data models. Robotics start-ups form alliances with established players. Rockwell Automation’s partnership with Taurob for ATEX-certified inspection robots demonstrates how a niche capability can unlock broader market opportunities. Overall, vendors able to blend deep domain knowledge with cutting-edge AI remain best placed to capture a market shifting toward autonomous operations and pay-per-use commercial models.
Digital Oilfield Services Industry Leaders
Halliburton Company
Baker Hughes Company
Emerson Electric Co.
Weatherford International PLC
Schlumberger Limited
- *Disclaimer: Major Players sorted in no particular order

Digital Oilfield Services Market Companies Covered in this Report
- Schlumberger Limited
- Halliburton Company
- Baker Hughes Company
- Weatherford International PLC
- Emerson Electric Co.
- Siemens Energy AG
- Rockwell Automation Inc.
- Honeywell International Inc.
- Kongsberg Gruppen ASA
- Pason Systems Inc.
- Accenture PLC
- IBM Corporation
- Cognite AS
- AVEVA Group plc
- Aspen Technology Inc.
- Petrofac Ltd.
- National Oilwell Varco (NOV)
- ChampionX Corporation
- Honeywell Process Solutions
- ABB Ltd.

Market Opportunities and Future Outlook
Large-scale automation and platform rollouts are creating whitespace for vendors that can operationalize AI beyond pilots, particularly where integration across subsurface, drilling, and production data remains fragmented. In April 2026, Baker Hughes reported deployment of its Leucipa field production automation software across about 75,000 wells globally, showing that production automation has moved into multi-asset scale and creating opportunities around change management, workflow standardization, and interoperability layers that connect wellsite controls to enterprise planning.
Investment in compute and domain-specific models is also becoming a more tangible buying trigger for seismic interpretation, reservoir modeling, and real-time optimization. In May 2026, Aramco and solutions by stc announced a next-generation high-performance supercomputer project (SAR 1.4 billion), while SLB and Vår Energi expanded the Delfi digital platform footprint on the Norwegian Continental Shelf in May 2026 for integrated field development planning. Together, these initiatives support opportunities in cloud-native data foundations, OSDU-aligned data management, and secure edge-to-cloud architectures that address data-sovereignty and cybersecurity constraints, enabling closed-loop automation such as Halliburton and Eni’s closed-loop rig automation and MPD deployment in Indonesia (July 2026).
Recent Industry Developments in Digital Oilfield Services Market
- July 2026: Halliburton and Eni completed a closed-loop rig automation and managed pressure drilling (MPD) deployment on a deepwater exploration well in Indonesia. The project integrated automation with real-time well control to improve drilling efficiency, illustrating how closed-loop workflows are moving into complex offshore environments. It also raises the bar for integrated software, controls, and services delivery.
- June 2026: SLB launched the SLB Digital Marketplace with around 200 digital products, including AI agents and domain models for energy workflows. The marketplace approach broadens distribution for digital capabilities across the SLB ecosystem and supports platform-based procurement. This increases competitive pressure on point-solution vendors to integrate and package offerings for scale.
- June 2025: Chevron and Halliburton executed intelligent hydraulic fracturing in Colorado using ZEUS IQ and OCTIV Auto Frac to enable real-time completion feedback and autonomous adjustments. The deployment highlighted a shift toward automated decision loops at the wellsite. It reinforced demand for instrumentation, low-latency analytics, and secure data pipelines that support continuous optimization.


Digital Oilfield Services Market Report Scope and Research Methodology
Market Definition and Coverage
This market covers the revenues earned from services that help upstream oil and gas operators run fields using digital tools, which mainly includes sensing, connectivity, data platforms, analytics, and workflow support across the life of a producing asset.
Scope exclusions: This sizing does not count pure equipment sales or general IT outsourcing when it is not tied to an oilfield digitalization use case.
Segments Covered in This Report
- By Process Type
- Reservoir Optimisation
- Production Optimisation
- Drilling Optimisation
- Other Processes
- By Technology
- IoT Sensors and Edge Devices
- AI and Machine Learning
- Digital Twin
- Big-Data and Advanced Analytics Platforms
- Cloud and Cyber-security
- Geography
- North America
- United States
- Canada
- Mexico
- Europe
- Germany
- United Kingdom
- Italy
- Norway
- Russia
- Rest of Europe
- Asia-Pacific
- China
- India
- Japan
- South Korea
- ASEAN Countries
- Australia
- Rest of Asia-Pacific
- South America
- Brazil
- Argentina
- Rest of South America
- Middle East and Africa
- Saudi Arabia
- United Arab Emirates
- Qatar
- Nigeria
- Rest of Middle East and Africa
- North America
Data Sources, Market Sizing, and Validation
Desk Research
Desk work starts with building a fact base for upstream activity and digital adoption signals, so the model has practical anchors before assumptions are applied. We typically pull public statistics and references such as EIA and IEA supply and upstream indicators, OPEC market updates, US Bureau of Labor Statistics cost and wage series, and macro data from the World Bank and IMF to map the operating environment.
We then map how spending tends to flow into digital oilfield programs using sources such as company annual reports, investor presentations, project press releases, regulatory filings, and industry association publications that discuss automation and monitoring trends. Where needed, we also use paid subscriptions for company financials and intelligence, news and financials, patent databases, and a global contracts and tenders view to understand who is active and which project types are being announced. The desk sources listed here are illustrative only, and additional public and paid references were reviewed during data collection and cross-checking.
Primary Interviews and Surveys
Fieldwork is used to pressure test what we saw in desk research and to translate activity signals into realistic spending shares by service area. We spoke with upstream operators, service providers, and system integrators across the value chain, and we checked the inputs across major regions to avoid overstating regional adoption speed or project timing.
Distribution of primary research fieldwork respondents
| Company type | Respondent position | Region |
|---|---|---|
| Top tier: 29% | CXOs: 16% | APAC: 48% |
| Mid tier: 50% | Functional/Unit leaders: 39% | EMEA: 33% |
| Smaller Players: 21% | Managers: 45% | Americas: 19% |
Market-Sizing & Forecasting
The main sizing is built using top-down and bottom-up logic together, where upstream activity and digitalization penetration are used to reconstruct the addressable spending pool, and then it is split into service revenue that is actually delivered. To keep totals realistic, we cross-check the output with selective bottom-up approximations such as sampled contract values, typical pricing ranges for monitoring and analytics support, and supplier-side revenue splits where disclosures are available.
In the model, a few inputs drive most of the outcome, so we emphasized indicators like upstream capex trends, active rig and well counts, the share of production under real-time monitoring, the pace of cloud and edge deployment in field operations, and cybersecurity and data management requirements that support recurring service work. Where a bottom-up check has gaps, for example private firms with limited disclosure, we fill the missing piece using peer benchmarks and then adjust it back after primary feedback confirms the likely range.
For forecasting, scenario analysis is used so the outlook can reflect changes in oil price sentiment, operator spending discipline, and the timing of digital program rollouts. Those scenarios are then aligned to what interviewees expect for project pipelines and renewal behavior, which keeps the forecast tied to what can be executed in the field.
Data Validation & Update Cycle
Validation is done in layers so the final number does not depend on a single assumption. We compare model outputs against independent signals such as upstream capex direction, service intensity per producing asset, and regional activity patterns, and then we re-check any large jumps that do not match those signals.
Before sign-off, the work is reviewed across steps, including currency conversion timing, scope boundaries, and year-on-year growth logic. Analysts may re-contact respondents when a key ratio looks off. Reports are refreshed annually, with interim updates when material events occur, and a final pre-delivery pass is completed so the client receives the latest view.
Mordor Intelligence's Digital Oil Field Services Market Estimate Compared With Other Published Estimates
Published market sizes for digital oilfield services can differ even when the same label is used, because the line between services, software, and equipment is not always drawn the same way. Differences also come from how firms treat bundled contracts, what upstream phases are included, and whether the figures are reported in current dollars or under adjusted assumptions.
By tracking contract scope language, currency timing, and service-only revenue recognition rules, Mordor Intelligence keeps the estimate tied to delivered digital oilfield services rather than broader digital oilfield spending, which is where the biggest spread typically starts in this market.
Benchmark comparison
| Source | Market Size | Gaps in Research Methodology |
|---|---|---|
| Mordor Intelligence | USD 31.18 B (2025) | |
| Industry Research Publisher A | USD 21.12 B (2025) | Uses a narrower counting approach that appears to limit the scope closer to specific optimization workflows and may exclude several recurring service lines tied to data platforms and field connectivity support, which reduces the 2025 total. |
| Industry Research Publisher B | USD 27.34 B (2025) | Likely applies a different boundary on what is treated as a service versus bundled technology, and the assumed adoption pace and pricing progression appears more aggressive into the forecast window, which can change the starting year estimate as well. |
Overall, the gap between the three values is mostly explained by scope cut lines and how bundled digital programs are separated into service revenue. When the same activity signals are translated into revenue using consistent service definitions and repeatable checks, the result is easier to trace and update year after year.


Key Questions Answered in the Report
What is the projected size of the digital oilfield services market by 2031?
The market is forecast to reach USD 43.37 billion by 2031 on a 5.63% CAGR over 2026-2031.
Which process segment is expanding the fastest?
Production optimization is expected to post the quickest 6.18% CAGR through 2031, reflecting rising investment in asset-performance maximization.
Why is Asia-Pacific the fastest-growing region?
Government AI strategies, national digital-infrastructure funding and large-scale automation programs such as ADNOC’s USD 920 million initiative accelerate adoption.
How are cyber-security concerns influencing purchasing decisions?
Operators increasingly demand zero-trust cloud platforms and micro-segmented OT networks, propelling growth in the cloud and cyber-security technology segment.
What impact will the SLB-ChampionX deal have on competitive dynamics?
The merger creates the largest integrated production-solutions portfolio and is projected to generate USD 400 million in annual synergies, intensifying competition among service majors.
How does predictive maintenance improve electric submersible pump uptime?
Edge-AI models analyse vibration and electrical signatures to forecast failures up to 12 days ahead, enabling planned interventions that prevent deferred production.
Page last updated on:


 Your data is secure and never sold or shared.


