
Market Overview
| Study Period | 2020 - 2031 |
|---|---|
| Market Size (2026) | USD 25.09 Billion |
| Market Size (2031) | USD 71.64 Billion |
| Growth Rate (2026 - 2031) | 23.35 % |
| Fastest Growing Market | Asia-Pacific |
| Largest Market | North America |
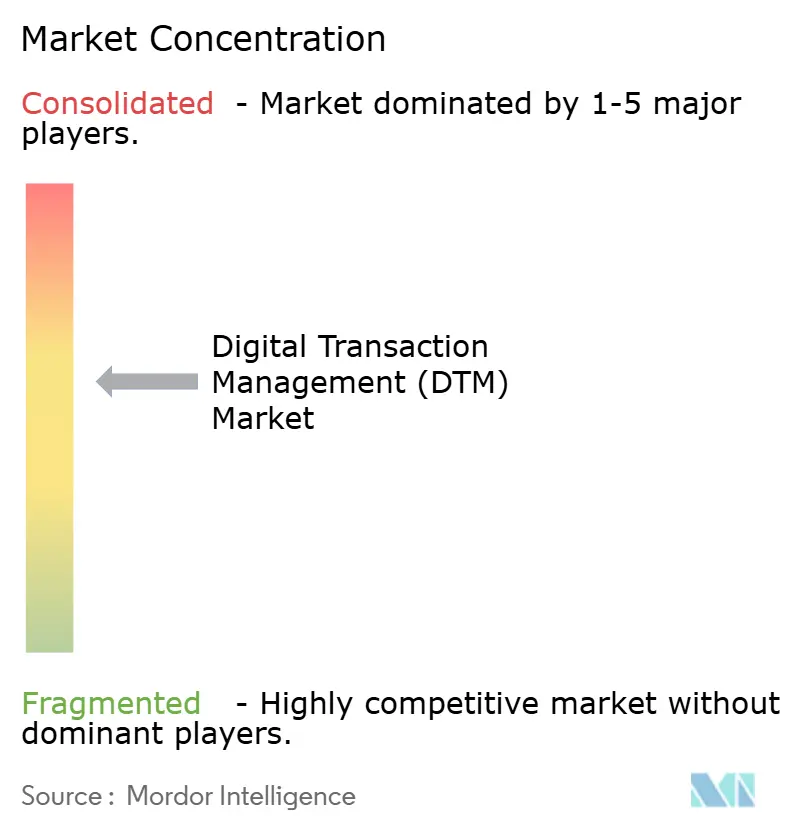
| Market Concentration | Medium |
Major Players *Disclaimer: Major Players sorted in no particular order Image © Mordor Intelligence. Reuse requires attribution under CC BY 4.0. | |
Digital Transaction Management (DTM) Market Analysis by Mordor Intelligence
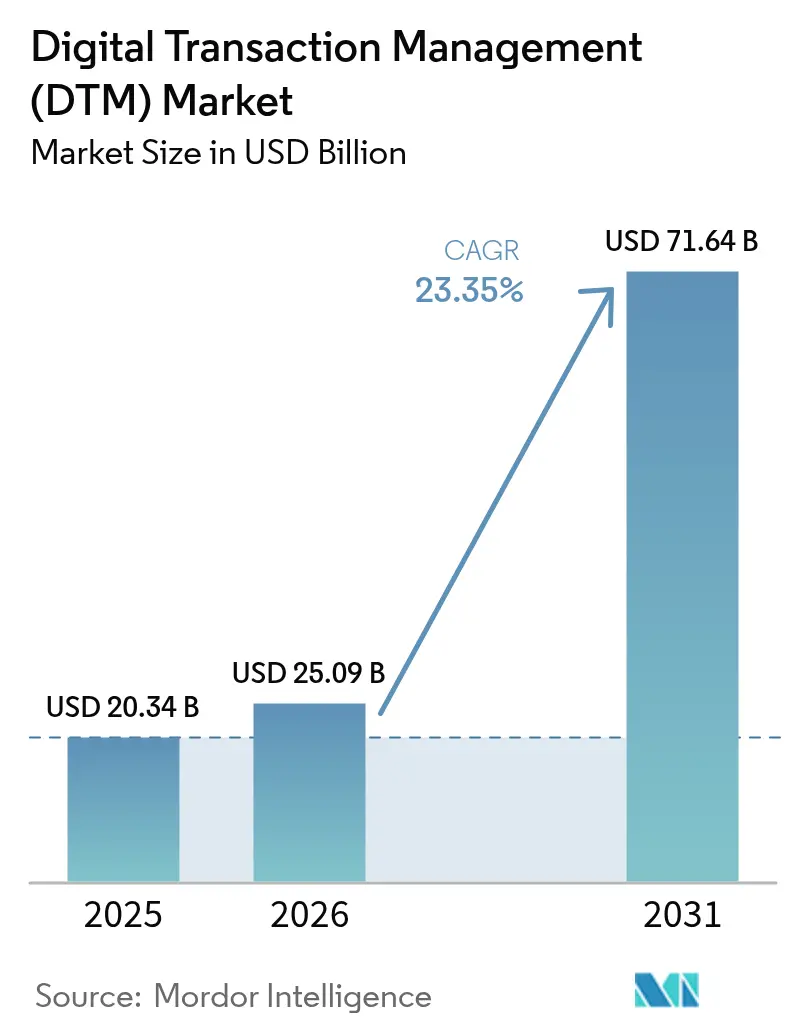
The digital transaction management market size was valued at USD 20.34 billion in 2025 and estimated to grow from USD 25.09 billion in 2026 to reach USD 71.64 billion by 2031, at a CAGR of 23.35% during the forecast period (2026-2031). Investors view this trajectory as evidence that organizations now treat digital workflows as part of core strategy rather than back-office optimization. Accelerated deployment of blockchain for tamper-proof audit trails, rapid adoption of remote-work policies that favor cloud delivery, and a steady rise in generative-AI document tools collectively reinforce demand. Cyber-regulation alignment most notably HIPAA, GDPR, and eIDAS further legitimizes solutions that guarantee data integrity, identity assurance, and global enforceability.
Key Report Takeaways
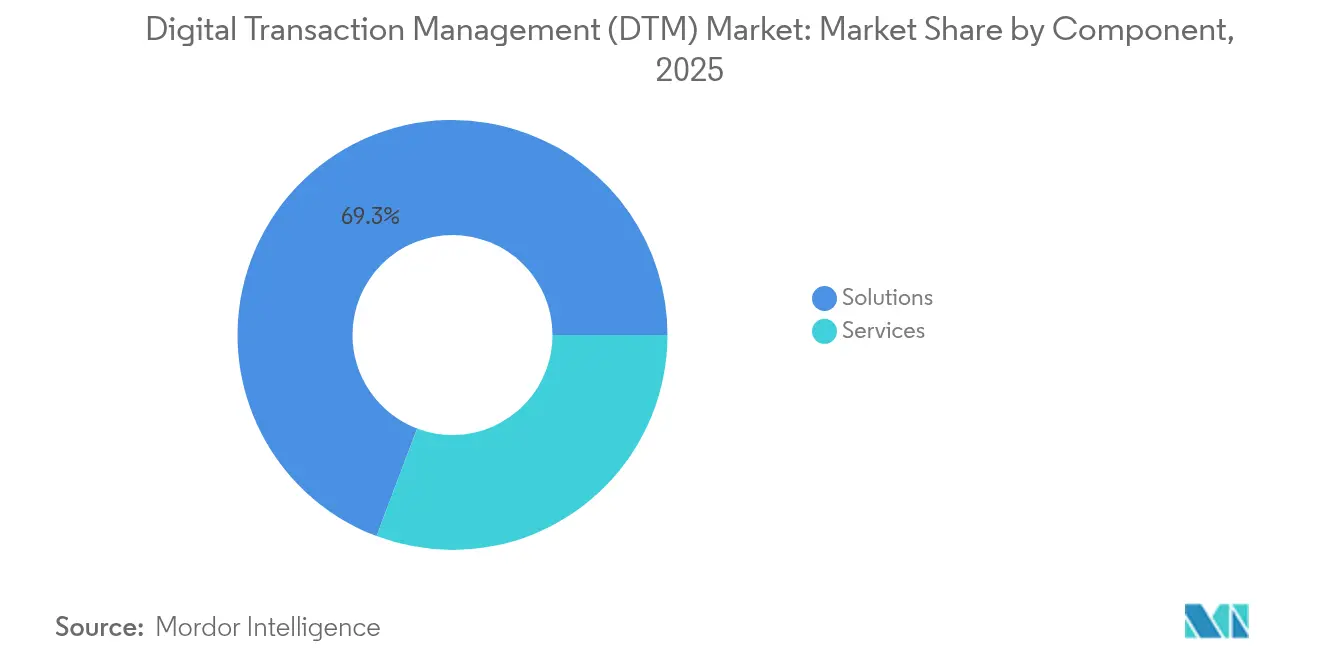
- By component, Solutions led with 69.25% revenue share in 2025, while Services are forecast to expand at a 27.62% CAGR to 2031.
- By deployment mode, cloud captured 75.40% of the digital transaction management market share in 2025 and is advancing at a 25.6% CAGR through 2031.
- By organization size, large enterprises commanded 59.30% of the digital transaction management market size in 2025; SMEs are projected to grow at 26.8% CAGR between 2026-2031.
- By end-user industry, BFSI held 25.60% of the digital transaction management market in 2025; healthcare and life sciences is the fastest mover at a 27.4% CAGR to 2031.
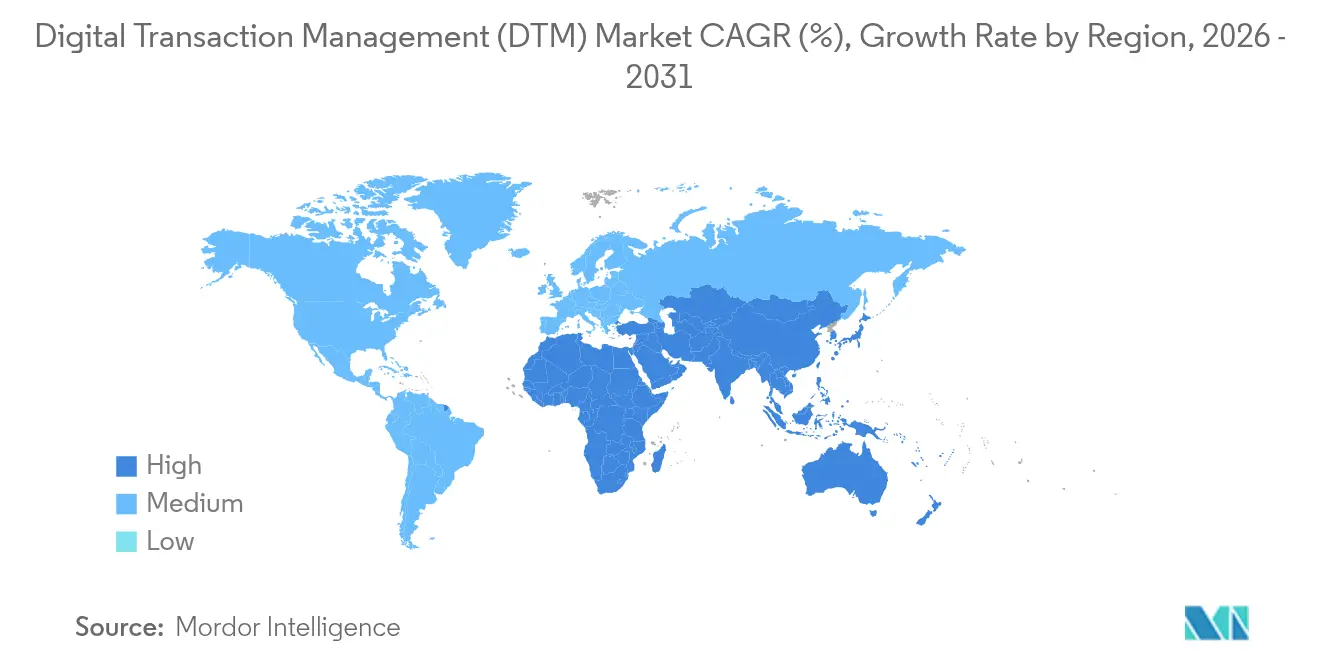
- By geography, North America maintained leadership with a 29.85% share in 2025; Asia-Pacific is forecast to deliver the highest 27.8% CAGR over the same period.
Note: Market size and forecast figures in this report are generated using Mordor Intelligence’s proprietary estimation framework, updated with the latest available data and insights as of 2026.
Market Trends and Insights
Drivers Impact Analysis of Digital Transaction Management (DTM) Market*
| Driver | (~) % Impact on CAGR Forecast | Geographic Relevance | Impact Timeline |
|---|---|---|---|
| Accelerating E-Signature Adoption Across Regulated Industries | +5.2% | Global, with significant impact in North America and Europe | Medium term (2-4 years) |
| Shift Toward End-to-End Contract Lifecycle Automation in BFSI and Government | +4.8% | North America, Europe, developed APAC | Medium term (2-4 years) |
| Mandatory Remote-Work Compliance Spurring Cloud-Based DTM Uptake | +3.7% | Global | Short term (≤ 2 years) |
| Generative-AI Assistants Reducing Document Turn-Around Times | +4.3% | North America, Europe, developed APAC | Medium term (2-4 years) |
| Click-Wrap Acceptance Driving E-Commerce Conversion in Asia | +2.9% | Asia-Pacific, with spillover to Middle East | Medium term (2-4 years) |
| Digital Identity Frameworks (eIDAS 2.0, Aadhaar, NID) Catalyzing Adoption | +3.1% | Europe, India, Southeast Asia | Long term (≥ 4 years) |
| Source: Mordor Intelligence | |||


Accelerating E-Signature Adoption Across Regulated Industries
U.S. election rules now allow e-signatures in 43 states, and the Department of Transportation is finalizing amendments that treat electronic attestations as legally valid for drug-testing records. [1]National Association of Secretaries of State, “States Embrace E-Signatures to Support Secure and Convenient Elections Process,” nass.org These precedents demonstrate how statutory openness removes residual skepticism, letting enterprises shorten document cycles by 75% while maintaining compliance. Large health providers, for example, rely on qualified electronic signatures to synchronize cross-state consent forms without postal delays, thereby elevating patient satisfaction and trimming administrative overhead.
Shift Toward End-to-End Contract Lifecycle Automation in BFSI and Government
Banks process more than 20,000 active contracts simultaneously, exposing them to revenue leakage of up to 9% when oversight is weak. The rollout of blockchain-backed Citi Token Services shows how real-time settlement can shrink operational risk and unlock working-capital benefits for treasurers. [2]Citi, “Citi Transforms Transaction Banking Services with Besu,” lfdecentralizedtrust.org Government agencies follow suit by centralizing procurement documents into searchable repositories, enabling near-instant policy audits and mitigating fraud. Together, these moves underscore why holistic automation—beyond simple e-signatures—is becoming mandatory budgeting line-item for CIOs.
Generative-AI Assistants Reducing Document Turn-Around Times
Adobe’s and Microsoft’s co-engineered plug-ins now embed summarization, clause extraction, and Liquid Mode reformatting inside Office workflows. OpenKM’s AI classification injects similar speed into back-file conversion projects, reducing costly manual indexing (openkm.us). Omega Healthcare processed 60 million transactions with UiPath, proving AI’s capacity to maintain accuracy at scale, an attribute critical for heavily audited industries (omegahms.com). As these functionalities stabilize, procurement teams report 33% faster approvals and markedly lower exception rates.
Digital Identity Frameworks Catalyzing Adoption
Europe’s forthcoming EU Digital Identity Wallet and India’s Aadhaar system both standardize credential verification across borders, allowing businesses to satisfy KYC in minutes rather than days. [3]World Bank, “Identification for Development (ID4D) Workshop,” id4d.worldbank.org For remittance corridors, portable IDs drive fee transparency and customer trust, which in turn encourages fintechs to embed the digital transaction management market into consumer apps. The long-term effect is that seamless identities remove friction in e-signing and cross-platform document workflows, lifting global adoption trajectories.
Restraints Impact Analysis of Digital Transaction Management (DTM) Market*
| Restraint | (~) % Impact on CAGR Forecast | Geographic Relevance | Impact Timeline |
|---|---|---|---|
| Complex Cross-Border Crypto-Signature Regulations | -2.7% | Global, with particular impact in EU-UK-US corridors | Medium term (2-4 years) |
| High Cost of Qualified Remote ID Assurance in Emerging Markets | -2.1% | Emerging Asia, Africa, Latin America | Medium term (2-4 years) |
| Fragmented Legacy Core-Banking Workflows Hindering Full Automation | -1.9% | Global, with higher impact in established banking markets | Long term (≥ 4 years) |
| Limited 5G / Edge Infrastructure in Rural Areas Slowing Mobile DTM Usage | -1.6% | Rural regions across all continents | Short term (≤ 2 years) |
| Source: Mordor Intelligence | |||
Complex Cross-Border Crypto-Signature Regulations
eIDAS assigns top evidentiary weight to Qualified Electronic Signatures, yet mutual recognition outside the EU remains uneven (helpx.adobe.com). Additionally, data sovereignty mandates such as GDPR conflict with extraterritorial requests under the US CLOUD Act (isaca.org). This patchwork raises legal counsel costs and elongates go-to-market plans for providers trying to support multinational workflows, therefore tempering the digital transaction management market’s near-term acceleration.
Limited 5G / Edge Infrastructure in Rural Areas Slowing Mobile DTM Usage
Fintech applications operating on high-speed 5G links can settle trades at 10 Gbps with stronger end-point encryption. Yet many rural districts still depend on 3G or early-generation LTE, delaying adoption of mobile notarization and field-service signing. Providers must therefore invest in offline caching and hybrid networks, adding complexity and cost that modestly suppress overall growth until infrastructure spreads.
*Our forecasts treat driver/restraint impacts as directional, not additive. The impact forecasts reflect baseline growth, mix effects, and variable interactions.
Digital Transaction Management (DTM) Market Segment Analysis
By Component:
Services Outpace Solutions GrowthSolutions generated 69.25% of 2025 revenue, but services are forecast to expand at a 27.62% compound rate to 2031, the highest within the digital transaction management market. Financial institutions upgrading legacy stacks often lack in-house regulatory expertise, fueling demand for integration, compliance, and managed support. Example engagements in 2024 reduced processing errors and operating expense when consultancy teams unified e-signature workflows with core banking ledgers.
The solutions category is not stagnant; blockchain modules embed immutable audit trails while AI classification automates data capture. Vendors release vertical-specific templates that satisfy HIPAA and SOC 2 out-of-the-box, shortening time-to-value for healthcare and finance clients. Nevertheless, the intricate nature of mission-critical workflows implies ongoing reliance on external specialists, which sustains the services revenue curve.


By Deployment Mode:
Cloud Dominance AcceleratesCloud platforms held 75.40% share in 2025, and their 25.6% CAGR means the digital transaction management market size for cloud deployments could double well before 2031. Enterprises value subscription pricing, rapid provisioning, and certified data centers that pass ISO 27001 and FedRAMP audits. Multi-cloud architectures now route sensitive data to local sovereign clouds while reserving burst capacity on public infrastructure, balancing agility with compliance.
On-premise installations still exist for defense, critical infrastructure, and select financial institutions, yet even these buyers adopt hybrid control planes that mirror cloud features behind the firewall. As encryption key management, confidential computing, and zero-trust frameworks mature, resistance to full cloud conversion will erode, maintaining the upward bias in cloud uptake.
By Organization Size:
SMEs Closing the Adoption GapLarge enterprises commanded 59.30% revenue in 2025, but SMEs are tracking a 26.8% CAGR that outpaces bigger rivals. Studies show SMEs that digitized invoices saw a 29% acceleration in receivables and a 45% fall in overdue payments (jetir.org). Low-code configurators and freemium price tiers lower entry barriers, while payment brands report that 70% of Asia-Pacific SMEs boosted turnover after implementing digital methods (visa.com). As a result, the digital transaction management market will witness a flatter adoption curve across company sizes by 2030.
Challenges persist—budget limits, staff skill gaps, and cultural conservatism. Targeted incubator programs now bundle training, compliance guides, and small-ticket financing to de-risk first projects. Vendors aligning with sustainable resilience strategies and entrepreneurial-orientation frameworks help SMEs build confidence, thereby reducing churn and bolstering lifetime value.

By End-User Industry:
Healthcare Disrupts BFSI DominanceBFSI retained 25.60% revenue share in 2025, underpinned by regulatory dictates for unbroken audit trails and secure archival. Banks have begun embedding AI-driven clause analytics to flag risk and ensure post-signature obligations. Yet the digital transaction management market size in healthcare is projected to grow the fastest, leaping at a 27.4% CAGR to 2031. Research published in Nature confirms that blockchain-based health-record systems improve data integrity while maintaining patient ownership. Providers also turn to robotic process automation for benefits authorization, demonstrating tangible savings.
Retail, e-commerce, public sector, IT-telecom, and education follow with domain-specific volumes. Education administrators adopt contract lifecycle tools for grants, endowments, and vendor agreements, clarifying spending oversight without expanding staff. Such vertical diffusion confirms the cross-industry relevance of mature DTM frameworks.
Geography Analysis
North America Digital Transaction Management (DTM) Market
North America generated 29.85% of digital transaction management market revenue in 2025. Mature legal clarity around electronic records encourages both private-sector and federal adoption. The U.S. Department of Transportation’s pending rule on electronic drug-testing forms demonstrates continuous regulatory reinforcement of digital trust (federalregister.gov). Healthcare compliance roadmaps in the United States similarly accelerate usage, as providers exploit HIPAA-compatible e-signature stacks to streamline claims (iclg.com). Technology vendors headquartered in the region continue to roll out AI features that differentiate service quality and justify premium licensing.
APAC Digital Transaction Management (DTM) Market
Asia-Pacific is the fastest-growing arena with a 27.8% CAGR. The region processes more than half of the world’s digital payments, and B2C e-commerce is projected to exceed EUR 4 trillion (USD 4.3 trillion) by 2027 (tmcnet.com). India’s Unified Payments Interface aims beyond 200 billion annual transactions, intensifying demand for scalable signature engines. Hospitality, logistics, and public administration segments likewise embrace digital contracts to keep pace with a mobile-first consumer base. Regulatory heterogeneity remains, yet countries such as Indonesia recognize digital contracts provided core consent principles are satisfied (mondaq.com), signaling gradual convergence.
EMEA and LATAM Digital Transaction Management (DTM) Market
Europe benefits from the harmonized eIDAS regime, where qualified electronic signatures hold equivalence with handwritten ones (helpx.adobe.com). The forthcoming eIDAS 2.0 provisions and the EU Digital Identity Wallet promise seamless cross-border signing, reinforcing market confidence. Latin America and the Middle East and Africa record smaller baselines but high growth rates. Government digitization programs in Brazil and Gulf economies, coupled with expanding broadband access, create favorable conditions for the digital transaction management industry in those territories.

Regulatory Landscape
Regulation continues to validate DTM as a compliance-grade alternative to paper, but obligations are tightening around identity proofing, signature format standardization, and cross-border trust. In the European Union, eIDAS 2.0 implementation is being operationalized through implementing acts, including Implementing Regulation (EU) 2026/248 on standard formats for advanced electronic signatures and seals used by public sector bodies, and Implementing Regulation (EU) 2026/798 specifying technical requirements for remote onboarding into the European Digital Identity (EUDI) Wallet aligned to ETSI TS 119 461. eIDAS 2.0 also includes a concrete timing anchor, requiring every Member State to provide at least one certified EUDI Wallet by December 2026, which increases demand for wallet-compatible signing, validation, and identity-assurance components.
Outside Europe, identity and payments governance is moving toward more explicit frameworks that influence DTM workflow design. In the United Kingdom, the Department for Science, Innovation and Technology moved the Digital Verification Services (DVS) Trust Framework to version 1.0 in 2026, reinforcing a structured assurance model for digital identity services that DTM vendors and relying parties can map into onboarding and signing journeys. In India, the Reserve Bank of India issued the Digital Payments E-mandate Framework, 2026 (effective April 21, 2026) to consolidate recurring-transaction rules, supporting standardized consent capture and auditability for mandate-based agreements in BFSI and subscription commerce flows.
Value Chain Analysis
The DTM value chain spans trust infrastructure inputs (PKI, certificate authorities, identity proofing, cryptographic modules and standards), platform and application layers (e-signature, CLM, workflow automation, audit trails, archiving), and downstream delivery (direct enterprise sales, cloud marketplaces, and system integrators embedding DTM into CRM/ERP/HCM and industry platforms). A key upstream dependency is regulated trust services, where qualified trust service providers and conformity-assessed components enable higher-assurance signatures, seals, timestamps, and validation, particularly in Europe under eIDAS-aligned schemes. Vendors increasingly assemble solutions using API-first microservices, combining signing, identity, and document intelligence into configurable workflow bundles rather than monolithic suites.
Bottlenecks cluster around compliance engineering and data residency. EU implementing requirements for remote qualified signature and seal creation devices (Commission Implementing Regulation (EU) 2025/1567, effective July 2025) and standards work such as ETSI TS 119 495 V1.8.1 (April 2026) for Open Banking-oriented certificate profiles push vendors to maintain fast update cycles across certificate, validation, and authentication components. On the infrastructure side, concentration of cloud and trust infrastructure in US and EU data centers, together with sovereignty constraints (for example, regional data-localization expectations), raises costs for global deployments and increases the role of partners that can provide local hosting, regulated identity proofing, and compliance attestation.
Competitive Landscape
Top Companies in Digital Transaction Management Market
Global competition shows moderate concentration. DocuSign, Adobe, and OneSpan anchor the top tier, complemented by regional specialists and cloud-native entrants. DocuSign’s Notary On-Demand addresses high-risk real-estate and automotive transactions, aiming to capture incremental fee revenue by streamlining remote notarization. Adobe’s push to support qualified signatures in all EU states aligns its roadmap with imminent regulatory needs, thereby defending share against European incumbents.
Midsized challengers differentiate through sector focus. eOriginal emphasizes digital original documents for secondary mortgage markets, evidenced by its selection to safeguard billions in e-notes. Entrust and Namirial package identity verification with signature controls, appealing to banking clients struggling with KYC obligations. Venture-backed disruptors add AI-first user experiences that decode document intent and auto-populate metadata, generating time savings marketing departments can quantify.
M&A remains an essential mechanism for capability build-out. Corporate development teams acquire AI startups to embed natural-language processing, while strategic alliances with hyperscale cloud providers secure distribution. Provider roadmaps center on three levers: AI for predictive insights, blockchain for integrity, and low-code configuration to widen addressable markets. Vendors that excel on all three dimensions will likely consolidate leadership through 2030.
Digital Transaction Management (DTM) Industry Leaders
DocuSign Inc.
Adobe Inc.
eOriginal, Inc.
OneSpan Inc.
Dropbox, Inc.
- *Disclaimer: Major Players sorted in no particular order
Digital Transaction Management (DTM) Market Companies Covered in this Report
- Adobe Inc.
- DocuSign, Inc.
- Dropbox, Inc.
- Nintex Global Ltd.
- Namirial S.p.A.
- OneSpan Inc.
- Wolters Kluwer N.V.
- Entrust Corporation
- SignEasy Inc.
- Mitratech Holdings Inc.
- Sertifi, Inc.
- Thales Group (Gemalto N.V.)
- Nitro Software Ltd.
- airSlate Inc.
- PandaDoc Inc.
- Conga (Apttus Corporation)
- Zoho Corporation Pvt. Ltd.
- ZorroSign, Inc.
- Topaz Systems Inc.
- InfoCert S.p.A.
- AssureSign LLC
- eOriginal, Inc.

Market Opportunities and Future Outlook
A primary whitespace is the shift from point e-signature to unified digital trust platforms that combine identity verification, cryptographic assurance, and long-term document integrity, especially for regulated and cross-border transactions. Europe is a concrete catalyst: the EUDI Wallet program under eIDAS 2.0, alongside 2026 implementing specifications for remote onboarding and signature/seal formats, creates a defined integration runway for vendors that can deliver wallet-compatible signing, verification, and audit evidence. That broadens opportunity for providers and partners across the trust chain, including qualified trust services, validation services, and onboarding/ID proofing capabilities packaged into end-to-end agreement workflows.
A second opportunity involves embedding agreement intelligence and automation directly into business systems, reducing reliance on standalone signing interfaces. In 2026, major vendor roadmaps and analyst coverage highlighted a move toward AI assistants and agent-based workflows in DTM, reinforcing demand for capabilities such as clause extraction, risk review, and automated routing tied to policy controls and audit trails. This supports integration-centric offerings (connectors, low-code orchestration, and APIs) as well as services-led engagements that retrofit DTM into legacy BFSI and government processes, where compliance mapping, data retention, and identity assurance are the gating factors.
Recent Industry Developments in Digital Transaction Management (DTM) Market
- June 2026: DocuSign announced availability of a DocuSign app within ChatGPT and Codex to manage agreements using natural-language prompts across drafting and workflow steps. The move targets faster agreement turnaround by meeting users inside widely adopted AI interfaces, while keeping signature and audit workflows anchored in DocuSign-controlled trust and evidence layers.
- July 2025: Namirial and Signaturit announced plans to join forces to form a larger European digital transaction management software platform, with Bain Capital and PSG Equity involved through their backing. The combination strengthens scale in a region shaped by eIDAS 2.0 and cross-border identity requirements, and it elevates competitive pressure on providers that lack pan-European trust-service depth.
- April 2024: DocuSign completed its acquisition of Lexion to expand intelligent agreement management capabilities beyond signing into contract lifecycle management. Adding AI-enabled contract data extraction and repository capabilities increases DocuSign’s ability to support end-to-end agreement workflows, raising the bar for rivals competing on lifecycle automation rather than standalone e-signature.


Digital Transaction Management (DTM) Market Report Scope and Research Methodology
Market Definition and Coverage
For this study, the digital transaction management (DTM) market covers software and related services that let organizations prepare, sign, authenticate, route, and store business documents and agreements electronically, with an auditable trail from start to finish.
Scope exclusions: This sizing does not count pure payment processing, standalone file storage, or generic collaboration tools unless they are sold and used specifically to complete and govern digital business transactions.
Segments Covered in This Report
- By Component
- Solutions
- Services
- By Deployment Mode
- Cloud
- On-premise
- By Organization Size
- Small and Medium Enterprises
- Large Enterprises
- By End-user Industry
- Banking, Financial Services and Insurance
- Healthcare and Life Sciences
- Retail and E-commerce
- Government and Public Sector
- IT and Telecommunications
- Education
- Other End-user Industries
- By Geography
- North America
- United States
- Canada
- Mexico
- Europe
- United Kingdom
- Germany
- France
- Italy
- Rest of Europe
- Asia-Pacific
- China
- Japan
- India
- South Korea
- Rest of Asia-Pacific
- South America
- Brazil
- Argentina
- Rest of South America
- Middle East
- United Arab Emirates
- Saudi Arabia
- Rest of Middle East
- Africa
- South Africa
- Rest of Africa
- North America
Data Sources, Market Sizing, and Validation
Desk Research
Desk research starts with building a clean view of the demand backdrop and the rule environment that shapes digital agreements. We referenced public sources such as US FTC and NIST guidance, the European Commission digital policy pages, and standards and trust frameworks from bodies like ISO and NIST, along with peer reviewed papers on e-signature and identity assurance.
To anchor commercial reality, we also reviewed company filings and earnings call commentary, investor presentations, product documentation, and reputable press coverage that describes contract workflow adoption and the security expectations buyers ask for. Where available, we used paid subscriptions for company financials and news intelligence, plus patent databases to confirm product direction and timing. These desk sources are illustrative, and many other public and paid references were also used for cross-checking, clarification, and validation.
Primary Interviews and Surveys
Primary work focused on confirming what gets bought together in real deployments, and how pricing shifts between seat-based, envelope-based, and usage-based models. We spoke with a mix of solution providers, channel and implementation partners, and enterprise users across the Americas, EMEA, and APAC, so adoption and renewal behavior and service attach rates could be checked against what teams report in practice.
Distribution of primary research fieldwork respondents
| Company type | Respondent position | Region |
|---|---|---|
| Top tier: 25% | CXOs: 17% | APAC: 46% |
| Mid tier: 58% | Functional/Unit leaders: 27% | EMEA: 35% |
| Smaller Players: 17% | Managers: 56% | Americas: 19% |
Market-Sizing & Forecasting
Market sizing is built with a top-down approach where the enterprise software and IT spend pool is narrowed using adoption indicators for electronic agreements, digital identity checks, and contract workflow automation, and then converted into DTM revenue using realistic attach and usage assumptions. To keep the number grounded, we corroborate totals using selective bottom-up approximations such as sampled vendor revenue splits, channel checks on implementation volumes, and a price-by-volume view built from typical subscription and transaction pricing.
Key inputs used in the model include e-signature and workflow adoption rates by industry, average transaction volumes per account (for envelope or document based charging), service attach rates for implementation and compliance work, cloud versus on-premises mix shifts, and regulatory push factors tied to eIDAS-style electronic trust rules and audit needs. When bottom-up signals are incomplete for smaller players, gaps are handled through conservative penetration proxies and validated against what partners report as their book of business. For forecasting, scenario analysis is used with a central case informed by interview consensus, and drivers are adjusted by region based on digitization pace, remote onboarding trends, and security requirement changes.
Data Validation & Update Cycle
Validation is done through multiple checks so outliers do not slip into the final view. We compare outputs against independent signals like enterprise software spending direction, cloud migration pace, and observed pricing moves for seats and transaction bundles, and then we re-check any unusual jumps by revisiting assumptions and calling back select respondents.
Before sign-off, the model and logic go through multi-step analyst review, followed by a final sanity pass to ensure definitions, currency conversions, and year labeling stay consistent across tables. Reports are refreshed annually, and interim updates are made when material events occur such as major regulatory changes, large pricing resets, or step changes in adoption patterns. Right before delivery, a fresh review is completed so clients receive the most current view available.
Mordor Intelligence's Digital Transaction Management Dtm Market Sizing Compared With Other Published Estimates
Published market sizes for DTM often do not match because the timing of currency conversion, how subscription prices are normalized, and what gets counted as a paid transaction can vary across studies. Differences also show up when one estimate uses a newer price list and another holds earlier pricing constant, even if both are describing the same broad topic.
Key gap drivers in this market are usually tied to whether professional services revenue is included, how envelope-based usage is translated into revenue when plans bundle transactions, and whether adjacent categories like broader workflow automation are folded in. When the model is refreshed with current-year FX, updated price points for seats and usage tiers, and then revalidated through recent channel and buyer checks, the spread narrows, which is the refresh-led reason the 2026 figure published by Mordor Intelligence can land away from older 2024 snapshots.
Benchmark comparison
| Source | Market Size | Gaps in Research Methodology |
|---|---|---|
| Mordor Intelligence | USD 25.09 B (2026) | |
| Global Consultancy A | USD 15.26 B (2024) | Uses an earlier base year and a shorter refresh window, and pricing appears anchored to historical subscription levels, which can understate revenue when seat and usage tiers are repriced upward. |
| Industry Analytics Firm B | USD 21.61 B (2024) | Takes a broader packaged view of DTM revenue in 2024, but the conversion of bundled transaction allowances into realized revenue is not clearly normalized across plan types, which can shift totals versus a usage-adjusted ASP approach. |
The table shows that most of the spread is explained by year selection, how pricing is converted into a comparable ASP, and whether bundled usage is treated as fully monetized. By keeping the scope tied to DTM transaction completion and governance, and by applying repeatable checks on FX timing and pricing logic, our estimate stays traceable to inputs that can be re-tested when market conditions change.


Key Questions Answered in the Report
What is driving the rapid growth of the digital transaction management market?
Robust demand stems from cloud scalability, stricter compliance mandates, and the arrival of AI-driven document automation that trims processing time by up to 75% while preserving data integrity.
How large will the digital transaction management market size be by 2031?
The market is forecast to reach USD 71.64 billion by 2031 on a 23.35% CAGR trajectory.
Which region offers the highest growth potential for vendors?
Asia-Pacific is expected to deliver a 27.8% CAGR through 2031, supported by smartphone penetration, government payment initiatives, and surging e-commerce volumes.
Why are services growing faster than solutions?
Enterprises require specialized integration, compliance, and managed support to connect DTM tools with legacy systems, driving a 27.62% CAGR in services revenue.
What role does blockchain play in digital transaction management?
Blockchain strengthens auditability and shortens settlement cycles, with projects such as Citi Token Services demonstrating real-time USD cash movement that satisfies stringent banking controls.
How are SMEs benefiting from adopting DTM platforms?
SMEs report a 29% acceleration in cash recovery and a 45% drop in late payments after moving to digital invoices and e-signatures, narrowing the adoption gap with large enterprises.
Page last updated on:





