Dental Practice Management Software Market Size and Share
Market Overview
| Study Period | 2020 - 2031 |
|---|---|
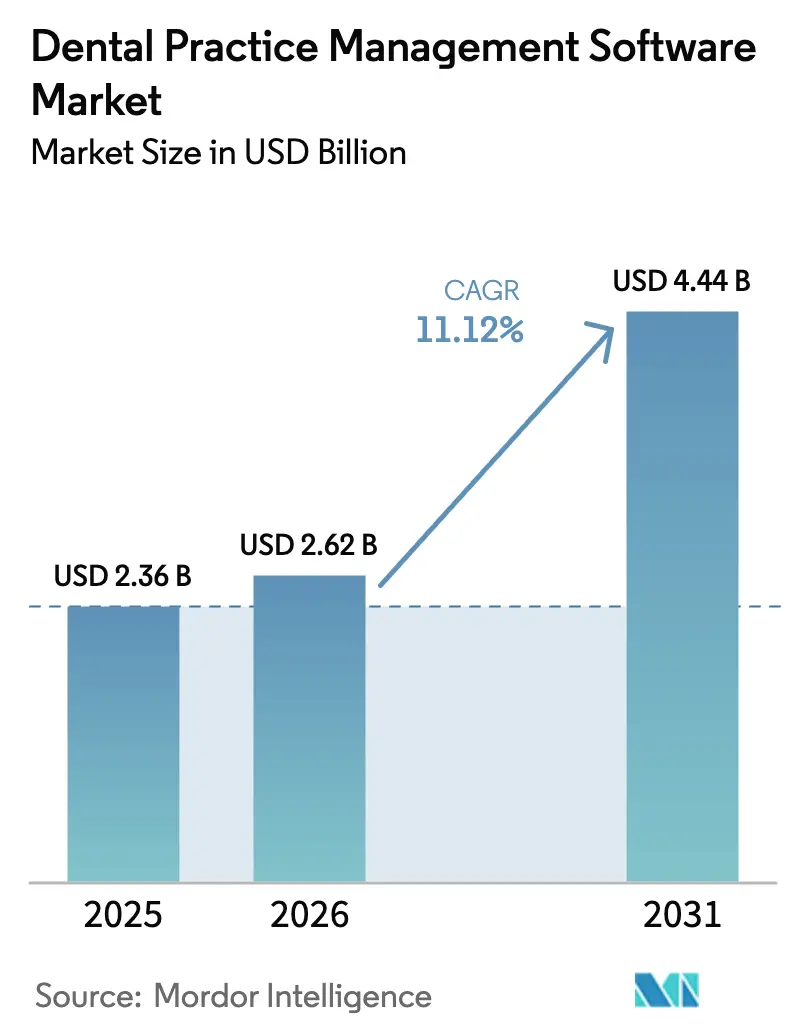
| Market Size (2026) | USD 2.62 Billion |
| Market Size (2031) | USD 4.44 Billion |
| Growth Rate (2026 - 2031) | 11.12% CAGR |
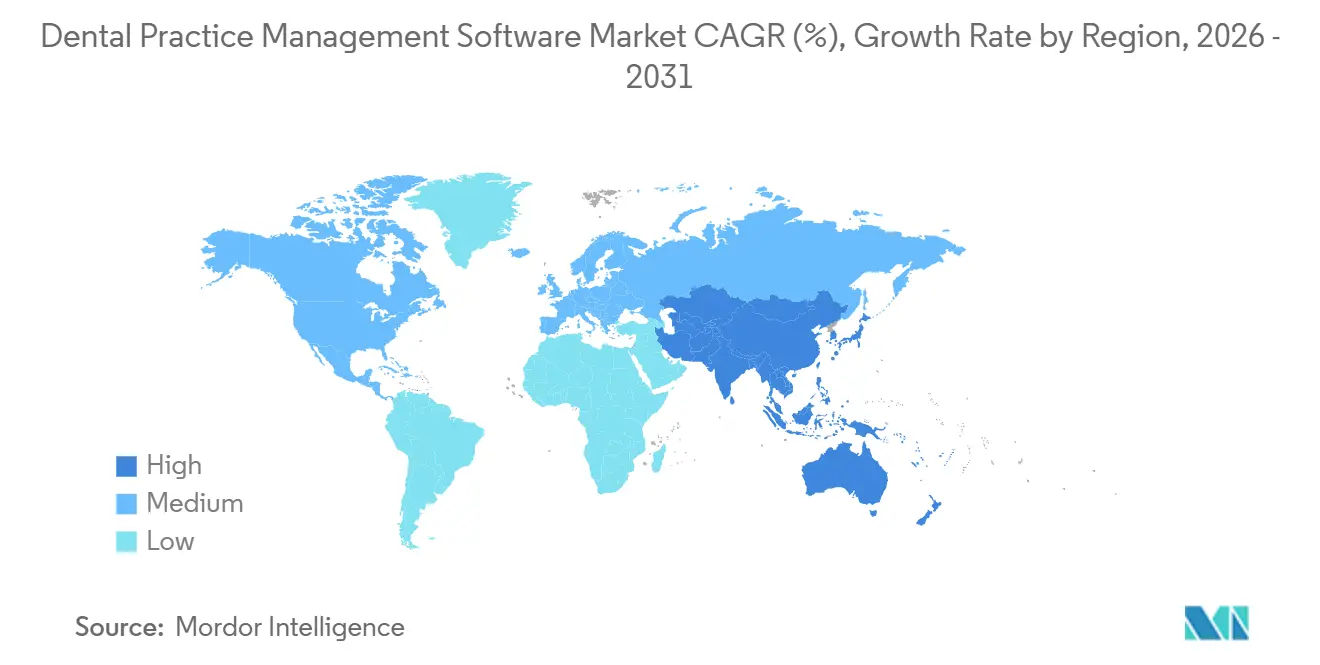
| Fastest Growing Market | Asia Pacific |
| Largest Market | North America |
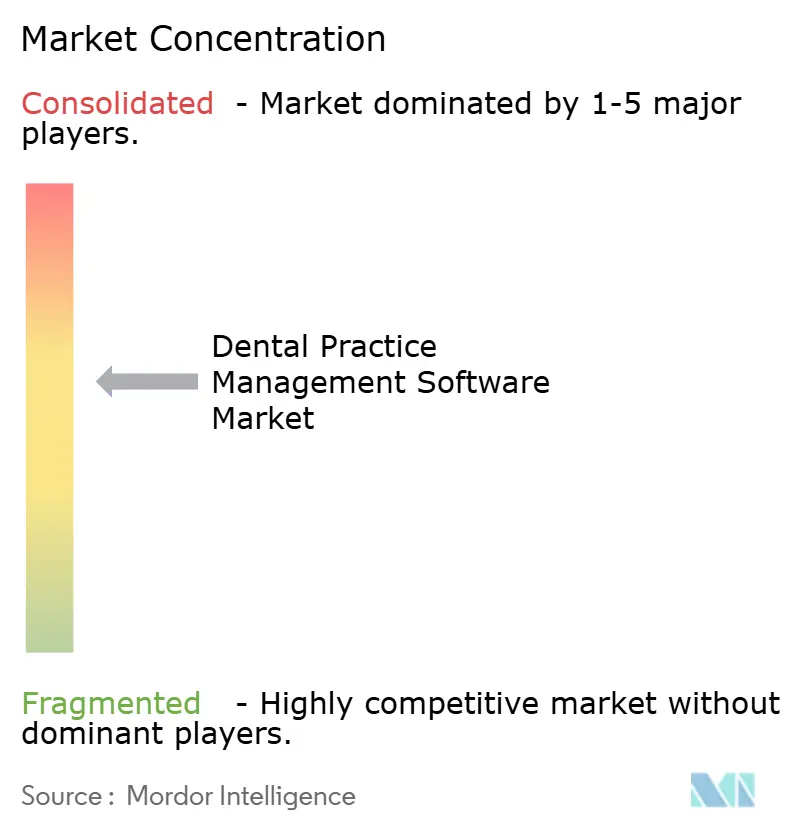
| Market Concentration | Medium |
Major Players *Disclaimer: Major Players sorted in no particular order Image © Mordor Intelligence. Reuse requires attribution under CC BY 4.0. | |
Dental Practice Management Software Market Analysis by Mordor Intelligence
The Dental Practice Management Software Market size is projected to be USD 2.36 billion in 2025, USD 2.62 billion in 2026, and reach USD 4.44 billion by 2031, growing at a CAGR of 11.12% from 2026 to 2031.
Rapid uptake reflects three converging forces: rising oral-disease prevalence that pushes clinics toward digital triage, tighter security and interoperability rules that penalize information blocking, and mature cloud infrastructure that removes capital barriers for small practices. United States HIPAA amendments requiring multi-factor authentication by December 2024 accelerated cloud migrations, while information-blocking complaints from dental clinics fell 41% year-over-year in 2025, signaling effective API-first architecture adoption. Vendors are embedding imaging, CAD/CAM, and AI analytics directly into clinical workflows to unlock new revenue streams such as chronic-care management billing. Moderate competitive intensity persists, yet acquisitions by horizontal software giants are spurring faster feature velocity and platform consolidation.
Key Report Takeaways
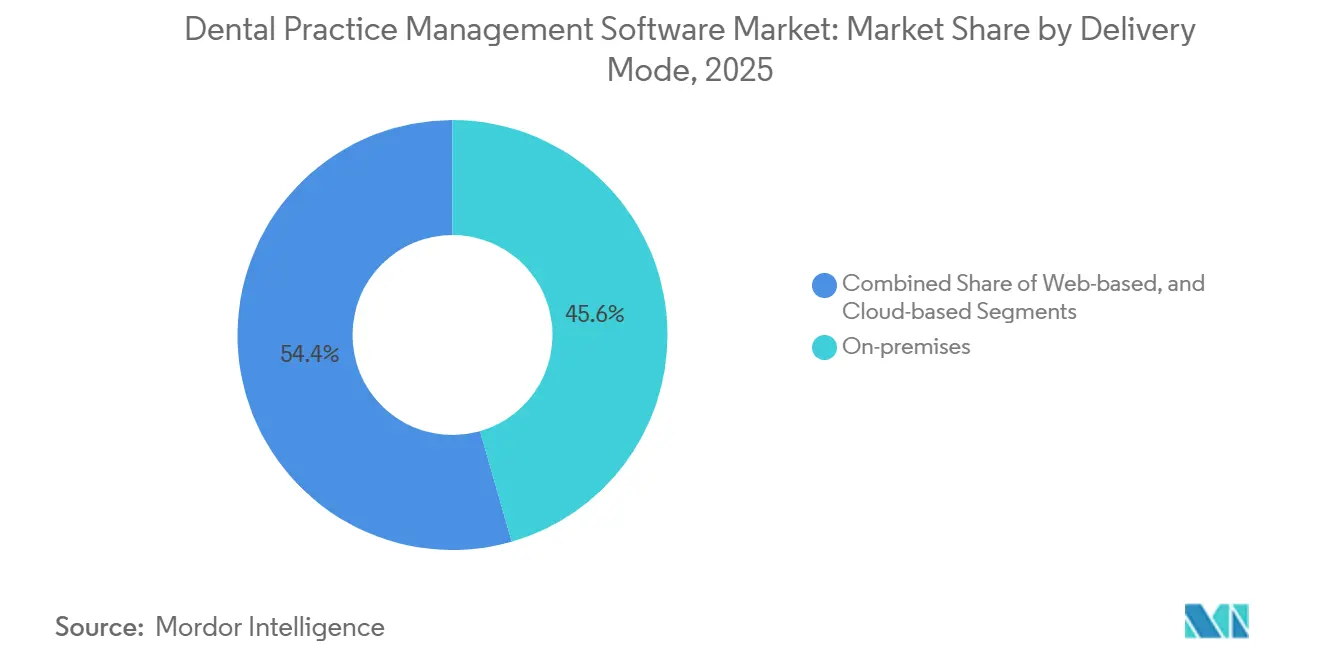
- By delivery mode, on-premises installations led with 45.56% of the dental practice management software market share in 2025; cloud-based deployments are forecast to expand at 14.25% CAGR through 2031.
- By subscription model, SaaS captured 60.53% of revenue in 2025, while subscription revenue is projected to rise at 13.85% CAGR to 2031.
- By functionality, scheduling held 26.63% revenue share in 2025; analytics modules are advancing at 16.17% CAGR through 2031.
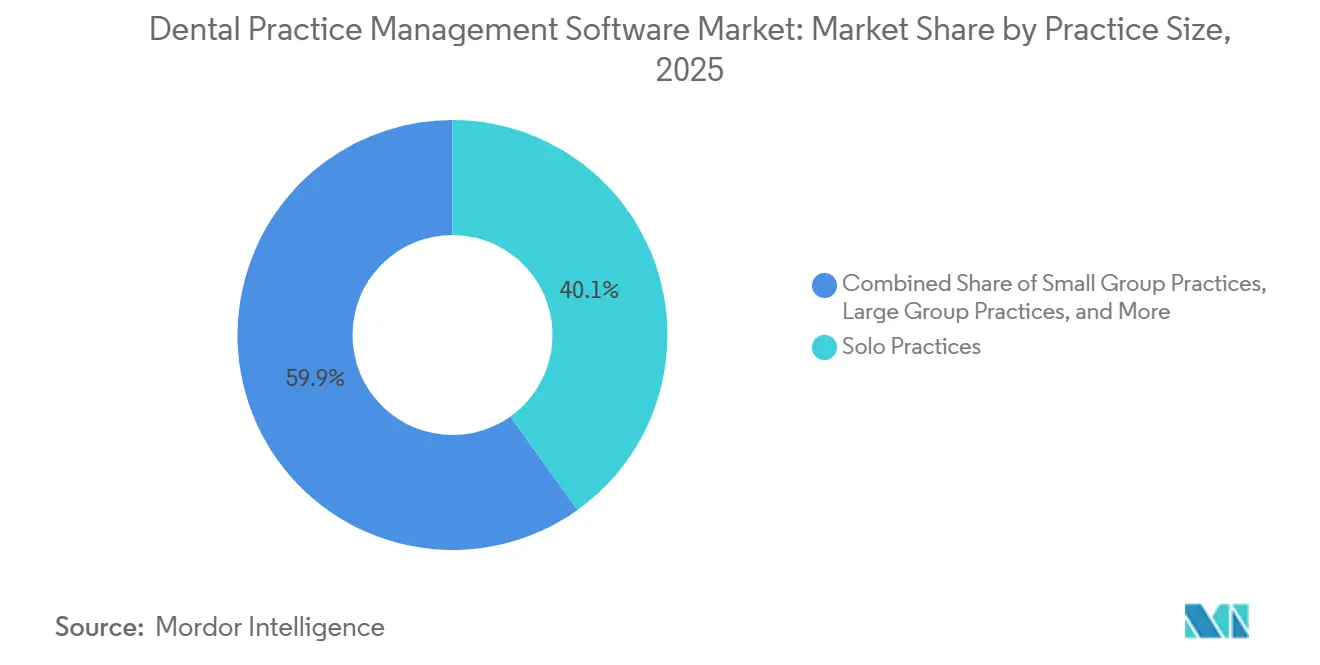
- By practice size, solo clinics represented 40.13% of installations in 2025; dental service organizations are expanding at 18.41% CAGR as private-equity consolidators standardize software platforms.
- By end user, dental clinics accounted for 85.13% of revenue in 2025; hospitals and specialty centers are growing at 13.51% CAGR on chronic-disease integration initiatives.
- By geography, North America commanded 45.13% revenue share in 2025, but Asia-Pacific is the fastest-growing region at 15.52% CAGR through 2031.
Note: Market size and forecast figures in this report are generated using Mordor Intelligence’s proprietary estimation framework, updated with the latest available data and insights as of January 2026.
Global Dental Practice Management Software Market Trends and Insights
Drivers Impact Analysis*
| Driver | (~) % Impact on CAGR Forecast | Geographic Relevance | Impact Timeline |
|---|---|---|---|
| Rising global burden of oral diseases | +2.1% | Global, high in South Asia & Sub-Saharan Africa | Medium term (2-4 years) |
| Adoption of digital health records & interoperability standards | +2.4% | North America & EU, spillover to APAC urban centers | Short term (≤ 2 years) |
| Expansion of cloud-based SaaS models with lower CapEx | +1.9% | Global, led by North America & Western Europe | Medium term (2-4 years) |
| Integration with imaging, CAD/CAM & chair-side systems | +1.6% | North America, Germany, Japan, South Korea | Long term (≥ 4 years) |
| AI-powered clinical decision add-ons & predictive analytics | +1.8% | North America, select EU markets, China pilot zones | Long term (≥ 4 years) |
| API marketplaces enabling third-party app ecosystems | +1.4% | North America, UK, Australia | Medium term (2-4 years) |
| Source: Mordor Intelligence | |||
Rising Global Burden of Oral Diseases
Untreated dental caries affects 2.5 billion adults worldwide, while periodontal disease impacts 1 billion people, yet only 23% of low- and middle-income countries integrate oral health into primary care[1]World Health Organization, “Global Oral Health Status Report 2024,” who.int. Governments now tie reimbursement to electronic dental records, illustrated by India’s mandate that all district hospitals adopt digital charting by March 2025. U.S. practices use embedded screening protocols to bill chronic-care codes worth USD 340 per patient annually. Teledentistry visits rose from under 50,000 in 2019 to 4.1 million in 2024, helped by payers reimbursing virtual assessments at 85% of the in-office rate. Demand for remote triage elevates patient-communication modules from optional add-ons to core purchase criteria. Vendors that embed risk-assessment workflows gain preference among value-based care contracts.
Adoption of Digital Health Records & Interoperability Standards
Civil monetary penalties of up to USD 1 million for blocking data exchange took effect in October 2023[2]Office of the National Coordinator for Health IT, “Information Blocking,” healthit.gov . By mid-2025, 68% of U.S. dental practices could transmit structured treatment plans to medical EHRs, up from 12% in 2022. Acceptance of SNODENT-coded claims by Medicare Advantage from 2027 removes translation friction and pushes vendors to support the expanded terminology set. Europe’s GDPR reinforces the need for regional data residency, making certified cloud providers the default for multi-site groups. Interoperability has shifted from technical nicety to existential requirement, dictating vendor roadmaps and purchase decisions.
Expansion of Cloud-Based SaaS Models with Lower CapEx
Cloud deployments replace USD 15,000–25,000 server investments with monthly fees of USD 300–600 that bundle updates, redundancy, and support. The U.S. SBA found that 81% of solo practices adopted cloud solutions when offered monthly billing, despite earlier cash-flow concerns. Vendors release security patches within 72 hours of vulnerability disclosure, far faster than on-premises cycles. As broadband access exceeds 100 Mbps for 94% of U.S. clinics, connectivity fears recede. The economic logic now favors subscription revenue, and perpetual licenses are projected to fall below 30% of sales by 2031.
Integration with Imaging, CAD/CAM & Chair-Side Systems
RESTful APIs published in 2024 let imaging hardware push DICOM and STL files straight into the patient chart. Dentsply Sirona’s CEREC Primemill auto-populates restoration data into leading platforms, cutting documentation time by 4.2 minutes per crown. Same-day crown acceptance rates rise 18% when patients view 3D renderings chairside, boosting production. Unified data models around imaging, milling, and scheduling deepen vendor lock-in, raising switching costs for practices that invest in integrated hardware-software stacks.
Restraints Impact Analysis*
| Restraint | (~) % Impact on CAGR Forecast | Geographic Relevance | Impact Timeline |
|---|---|---|---|
| Data-privacy & cyber-security compliance complexities | -1.3% | Global, acute in EU and North America | Short term (≤ 2 years) |
| Lack of standardized clinical coding & workflow harmonization | -0.9% | Global, most severe in emerging markets | Medium term (2-4 years) |
| Rising vendor lock-in risk as ecosystems consolidate | -0.7% | North America, Western Europe | Medium term (2-4 years) |
| Limited IT budgets among small independent practices | -1.1% | Global, rural and underserved areas | Short term (≤ 2 years) |
| Source: Mordor Intelligence | |||
Data-Privacy & Cyber-Security Compliance Complexities
Dental breaches exposed 1.2 million records in 2024, with average HIPAA settlements of USD 475,000[3]U.S. Department of Health and Human Services Office for Civil Rights, “Breach Portal,” hhs.gov. Ransomware incidents rose sharply; 41% of affected practices paid attackers due to inadequate backups. EU GDPR fines can reach 4% of global turnover, demonstrated by a EUR 1.2 million penalty issued in 2024 for misconfigured cloud storage. Draft FDA guidance now requires multi-factor authentication and six-year audit logs for diagnostic software, squeezing small vendors without security engineering depth. Compliance burdens push clinics toward certified cloud providers but force retraining and workflow redesign.
Lack of Standardized Clinical Coding & Workflow Harmonization
Only 340 of 875 CDT procedure codes map cleanly to ICD-10-CM, delaying medical-dental coordination. Fewer than 30% of U.S. practices had adopted SNODENT by mid-2025, and dual-coding increased charting time by up to 20%. Patient-matching errors reach 12% in U.S. interoperability exchanges, consuming more than six minutes of staff time per reconciliation. Emerging markets face localization challenges across multiple languages, slowing rollout in six Indian states. Lack of harmonization dampens adoption among clinics serving multilingual populations.
*Our forecasts treat driver/restraint impacts as directional, not additive. The impact forecasts reflect baseline growth, mix effects, and variable interactions.
Segment Analysis
By Delivery Mode: Cloud Ascends as On-Premises Persists
On-premises deployments retained 45.56% revenue in 2025, largely from clinics that purchased perpetual licenses before 2020. Migrating this installed base can cost a five-operatory practice USD 18,000 in data conversion and training. Yet cloud solutions are projected to grow 14.25% annually, propelled by dental service organizations standardizing multi-tenant architectures for centralized billing and analytics. Subscription economics appeal to solo practices lacking IT staff because cybersecurity, redundancy, and updates are bundled. The HHS multi-factor authentication deadline made modernization urgent, accelerating conversions in 2024–2025. Rural bandwidth constraints are easing as federal infrastructure funds extend >100 Mbps access to 94% of clinics. Automatic update cycles mitigate vulnerabilities within 72 hours of disclosure, a level unattainable for most on-premises users. While a minority of practices still cite internet outages and subscription fatigue, the total cost of ownership has tilted decisively toward cloud platforms.
Web-based hybrids that run in browsers without dedicated installers fill a transitional niche but lack offline resilience. Vendors position edge-caching or local-sync features to win cautious adopters. As feature parity improves, the dental practice management software market size for cloud offerings is set to surpass on-premises revenue before 2029, driven by regulatory compliance and lower CapEx. Competitive strategies now focus on migration tools and white-glove onboarding to minimize clinic downtime. Vendors that streamline legacy database conversion and staff training gain accelerated share.


By Subscription Model: Predictable Fees Overturn Perpetual Licenses
SaaS captured 60.53% revenue in 2025 and is forecast to rise at 13.85% CAGR as practices favor predictable monthly spending aligned with cash flow. Perpetual licenses once priced at USD 8,000–15,000 plus 18-22% maintenance are declining because CFOs discount the value of slower innovation and higher upgrade friction. Patterson Companies reported 27% subscription revenue growth in fiscal 2024 while perpetual sales dropped 11%, prompting a pivot to subscription-only pricing for Eaglesoft beginning 2026.
Tiered SaaS packaging lets vendors upsell AI analytics, imaging integration, and API access. Open Dental’s USD 199-399 per-provider tiers illustrate how clinics self-select functionality without lengthy sales cycles. For enterprise DSOs, volume pricing unlocks 22% software savings and centralizes data lakes for benchmarking. As subscription renewals concentrate bargaining power, vendors emphasize customer success teams and low churn. Analysts expect the dental practice management software market size stemming from perpetual licenses to fall below USD 1 billion by 2030, signaling structural revenue model realignment.
By Functionality: Analytics Surges Beyond Mature Scheduling Tools
Scheduling and calendar modules held 26.63% revenue in 2025, but growth has plateaued because feature sets have commoditized. Predictive analytics modules are projected to expand 16.17% annually to 2031, drawing demand from clinics seeking to identify no-show risks and optimize chair utilization. Machine-learning add-ons now score patient lifetime value and treatment-plan acceptance likelihood within the workflow. Billing modules are automating denial management by resubmitting corrected claims within 24 hours, shrinking accounts-receivable days outstanding.
Real-time insurance eligibility verification reduces claim denials up to 18%, encouraging integration of X12 270/271 transactions. Imaging and diagnostics integration continue to narrow the gap between CBCT units, intraoral scanners, and the patient chart. Vendors embedding imaging thumbnails reduce documentation time and visually boost same-day case acceptance. As practices adopt intraoral scanners, the dental practice management software market size linked to imaging add-ons is projected to outpace legacy charting revenue by 2029. Treatment planning now spans chairside 3D modeling, enabling instantly milled crowns and higher production per visit.
By Practice Size: DSOs Accelerate Enterprise Platform Demand
Solo clinics comprised 40.13% of installations in 2025, emphasizing ease of use and minimal setup. Small groups adopt mid-tier packages that add imaging and basic analytics. Large groups require multi-location scheduling, centralized revenue-cycle management, and granular role-based permissions under HIPAA’s minimum-necessary rule. Dental service organizations, expanding at 18.41% CAGR, standardize enterprise platforms to extract procurement discounts and unify compliance reporting. Heartland Dental finished migrating 1,800 sites to a single cloud solution in 2024, reducing IT tickets 37% and license costs 22%.
DSOs use consolidated data lakes to benchmark hygiene utilization, case acceptance, and recall compliance across networks, driving iterative performance gains. Their buying power steers vendor roadmaps toward scalable, API-rich platforms. The shift from fragmented ownership to corporate affiliation is the pivotal structural trend underpinning the dental practice management software market. Vendors courting DSOs invest in dedicated account teams and enterprise-grade support to secure multi-year contracts that protect against churn.
By End User: Hospitals and Academic Centers Embrace Integrated Oral Health
Dental clinics generated 85.13% of 2025 revenue, but hospital and specialty centers are climbing at 13.51% CAGR as academic medical hubs integrate oral health within chronic-disease pathways. The American Heart Association urges dental evaluations before invasive cardiac procedures, requiring bidirectional EHR connectivity. By mid-2025, 68% of practices could send structured treatment plans to medical EHRs, up from 12% in 2022.
Hospital-based urgent-care dental clinics lowered emergency-department dental visits 41% in their first year, highlighting the value of integrated records. Federated data networks funded by the National Institute of Dental and Craniofacial Research allow researchers to query de-identified patient data without centralization, accelerating AI model training. As medical-dental integration deepens, the dental practice management software industry must support advanced interoperability, specialty coding, and population-health analytics.
Geography Analysis
North America contributed 45.13% of global revenue in 2025, supported by Medicare Advantage reimbursement for teledentistry and state Medicaid e-prior authorization mandates. HIPAA security updates requiring encryption and multi-factor authentication accelerated cloud migrations across clinics. Canada’s phased dental-care expansion obliges electronic claims via the national EDI standard, spurring adoption among 11,000 practices. Mexico’s social-security network added 340 clinics in 2024, with MXN 1.2 billion (USD 70 million) earmarked for software subsidies. Broadband penetration exceeding 100 Mbps coverage for 94% of U.S. dental offices removes a lingering technical barrier.
Asia-Pacific is the fastest-growing region at 15.52% CAGR through 2031, anchored by China’s CNY 12 billion (USD 1.7 billion) rural-clinic digitization fund and India’s 340 million-citizen digital-health identifier rollout. Japan’s mandate for 100% electronic dental claims accelerated digitization among holdouts, while South Korea reimburses AI-assisted caries detection at 90% of manual rates, incentivizing software upgrades. Australia’s My Health Record grants of AUD 5,000 (USD 3,300) per clinic reduce integration costs. Regional localization, including multi-language SNOMED extensions and cloud data-sovereignty zones, is critical for vendor success.
Europe advances at a steadier pace due to Medical Device Regulation hurdles, which add up to two years to product certification and concentrate share among vendors with seasoned regulatory teams. Germany enforces reimbursement penalties for non-compliant clinics, prompting rapid software upgrades. The United Kingdom funds GBP 120 million (USD 150 million) to digitize 11,000 NHS dental practices, covering training and migration costs. Mobile-first solutions gain traction in Middle East, Africa, and South America, where tablet-based workflows bypass desktop infrastructure. Vendors that localize Arabic, Portuguese, and Swahili interfaces capture early-mover advantage.
Mordor Intelligence provides coverage of the dental practice management software market across other key regional markets, including Asia, each with their regulatory frameworks and demand patterns.

Competitive Landscape
The top vendors, Henry Schein (Dentrix), Patterson (Eaglesoft), Carestream Dental, and Planet DDS, hold significant share, producing moderate concentration. Henry Schein’s March 2024 acquisition of Jarvis Analytics embeds predictive models within Dentrix, increasing switching costs for existing users. Patterson’s January 2025 partnership with Weave bundles communications and payments into Eaglesoft, lowering total ownership costs and solidifying customer loyalty. Dentsply Sirona’s vertical integration of imaging, CAD/CAM, and software tightens its hardware-driven ecosystem.
Open Dental spearheads the platform approach with a certified marketplace that doubled integrations in eight months and now exceeds 12,000 practice installs. API transparency and FHIR compliance differentiate emerging entrants such as CareStack and tab32, which target DSOs with multi-tenant architectures and rapid release cycles. Vendors deploy security certifications, ISO 27001, SOC 2 Type II, to mitigate escalating ransomware risks and comply with draft FDA cyber-guidance.
Strategic white space centers on AI-driven diagnostics, blockchain-based consent, and federated analytics spanning multi-site data lakes. Horizontal software conglomerates are expected to pursue additional roll-ups, intensifying feature convergence. Vendors unable to deliver open APIs, AI roadmaps, and certified security frameworks risk marginalization as DSOs consolidate purchasing power.
Dental Practice Management Software Industry Leaders
Henry Schein Inc. (Dentrix)
Carestream Dental LLC
Planet DDS Inc. (Denticon)
Patterson Companies Inc. (Eaglesoft)
Curve Dental Inc.
- *Disclaimer: Major Players sorted in no particular order

Recent Industry Developments
- November 2025: Curve Dental announced a strategic integration with DentalHQ, enabling clinics to automate membership plans and unlock predictable recurring revenue.
- October 2025: Carestream Dental launched CS 3D Imaging Premium, an AI-powered solution that streamlines implant planning and enhances case-sharing workflows.


Research Methodology Framework and Report Scope
Market Definitions and Key Coverage
Our study defines the dental practice management software market as all on-premise or cloud solutions that enable dentists and dental service organizations to schedule appointments, record clinical notes, store images, manage insurance claims, process payments, and analyze practice performance across single or multi-chair settings. According to Mordor Intelligence, the market was valued at USD 2.36 billion in 2025 and is forecast to reach USD 3.97 billion by 2030.
Scope exclusion: standalone imaging, CAD/CAM, or invoicing tools sold without core practice management functionality are not counted.
Segmentation Overview
- By Delivery Mode
- On-premises
- Web-based
- Cloud-based
- By Subscription Model
- Perpetual License
- Subscription / SaaS
- By Functionality
- Patient Communication & Engagement
- Appointment Scheduling & Calendar
- Billing & Invoicing
- Insurance & Claims Management
- Treatment Planning & Charting
- Imaging & Diagnostics Integration
- Analytics & Business Intelligence
- By Practice Size
- Solo Practices (1-2 ops)
- Small Group Practices (3-9 ops)
- Large Group Practices (10+ ops)
- Dental Service Organizations (DSOs)
- By End User
- Dental Clinics
- Hospitals & Specialty Dental Centers
- Academic & Research Institutes
- Geography
- North America
- United States
- Canada
- Mexico
- Europe
- Germany
- United Kingdom
- France
- Italy
- Spain
- Rest of Europe
- Asia-Pacific
- China
- Japan
- India
- South Korea
- Australia
- Rest of Asia-Pacific
- Middle East & Africa
- GCC
- South Africa
- Rest of Middle East & Africa
- South America
- Brazil
- Argentina
- Rest of South America
- North America
Detailed Research Methodology and Data Validation
Primary Research
Mordor analysts perform phone and web interviews with practice owners, DSO IT managers, software product heads, and regional distributors in North America, Europe, Asia-Pacific, and Latin America. These discussions test adoption rates, average subscription fees, and upcoming regulatory triggers, allowing us to validate secondary findings and adjust model assumptions.
Desk Research
We begin with public datasets from authorities such as the World Health Organization's Global Oral Health Data Bank, the OECD Health Statistics portal, the U.S. Centers for Medicare & Medicaid Services, and the American Dental Association. These sources reveal patient volumes, dentist density, and software adoption mandates that frame the total addressable base. Company 10-Ks, investor decks, trade association white papers, and news archived in Dow Jones Factiva and D&B Hoovers supply pricing trends, M&A activity, and install base disclosures that help refine revenue pools. The sources named here illustrate our information spine; many additional publications are consulted for cross-checks.
Market-Sizing & Forecasting
We rebuild global revenue using a top-down model that starts with active dental chair counts and chair-side software penetration by practice size, which are then multiplied by verified average annual license values. Supplier roll-ups and sampled clinic spend provide a bottom-up sense check before totals are frozen. Key variables include dentist-to-population ratios, DSO consolidation pace, migration from on-premise to cloud subscriptions, renewal pricing uplift, and regional regulatory incentives. A multivariate regression combined with scenario analysis projects each driver through 2030, and ARIMA smoothing captures cyclical spending dips. Where channel data are patchy, midpoint estimates are bounded by confidence intervals derived from our primary interviews.
Data Validation & Update Cycle
Outputs pass three analyst reviews, variance tests against historic budgets, and anomaly flags that trigger respondent recalls. The dataset is refreshed annually, with interim updates issued when material events, such as large public sector tenders or price list revisions, shift the baseline. Clients therefore receive the newest vetted view at delivery.
Why Mordor's Dental Practice Management Software Baseline Commands Reliability
Published figures often diverge because firms choose differing scopes, currencies, and refresh windows. We disclose our inclusions up front, apply identical exchange rates across regions, and time-stamp every assumption, which reduces silent biases.
Key gap drivers versus other publishers include their narrower cloud-only scope, heavier reliance on vendor self-reported installs, and less frequent model refreshes that miss rapid DSO roll-ups.
Benchmark comparison
| Market Size | Anonymized source | Primary gap driver |
|---|---|---|
| USD 2.36 B (2025) | Mordor Intelligence | - |
| USD 2.71 B (2024) | Global Consultancy A | Counts imaging add-ons and uses list prices without regional discounts |
| USD 2.40 B (2024) | Industry Association B | Excludes solo practices under three chairs |
| USD 1.80 B (2024) | Trade Journal C | Uses 2022 exchange rates and omits Latin America |
In sum, Mordor's transparent scope choices, dual-source validation, and yearly refresh cadence deliver a balanced, reproducible baseline that decision makers can trust.


Key Questions Answered in the Report
What is the current dental practice management software market size?
It is USD 2.62 billion in 2026 with a forecast to reach USD 4.44 billion by 2031.
How fast is the sector growing?
The segment is registering an 11.12% CAGR between 2026 and 2031.
Which delivery mode is expanding the quickest?
Cloud-based deployments are projected to grow 14.25% annually through 2031.
Why are analytics modules gaining traction?
Predictive analytics improve no-show reduction, chair utilization, and treatment acceptance, driving a 16.17% CAGR to 2031.
Which region is the fastest-growing?
Asia-Pacific is advancing at 15.52% CAGR, led by digitization initiatives in China and India.
What are the main compliance challenges for clinics?
Data-privacy rules such as HIPAA and GDPR require encryption, multi-factor authentication, and detailed audit logging, raising security and budget pressures.
Page last updated on:


