Distributed Denial Of Service (DDoS) Protection Market Size and Share
Market Overview
| Study Period | 2020 - 2031 |
|---|---|
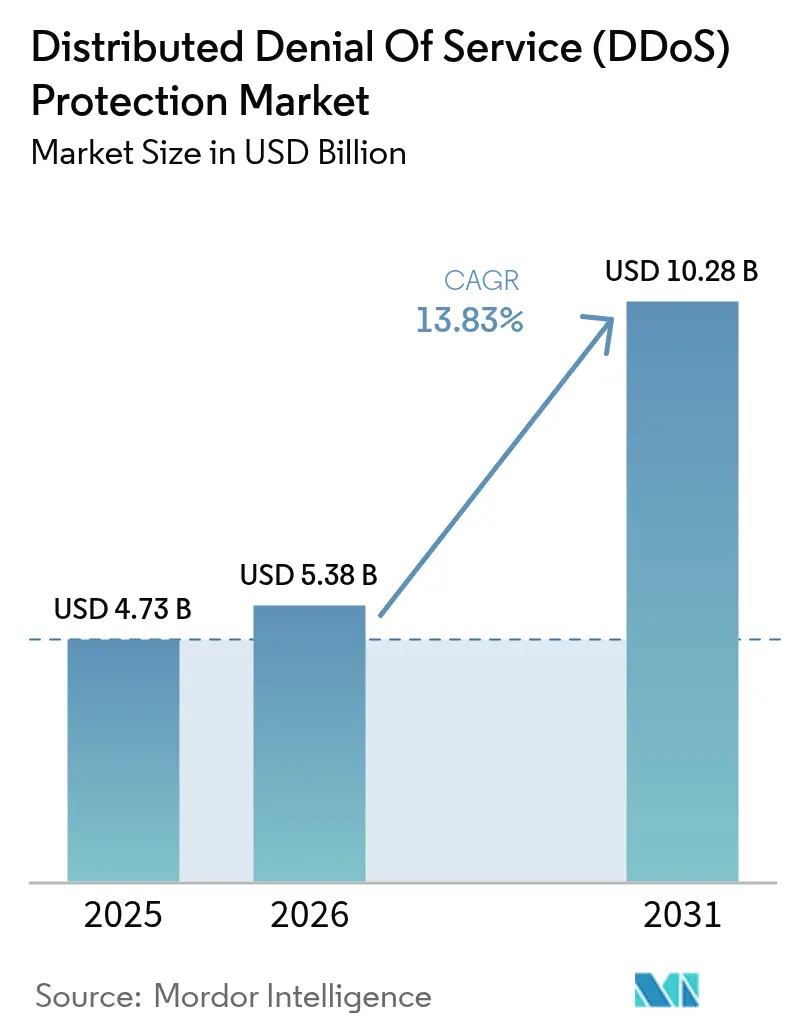
| Market Size (2026) | USD 5.38 Billion |
| Market Size (2031) | USD 10.28 Billion |
| Growth Rate (2026 - 2031) | 13.83% CAGR |
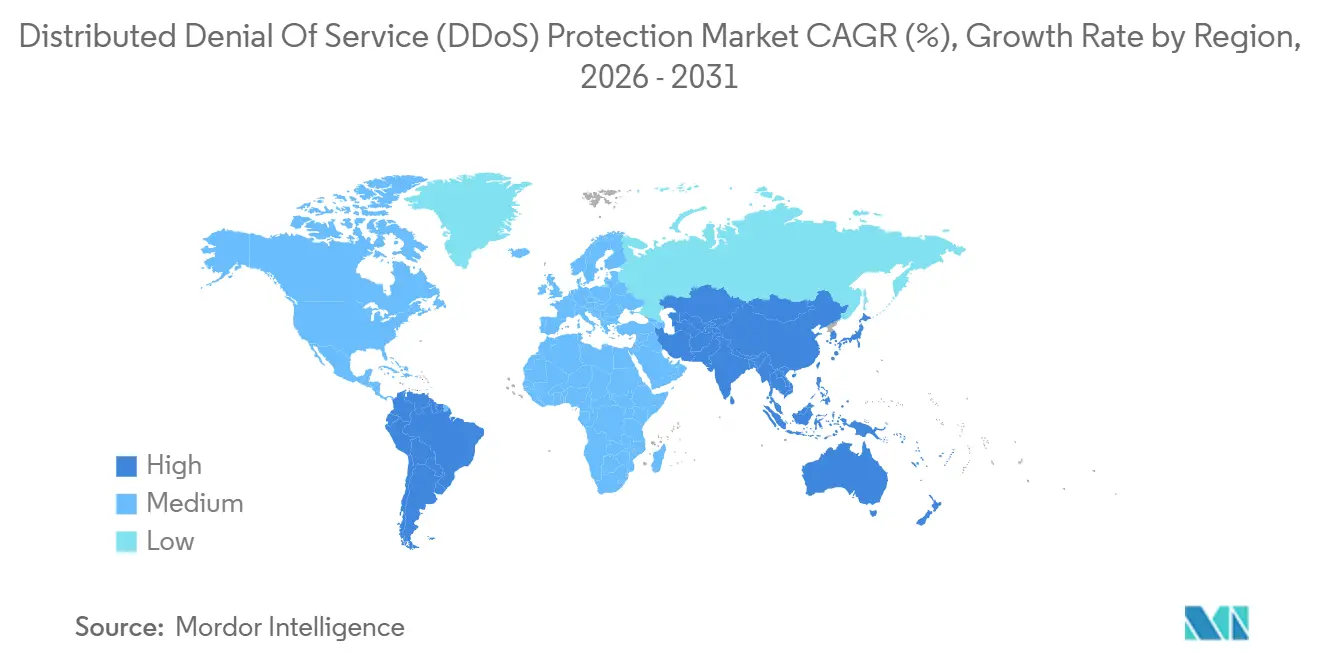
| Fastest Growing Market | Asia Pacific |
| Largest Market | North America |
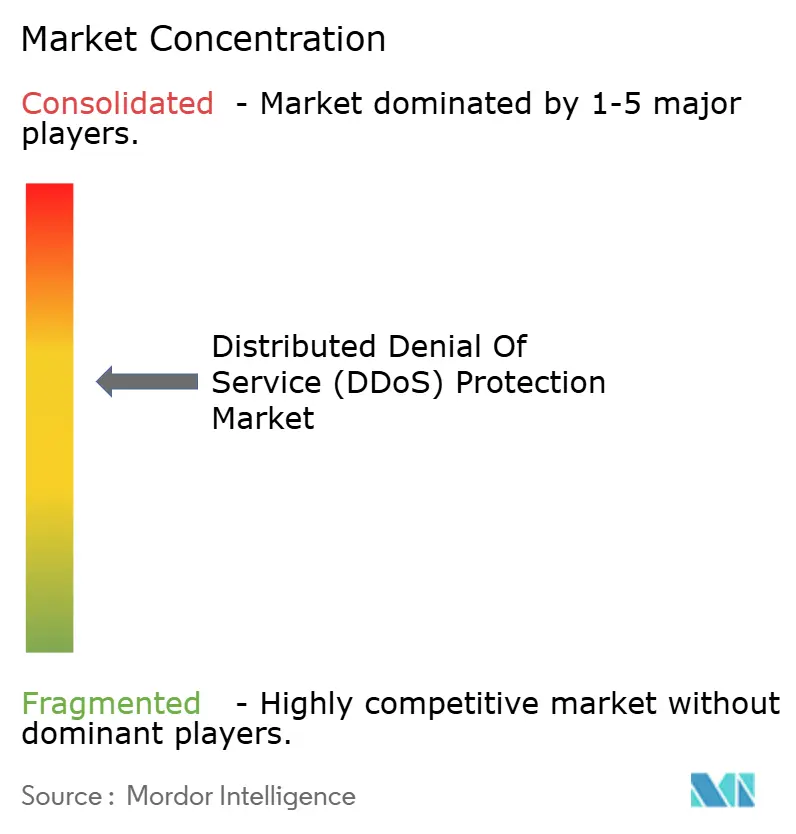
| Market Concentration | Medium |
Major Players *Disclaimer: Major Players sorted in no particular order Image © Mordor Intelligence. Reuse requires attribution under CC BY 4.0. | |
Distributed Denial Of Service (DDoS) Protection Market Analysis by Mordor Intelligence
The DDoS protection market size is projected to expand from USD 4.73 billion in 2025 and USD 5.38 billion in 2026 to USD 10.28 billion by 2031, registering a 13.83% CAGR from 2026 to 2031. Enterprises are revising procurement strategies because multi-vector campaigns now account for 42% of incidents, forcing a pivot from single-layer appliances to integrated platforms that correlate network, application, and DNS telemetry in real time. The shift is reinforced by a record 31.4 terabit-per-second assault observed in early 2025, which highlighted the elasticity limits of legacy hardware. Cloud deployment preference is growing as anycast routing delivers sub-3-second detection, a performance level that on-premises devices cannot match under terabit-scale loads. Meanwhile, DDoS-as-a-Service subscriptions priced between USD 20 and USD 40 per month are lowering entry barriers so dramatically that even low-skill actors can unleash attacks large enough to overwhelm poorly protected networks.
Key Report Takeaways
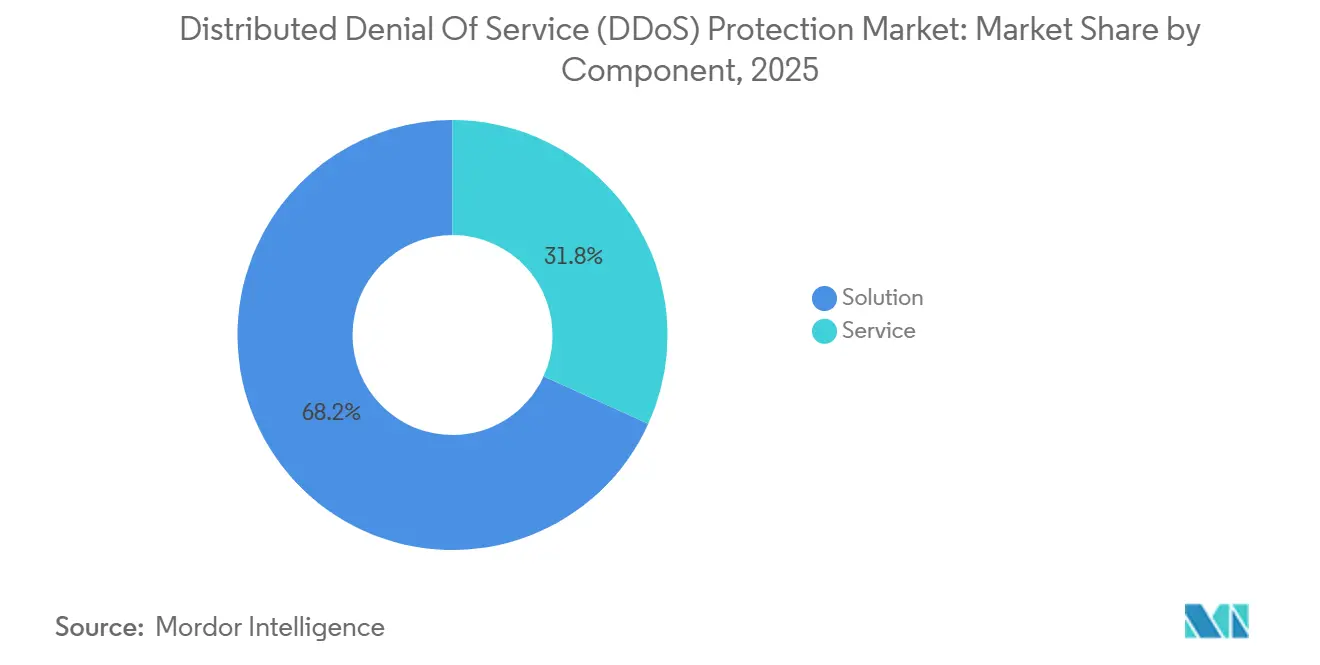
- By component, solution offerings commanded 68.23% revenue share in 2025, while advanced bot mitigation is forecast to advance at a 14.24% CAGR through 2031.
- By deployment mode, cloud-based services held 55.13% of the DDoS protection market share in 2025, whereas hybrid architectures are projected to grow at a 14.13% CAGR to 2031.
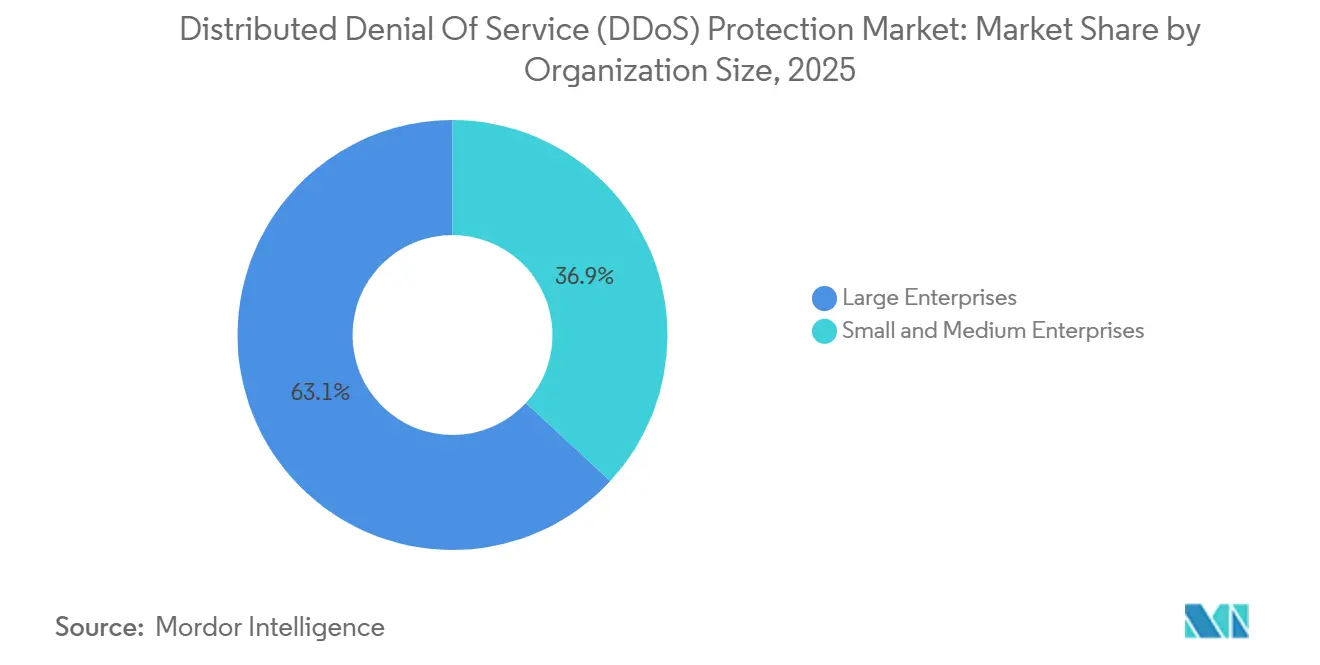
- By organization size, large enterprises accounted for 63.12% share of the DDoS protection market size in 2025, with SMEs anticipated to increase spending at a 14.28% CAGR through 2031.
- By end-user industry, banking, financial services and insurance secured 28.42% revenue share in 2025, but retail and e-commerce is expected to accelerate at a 14.73% CAGR up to 2031.
- By geography, North America captured 42.36% revenue share in 2025, while Asia Pacific is on track to expand at a 14.54% CAGR through 2031.
Note: Market size and forecast figures in this report are generated using Mordor Intelligence’s proprietary estimation framework, updated with the latest available data and insights as of 2026.
Global Distributed Denial Of Service (DDoS) Protection Market Trends and Insights
Drivers Impact Analysis*
| Driver | (~) % Impact on CAGR Forecast | Geographic Relevance | Impact Timeline |
|---|---|---|---|
| Escalating Frequency of Multi-Vector, Terabit-Scale Attacks | +3.8% | Global, highest in North America, Europe, Asia Pacific financial hubs | Short term (≤ 2 years) |
| Rapid Migration to Cloud and Hybrid Mitigation Models | +3.2% | North America and Europe lead, Asia Pacific gaining pace | Medium term (2-4 years) |
| Expansion of IoT, 5G, and Edge-Connected Devices | +2.9% | Asia Pacific core, spill-over to Middle East and Africa | Medium term (2-4 years) |
| AI-Powered DDoS-as-a-Service Marketplaces Lowering Entry Barriers | +2.1% | Global, dark-web hubs in Eastern Europe and Southeast Asia | Short term (≤ 2 years) |
| Critical-Infrastructure Regulations Mandating Resiliency | +1.6% | Europe, North America, emerging Asia Pacific | Long term (≥ 4 years) |
| Surge in Attack Sophistication via Encrypted Traffic Bypasses | +1.4% | Global, acute in finance and healthcare | Medium term (2-4 years) |
| Source: Mordor Intelligence | |||


Escalating Frequency of Multi-Vector, Terabit-Scale Attacks
Attackers now blend network volumetric floods, application resource exhaustion, and DNS amplification in single campaigns, raising peak event sizes beyond 30 terabits per second in 2025. The 31.4 terabit-per-second assault blocked in early 2025 confirms that mobile botnets can equal or exceed traditional IoT firepower.[1]Cloudflare, “DDoS Threat Report Q1 2025,” cloudflare.com Legacy appliances struggle to scrub traffic above 10 terabits per second without harmful latency, especially in payment systems that demand millisecond responsiveness. Consequently, risk-averse banks are redirecting floods to cloud scrubbing centers with elastic capacity. Vendors are racing to improve correlation engines able to separate genuine user spikes from malicious bursts, thereby limiting accidental blocking of loyal customers.
Rapid Migration to Cloud and Hybrid Mitigation Models
Organizations are blending local inspection points with cloud scrubbing centers to balance latency and capacity. A leading hybrid setup can absorb more than 15 terabits per second by automatically diverting overflow traffic to distributed nodes once on-premises thresholds are breached. Cloud services detect anomalies in under three seconds, a benchmark unattainable when human analysts must approve appliance rule changes. Yet 91% of enterprises report visibility gaps between on-premises and cloud workloads, illustrating operational complexity. Financial regulators add urgency by asking banks to prove resilience against 1 terabit-plus events, pushing demand for hybrid architectures that blend deep-packet inspection with global anycast routing.
Expansion of IoT, 5G, and Edge-Connected Devices
Every 5G-enabled handset or smart sensor represents a potential botnet node. IEEE research shows that 5G network slicing can be exhausted slice by slice, cascading failures across critical services.[2] IEEE, “5G Network Security and DDoS Vulnerabilities,” ieee.org In H1 2025, 1.17 million attacks originated from insecure cameras and routers, with a single burst peaking at 2.2 terabits per second. Manufacturing plants that rely on edge devices for real-time control are especially exposed because operational-technology firmware is rarely patched. The ballooning device population therefore enlarges both the attack surface and the available amplification power, accelerating the DDoS protection market expansion in Asia Pacific where 5G rollouts are densest.
AI-Powered DDoS-as-a-Service Marketplaces Lowering Entry Barriers
Dark-web platforms now bundle AI-generated scripts, reconnaissance automation, and CAPTCHA-bypass features for subscriptions as low as USD 20 per month. Mentions of tools such as WormGPT and GhostGPT climbed 219% year over year, signaling rapid diffusion of offensive AI capabilities. These services allow unskilled actors to mount terabit-scale attacks without coding expertise, broadening the adversary base. Ransom-driven revenue funds even more sophisticated tooling, creating a feedback loop that drives demand for adaptive, behavior-based defenses within the DDoS protection market.
Restraints Impact Analysis*
| Restraint | (~) % Impact on CAGR Forecast | Geographic Relevance | Impact Timeline |
|---|---|---|---|
| High Total Cost of Ownership of On-Premises Appliances for SMEs | -1.9% | Global, acute in emerging markets and SME-dense sectors | Medium term (2-4 years) |
| Shortage of Skilled Cyber-Security Professionals | -1.4% | Global, severe in technology hubs | Long term (≥ 4 years) |
| Risk of False-Positive Mitigation Causing Self-Inflicted Downtime | -0.8% | Global, high in e-commerce, finance, streaming | Short term (≤ 2 years) |
| Growing Use of Serverless Architectures Reducing Traffic Visibility | -0.6% | North America and Europe | Medium term (2-4 years) |
| Source: Mordor Intelligence | |||
High Total Cost of Ownership of On-Premises Appliances for SMEs
Enterprise-grade appliances can cost more than USD 500,000 up front, with 15%-20% annual maintenance, overwhelming small budgets. Additional hidden costs redundant circuits, specialized staff, and professional services push true ownership 30%-50% above list price. Although cloud subscriptions start at USD 200 per month, unpredictable bandwidth overages during major attacks deter some owners. These economics are driving SMEs toward managed-service providers that amortize infrastructure across many clients, yet concerns about data sovereignty and added latency hinder universal adoption.
Shortage of Skilled Cyber-Security Professionals
The global talent gap reached 4.8 million in 2024, and salaries for seasoned analysts are inflating by 15%-20% yearly.[3]ISC2, “Cybersecurity Workforce Study 2024,” isc2.org DDoS defense requires hybrid expertise in networking and threat intelligence, a profile scarce on the open market. Training pipelines last 6-12 months, leaving organizations exposed during onboarding. Many enterprises outsource to managed SOCs, but reliance on external teams can slow bespoke rule updates, extending attack dwell time and widening potential losses.
*Our forecasts treat driver/restraint impacts as directional, not additive. The impact forecasts reflect baseline growth, mix effects, and variable interactions.
Segment Analysis
By Component: Advanced Bot Mitigation Gains Momentum
Solution offerings represented 68.23% of 2025 revenue, anchoring the DDoS protection market share at the platform level. Within that pool, advanced bot mitigation is projected to grow at 14.24% CAGR through 2031, signaling a transition from blunt volumetric filtering toward behavioral analytics that profile cursor paths and keystroke cadence to block credential-stuffing campaigns targeting login APIs. Network-layer tools remain mandatory to absorb SYN and UDP floods that clog ingress links, while DNS safeguards are climbing in importance because spoofed queries still achieve amplification factors above 100x.
Professional services focus on architecture design and one-time tuning, but managed services deliver recurring 24/7 monitoring, an offering expanding fastest due to the cybersecurity labor shortage. Vendors increasingly wrap consulting into longer-term contracts to preserve margins in a subscription-heavy environment. As a result, component providers that combine bot mitigation, DNS protection, and managed response in unified portals are best positioned to capture the incremental DDoS protection market demand.

By Deployment Mode: Hybrid Architectures Balance Latency and Capacity
Cloud-based services owned 55.13% of 2025 revenue and remain the entry point for most SMEs, but hybrid models are advancing at 14.13% CAGR as larger organizations route normal traffic through on-premises appliances and burst flows into cloud scrubbing centers exceeding 15 terabits per second. This two-tier approach limits false positives against baseline traffic while offering elastic protection during surges, proving attractive for banking platforms with millisecond transaction windows.
Hybrid orchestration depends on instant thresholds that trigger automatic BGP diversion. Platforms such as Magic Transit reroute traffic within three seconds, compared with manual appliance updates that can take minutes. Yet uniform policy enforcement remains challenging because 91% of security teams report blind spots across mixed environments. Vendors that expose granular APIs and deliver cloud-side visibility dashboards are easing that pain point, thereby catalyzing further hybrid adoption in the DDoS protection market.
By Organization Size: SME Momentum Builds via Managed Service Bundles
Large enterprises held 63.12% of global spending in 2025, but SMEs are catching up with a forecast 14.28% CAGR through 2031 as subscription models remove capital hurdles. A typical SME can launch protection for USD 200 per month, paying only for scrubbing bandwidth when attacks occur rather than purchasing idle appliances. Managed offerings also supply incident forensics, closing internal skills gaps that many smaller organizations face.
Conversely, large enterprises rarely switch vendors because re-architecting multi-region traffic flows can exceed USD 1 million in transition costs. They negotiate stringent SLAs guaranteeing sub-second mitigation and often integrate content-delivery edge nodes to minimize user latency. These layered investments solidify their grasp on absolute DDoS protection market size, even though percentage growth now leans toward smaller firms.
By End-User Industry: Retail and E-Commerce Ramps Fastest
Banking, financial services, and insurance controlled 28.42% spending in 2025, anchored by regulatory mandates that demand resilience against terabit-class threats.[4]European Union Agency for Cybersecurity, “NIS2 Directive Guidelines,” enisa.europa.eu Yet retail and e-commerce is set to rise at 14.73% CAGR as peak-season events reveal direct revenue jeopardy from checkout disruptions. Attackers increasingly flood API endpoints that manage inventory checks and payment authorization, bypassing volumetric filters aimed at broader HTTP traffic.
Other verticals exhibit niche threat profiles, telecommunications providers risk cascading outages if scrubbing fails at transit layers, while healthcare systems prioritize uptime over cost, sustaining on-premises investments despite high TCO. Government and defense remain concerned about sovereign traffic paths, often mandating domestically hosted scrubbing centers to meet compliance obligations, sustaining diverse demand drivers within the DDoS protection market.
Geography Analysis
North America led the DDoS protection market with a 42.36% revenue share in 2025, driven by strict CISA mandates and the spending power of hyperscale cloud providers that embed mitigation within edge networks. United States banks and technology firms dominate procurement, while Canadian healthcare regulations and Mexico’s digital-services expansion expand regional breadth. Hybrid adoption is especially common as enterprises combine local compliance with anycast capacity.
Asia Pacific is projected to be the fastest-growing region at 14.54% CAGR through 2031. India recorded 7.8 million attacks in 2024 and 4.5 million in H1 2025, prompting the Reserve Bank of India and telecom regulators to impose stricter uptime standards. Japan is investing after power-grid attacks exposed OT weaknesses, whereas Southeast Asian nations such as Indonesia and Vietnam experience retail-focused bursts linked to e-commerce booms. China presents a dual reality, with large attack volumes alongside government-backed filtering that offers partial shelter to domestic operators.
Europe’s procurement accelerated after the NIS2 Directive took effect in October 2024, extending resilience obligations to 18 sectors and creating a compliance tailwind across energy, healthcare, and public administration. The United Kingdom, Germany, and France lead spending, but Eastern European countries both generate attacks and adopt protection as internet penetration climbs. South America, the Middle East, and Africa together represent a smaller base yet post robust growth as digital payment adoption widens. Brazil’s financial regulators, Gulf energy producers, and African mobile carriers are key adopters, confirming global breadth of demand for the DDoS protection market.

Competitive Landscape
**Competitive Landscape**
The DDoS protection market shows moderate consolidation, with the five largest vendors controlling about 45% of global revenue. Cloud-native players such as Cloudflare, Akamai, and AWS bundle mitigation into content delivery and edge compute, lowering customer acquisition costs and raising switching friction. Traditional appliance suppliers including NETSCOUT, Radware, and F5 defend share by pairing on-premises inspection with cloud scrubbing capacity. Subscription pricing from cloud entrants is compressing hardware margins, forcing incumbents to rethink perpetual license models. Competitive intensity remains high because price pressure coexists with rapid demand growth for terabit-scale protection.
Strategic alliances illustrate the shift. Radware embedded DefensePro into Microsoft Azure’s native service to address latency-sensitive workloads in regulated industries. Akamai integrated Guardicore microsegmentation to couple lateral-movement control with volumetric filtering, appealing to banks that need zero trust and scrubbing in one stack. F5 launched BIG-IP Next as a cloud-native platform that scales beyond 10 terabits per second while using AI-based anomaly detection to cut false positives.
White space persists in protecting serverless and container workloads where flow-based sensors miss ephemeral traffic. Startups are using eBPF telemetry inside Kubernetes clusters to flag denial-of-service patterns without packet mirroring. Managed service providers are capitalizing on the 4.8 million person cybersecurity talent gap by offering turnkey mitigation and post-incident forensics. Vendors differentiate through AI-driven fingerprinting that examines TLS handshakes and HTTP header order to block bots before they form attack waves. Continued venture funding, exemplified by Link11’s USD 16.05 million Series B round, confirms investor confidence in niches that the dominant five have yet to occupy.
Distributed Denial Of Service (DDoS) Protection Industry Leaders
NETSCOUT Systems, Inc.
Akamai Technologies, Inc.
F5, Inc.
Imperva, Inc.
Radware Ltd.
- *Disclaimer: Major Players sorted in no particular order

Recent Industry Developments
- March 2026: Cloudflare mitigated a 31.4 Tbps DDoS attack from the AISURU botnet, involving over 2 million Android devices globally.
- February 2026: In Early 2025, NETSCOUT reported over 8 million DDoS attacks, peaking at 30 Tbps. 42% used multi-vector tactics. Enterprises are adopting integrated platforms.
- January 2026: Gcore Labs recorded 1.17 million DDoS attacks, a 41% YoY surge, with the largest attack reaching 2.2 Tbps.
- December 2025: The European Union Agency for Cybersecurity mandates operators in 18 critical sectors to meet resilience and 24-hour reporting requirements, driving compliance-focused procurement in energy, healthcare, and public administration.


Global Distributed Denial Of Service (DDoS) Protection Market Report Scope
The Distributed Denial of Service (DDoS) Protection Market is witnessing significant growth driven by the increasing frequency and sophistication of cyberattacks worldwide. Organizations across various industries are prioritizing robust security measures to safeguard their digital infrastructure, driving the demand for advanced DDoS protection solutions and services. The market is further driven by the rising adoption of cloud-based solutions and the growing need to comply with stringent regulatory requirements.
The Distributed Denial of Service (DDoS) Protection Market Report is Segmented by Component (Solution including Network-Layer Protection, Application-Layer Protection, DNS Protection, Advanced Bot Mitigation, and Service including Professional Services and Managed Services), Deployment Mode (Cloud, On-Premises, Hybrid), Organization Size (Small and Medium Enterprises, Large Enterprises), End-User Industry (Government and Defense, Banking Financial Services and Insurance, Information Technology and Telecommunications, Healthcare and Life Sciences, Retail and E-Commerce, Media and Entertainment, Energy and Utilities, Manufacturing, Rest of End-User Industries), and Geography (North America, South America, Europe, Asia Pacific, Middle East, Africa). The Market Forecasts are Provided in Terms of Value (USD).
| Solution | Network-Layer Protection |
| Application-Layer Protection | |
| DNS Protection | |
| Advanced Bot Mitigation | |
| Service | Professional Services |
| Managed Services |
| Cloud |
| On-Premises |
| Hybrid |
| Small and Medium Enterprises |
| Large Enterprises |
| Government and Defense |
| Banking, Financial Services and Insurance |
| Information Technology and Telecommunications |
| Healthcare and Life Sciences |
| Retail and E-Commerce |
| Media and Entertainment |
| Energy and Utilities |
| Manufacturing |
| Rest of End-User Industries |
| North America | United States |
| Canada | |
| Mexico | |
| South America | Brazil |
| Argentina | |
| Rest of South America | |
| Europe | United Kingdom |
| Germany | |
| France | |
| Italy | |
| Spain | |
| Russia | |
| Rest of Europe | |
| Asia Pacific | China |
| Japan | |
| India | |
| South Korea | |
| Australia and New Zealand | |
| Rest of Asia Pacific | |
| Middle East | Saudi Arabia |
| United Arab Emirates | |
| Turkey | |
| Rest of Middle East | |
| Africa | South Africa |
| Nigeria | |
| Rest of Africa |
| By Component | Solution | Network-Layer Protection |
| Application-Layer Protection | ||
| DNS Protection | ||
| Advanced Bot Mitigation | ||
| Service | Professional Services | |
| Managed Services | ||
| By Deployment Mode | Cloud | |
| On-Premises | ||
| Hybrid | ||
| By Organization Size | Small and Medium Enterprises | |
| Large Enterprises | ||
| By End-User Industry | Government and Defense | |
| Banking, Financial Services and Insurance | ||
| Information Technology and Telecommunications | ||
| Healthcare and Life Sciences | ||
| Retail and E-Commerce | ||
| Media and Entertainment | ||
| Energy and Utilities | ||
| Manufacturing | ||
| Rest of End-User Industries | ||
| By Geography | North America | United States |
| Canada | ||
| Mexico | ||
| South America | Brazil | |
| Argentina | ||
| Rest of South America | ||
| Europe | United Kingdom | |
| Germany | ||
| France | ||
| Italy | ||
| Spain | ||
| Russia | ||
| Rest of Europe | ||
| Asia Pacific | China | |
| Japan | ||
| India | ||
| South Korea | ||
| Australia and New Zealand | ||
| Rest of Asia Pacific | ||
| Middle East | Saudi Arabia | |
| United Arab Emirates | ||
| Turkey | ||
| Rest of Middle East | ||
| Africa | South Africa | |
| Nigeria | ||
| Rest of Africa | ||


Key Questions Answered in the Report
How large will the DDoS protection market be by 2031?
It is forecast to reach USD 10.28 billion by 2031, rising at a 13.83% CAGR from 2026.
Which deployment model is growing fastest?
Hybrid architectures are projected to expand at a 14.13% CAGR as organizations blend on-premises inspection with cloud scrubbing.
Why is retail adopting protection more rapidly than other sectors?
Retail and e-commerce face peak-season revenue risks from checkout disruptions, driving a 14.73% CAGR in protection spending through 2031.
What region shows the highest growth potential?
Asia Pacific is set to grow at 14.54% CAGR, supported by 5G rollouts and rising digital-payment usage.
How does the shortage of cybersecurity professionals affect adoption?
The 4.8 million-person talent gap pushes many firms to managed-service models, boosting demand for turnkey protection solutions.
What distinguishes cloud-native vendors from appliance vendors?
Cloud-native providers embed anycast routing and automated scrubbing, enabling sub-3-second mitigation at lower per-gigabit costs.
Page last updated on:


