Data Lake Market Size and Share
Market Overview
| Study Period | 2020 - 2031 |
|---|---|
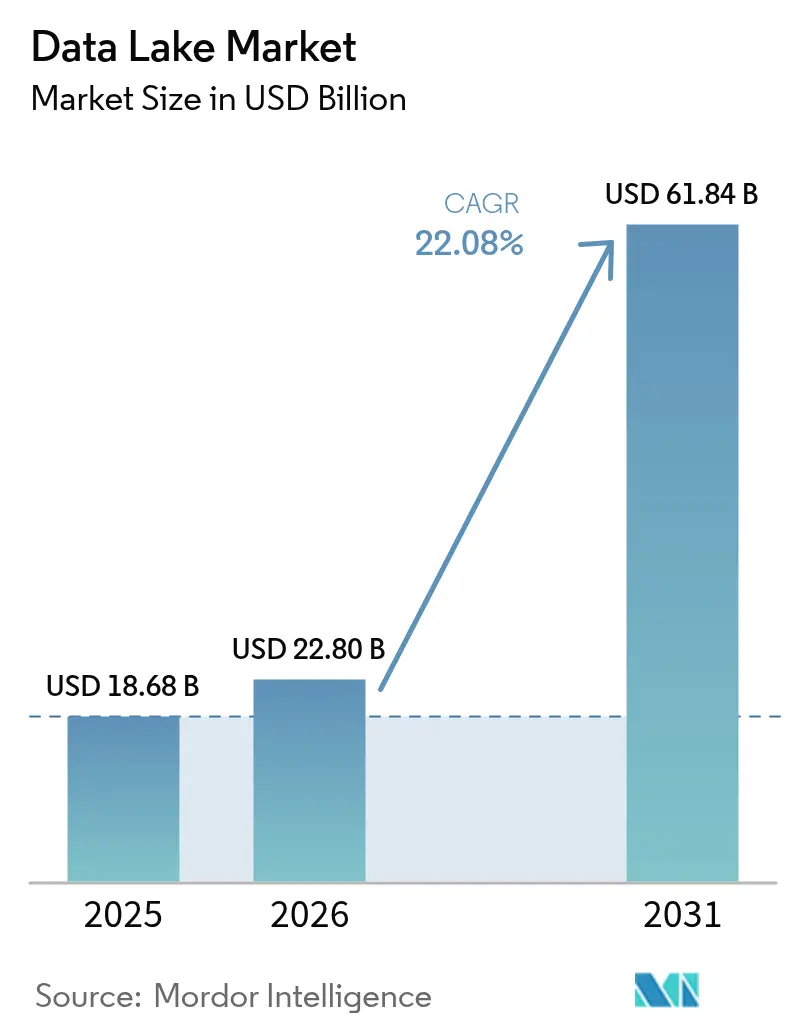
| Market Size (2026) | USD 22.8 Billion |
| Market Size (2031) | USD 61.84 Billion |
| Growth Rate (2026 - 2031) | 22.08% CAGR |
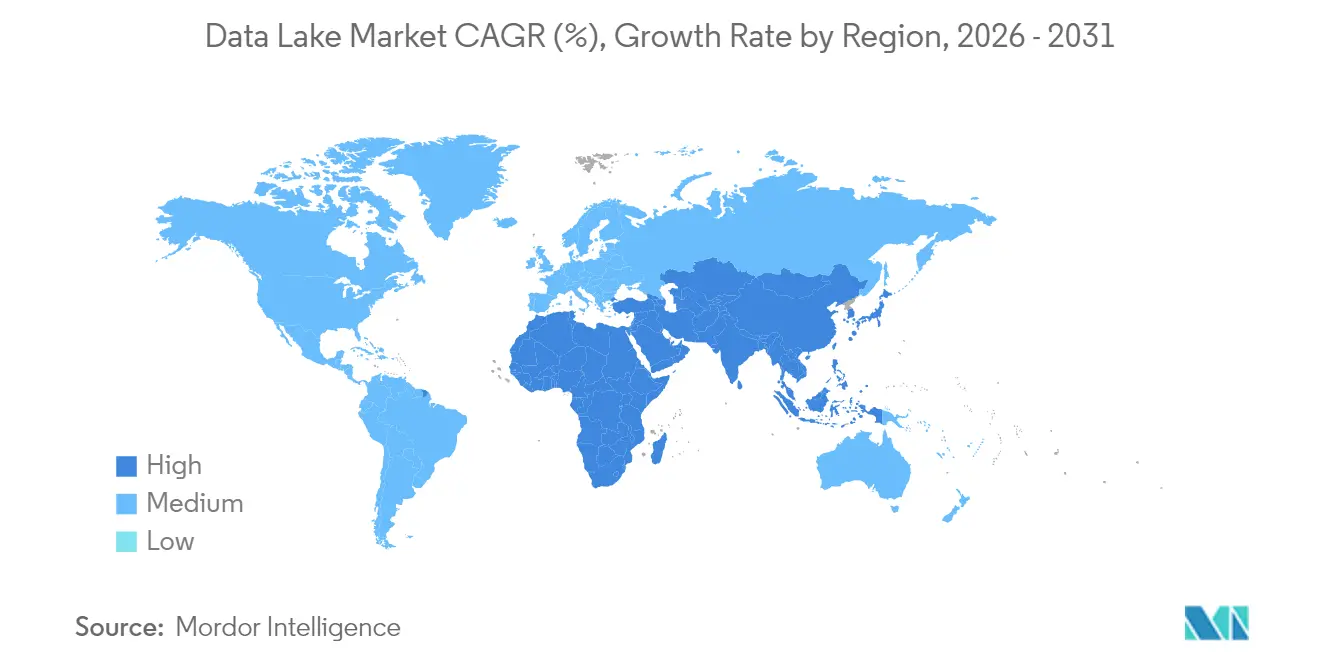
| Fastest Growing Market | Asia |
| Largest Market | North America |
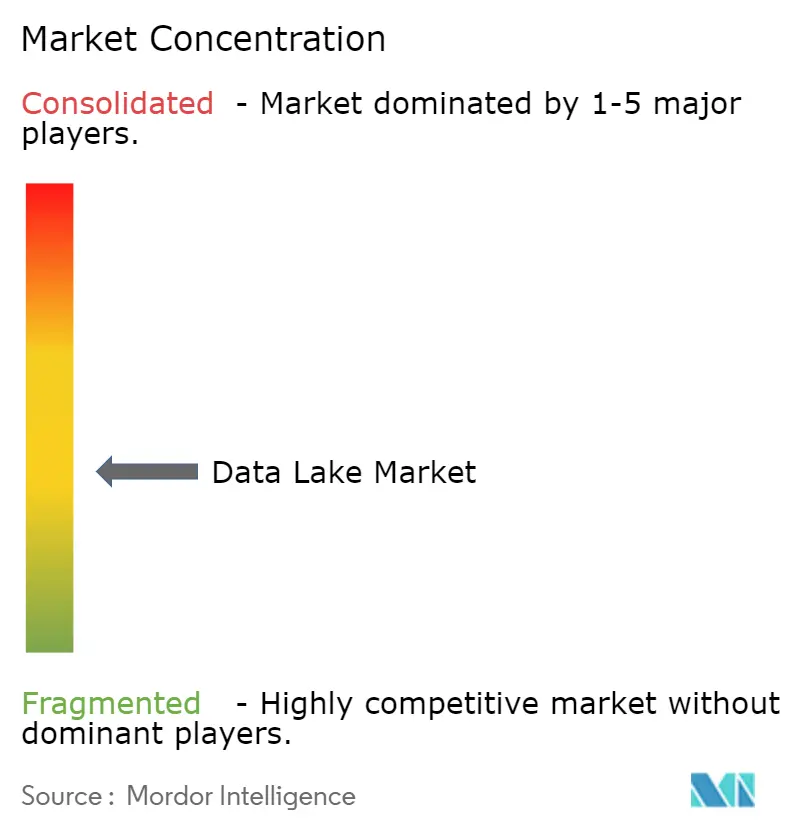
| Market Concentration | Medium |
Major Players *Disclaimer: Major Players sorted in no particular order Image © Mordor Intelligence. Reuse requires attribution under CC BY 4.0. | |
Data Lake Market Analysis by Mordor Intelligence
The data lakes market size is expected to grow from USD 18.68 billion in 2025 to USD 22.8 billion in 2026 and is forecast to reach USD 61.84 billion by 2031 at 22.08% CAGR over 2026-2031. Growth stems from surging unstructured data volumes generated by generative-AI pipelines, expanding regulatory record-keeping mandates, and the shift toward lakehouse architectures that collapse lake and warehouse footprints into a single tier. Fortune 500 firms report 35-40% total-cost savings after embracing lakehouses, while real-time ESG and risk-stress workloads are extending use cases into industrial and financial domains. Serverless open-table formats now anchor multi-cloud portability strategies, and automated governance layers are emerging to prevent “swamp” pitfalls without throttling innovation.
Key Report Takeaways
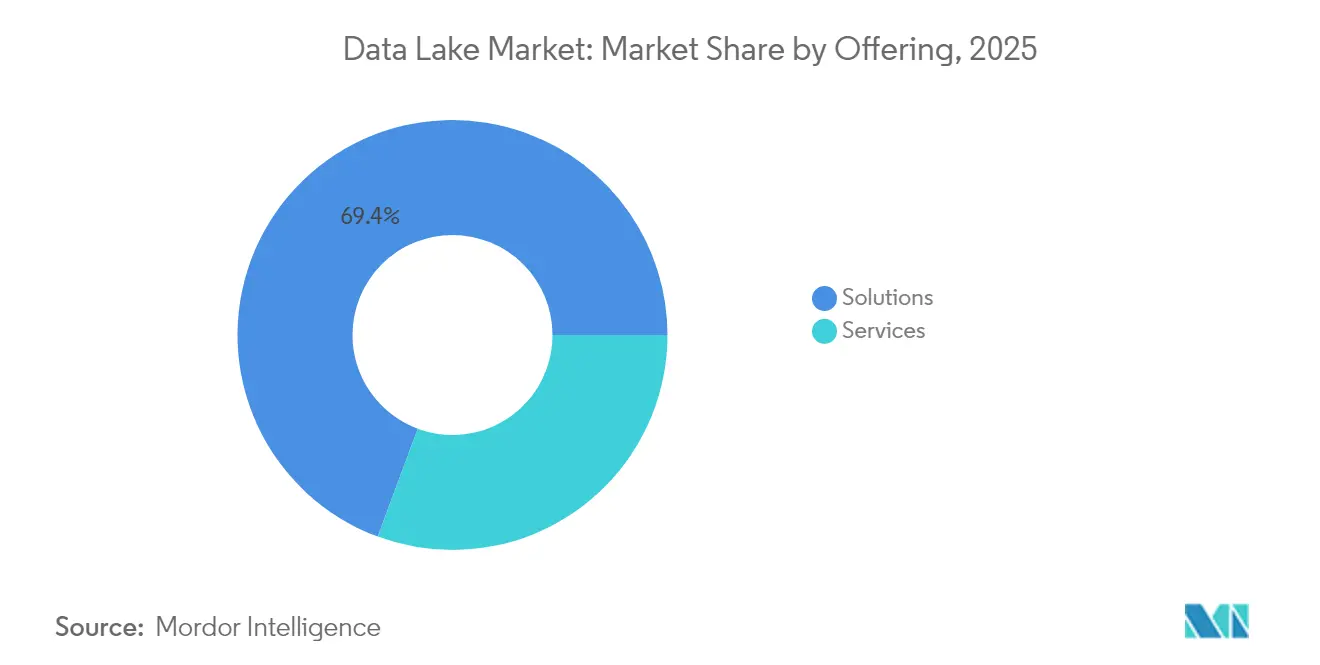
- By offering, solutions led with 69.35% revenue share in 2025; services are projected to expand at a 24.77% CAGR through 2031.
- By deployment, cloud captured 64.20% of the data lakes market share in 2025, while hybrid/multi-cloud is forecast to grow at a 23.1% CAGR between 2026-2031.
- By organization size, large enterprises commanded 71.10% of the data lakes market size in 2025; SMEs are the fastest risers at a 26.1% CAGR through 2031.
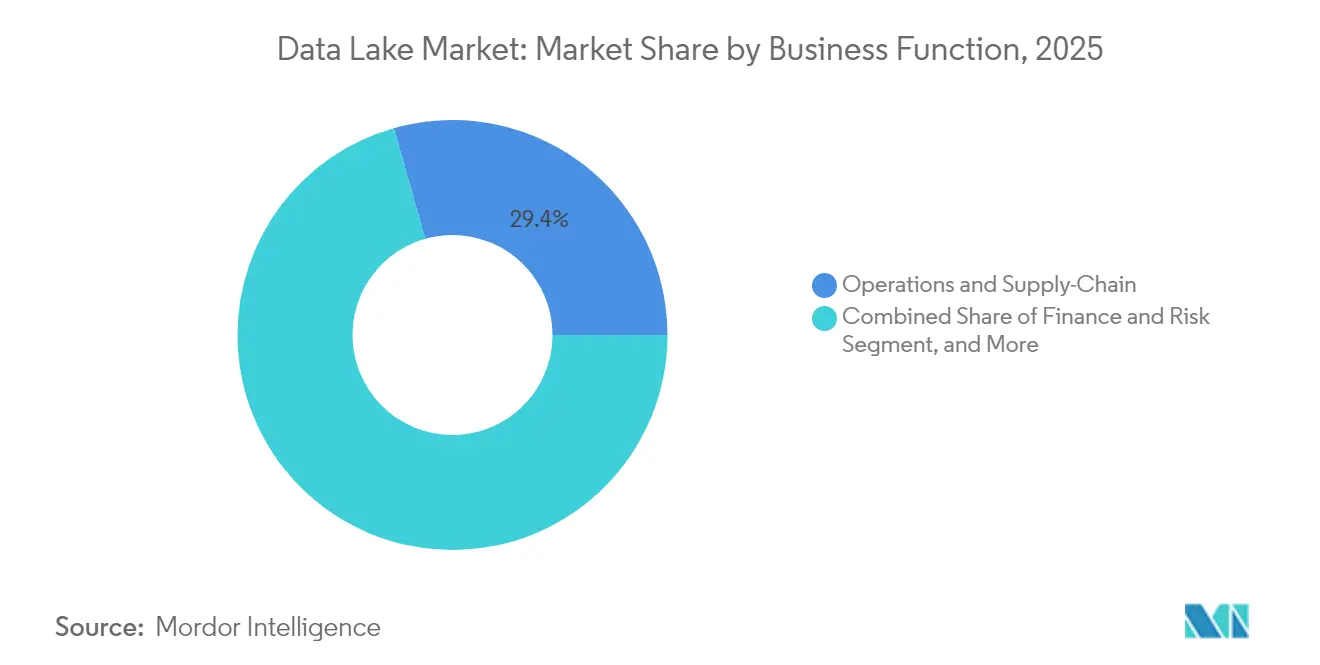
- By business function, operations & supply chain held 29.40% share of the data lakes market in 2025, whereas finance & risk is advancing at a 25.2% CAGR to 2031.
- By end-user vertical, IT & telecom led with 21.60% revenue share in 2025; healthcare & life sciences is poised to expand at a 25.6% CAGR to 2031.
- By geography, North America dominated with 37.40% share in 2025, while Asia is set to accelerate at a 23.5% CAGR through 2031.
Note: Market size and forecast figures in this report are generated using Mordor Intelligence’s proprietary estimation framework, updated with the latest available data and insights as of 2026.
Global Data Lake Market Trends and Insights
Drivers Impact Analysis*
| Driver | (~) % Impact on CAGR Forecast | Geographic Relevance | Impact Timeline |
|---|---|---|---|
| Explosion of unstructured & multimodal data from GenAI workloads | +7.5% | Global with concentration in North America & Western Europe | Medium term (2-4 years) |
| Data-residency mandates in Europe accelerating cloud-based lake adoption | +5.2% | European Union, UK, Switzerland & APAC | Short term (≤ 2 years) |
| Lakehouse convergence driving 35–40% TCO savings for Fortune 500 firms | +6.3% | Global with early adoption in North America | Medium term (2-4 years) |
| Serverless table formats (Iceberg/Delta) unlocking multi-cloud portability | +4.8% | Global, strongest where multi-cloud strategies are active | Medium term (2-4 years) |
| Real-time ESG Scope-3 data-capture requirements in industrial sector | +3.2% | Europe, North America, advanced APAC economies | Long term (≥ 4 years) |
| Regulatory stress-testing in financial services demanding decade-scale tick-data retention | +2.9% | Global financial centers (New York, London, Singapore, Hong Kong) | Medium term (2-4 years) |
| Source: Mordor Intelligence | |||
Explosion of unstructured and multimodal data from GenAI workloads
Generative-AI applications create vast image, audio, and text payloads that demand schema-on-read storage. Enterprises expect 30% of the global 175 zettabyte data sphere to require real-time processing by 2025, a profile unsuited to rigid warehouses. Data lakes therefore become the default landing zone for multi-modal corpora used in prompt-engineering loops.[1]Acceldata, “Enterprise Data Lakes: Revolutionizing Business Data,” acceldata.ioGoogle Cloud’s lakehouse blueprint shows how native-format storage paired with vector indexing accelerates foundation-model fine-tuning while lowering storage bills. Firms delaying adoption risk slower innovation cycles and higher unit-costs on AI workloads.
Data-residency mandates in Europe accelerating cloud-based lake adoption
The EU Data Governance Act and Data Act compel organizations to localize sensitive workloads. Hyperscalers are responding: AWS is investing EUR 7.8 billion in a sovereign-cloud region that ships with embedded data-location controls.[2]Databricks, “Databricks Agrees to Acquire Tabular,” databricks.com Enterprises now deploy region-segmented data lakes that meet residency rules yet remain queryable through federated engines, sparking demand for lineage-rich metadata catalogs capable of surfacing cross-border data usage in audit reports.
Lakehouse convergence delivering 35-40% TCO savings
A single-tier lakehouse erases the duplication that once plagued separate lakes and warehouses. Surveyed enterprises moving analytical jobs onto lakehouse engines cite halved data-movement costs and compression-driven storage savings. Performance gains from vector-aware query planners further collapse compute runtimes, freeing budget for AI experimentation. Eighty-one percent of firms now train ML models directly on lakehouse tables, indicating convergence is no longer an edge practice but a mainstream pattern.
Serverless table formats unlocking multi-cloud portability
Apache Iceberg, Delta Lake, and Hudi introduce ACID transactions, schema evolution, and time-travel to object stores. The formats decouple compute from storage, letting analytics engines in rival clouds query the same datasets without replication. Databricks’ 2024 acquisition of Tabular underscores the strategic value of open table metadata, while Google BigLake’s Omni feature queries Iceberg partitions in rival clouds, validating the neutral-format thesis.[3]European Commission, “A European Strategy for Data,” digital-strategy.ec.europa.eu
Restraints Impact Analysis*
| Restraint | (~) % Impact on CAGR Forecast | Geographic Relevance | Impact Timeline |
|---|---|---|---|
| Metadata drift creating “data swamps” | -3.8% | Global, more acute in legacy deployments | Short term (≤ 2 years) |
| Skilled data-lake engineering talent shortfall | -2.9% | APAC, Latin America, Middle East & Africa | Medium term (2-4 years) |
| Latency-sensitive use cases still prefer warehouses | -2.1% | Finance, telecom hubs worldwide | Short term (≤ 2 years) |
| Opaque consumption-based cloud pricing | -1.7% | Mid-market firms globally | Medium term (2-4 years) |
| Source: Mordor Intelligence | |||
Metadata drift creating “data swamps”
When ingestion outpaces catalog updates, data lakes devolve into unsearchable repositories. By 2025, global data volume will reach 163 zettabytes, heightening the risk of siloed files with missing context. Enterprises are responding by adopting automated lineage trackers such as Unity Catalog, which logs every read-write and flags orphaned assets. Without similar controls, governance overhead can erase savings projected from lakehouse consolidation.
Skilled lake-engineering talent shortfall in emerging regions
APAC and Latin-American firms cite a scarcity of engineers who understand distributed filesystems, open-table formats, and cloud cost tuning. POPsights data shows AI-driven role creation outpacing local training supply. OECD research highlights a widening urban-rural gap in access to advanced data skills.[4]OECD, “Job Creation and Local Economic Development 2024,” oecd.org Managed services and low-code pipelines are mitigating shortages, yet talent scarcity still lengthens deployment cycles, slowing data lakes market penetration.
*Our forecasts treat driver/restraint impacts as directional, not additive. The impact forecasts reflect baseline growth, mix effects, and variable interactions.
Segment Analysis
By Offering: Solutions lead, services surge
Solutions generated 69.35% of data lakes market revenue in 2025, equating to a data lakes market size of USD 12.95 billion. The dominance comes from enterprises standardizing on storage engines, query accelerators, and governance suites that form the backbone of AI-ready environments. Vendors bundle cost-optimizer dashboards, automated tiering, and native open-table support, maintaining relevance as workloads evolve.
The services sub-segment is racing ahead at a 24.77% CAGR to 2031, reflecting demand for migration blueprints, performance tuning, and 24×7 managed operations. Many firms lack staff who can re-platform legacy Hadoop estates, so they contract specialists that promise predictable SLA outcomes. The tight talent market ensures professional-services bookings will keep growing faster than the overall data lakes market


By Deployment: Cloud rules, hybrid accelerates
Cloud deployments captured 64.20% of the data lakes market share in 2025 as organizations sought instant scalability and integrated security. Elastic object stores like Amazon S3 eliminate CapEx while delivering lifecycle automation that auto-tiers cold data to low-cost classes. Analytics engines then spin up on demand, keeping compute spend aligned with project tempo.
Hybrid and multi-cloud configurations are expanding at 23.1% CAGR to 2031. Open-table formats let one metadata definition span on-prem and public-cloud buckets, slashing replication needs. Regional compliance rules further fuel hybrid strategies, as firms pin regulated workloads in sovereign regions yet still query them through cross-cloud fabrics. As a result, the data lakes market size for hybrid environments is rising in lockstep with sovereign-cloud launches.
By Organization Size: Large enterprises dominate, SMEs gain pace
Large enterprises accounted for 71.10% of the data lakes market size in 2025, or approximately USD 13.28 billion. Their complex, petabyte-scale estates require advanced RBAC, automated lineage, and FinOps governance. Banks, manufacturers, and telecoms rely on lakehouses to consolidate silos and support real-time AI applications.
Small and medium enterprises log the fastest 26.1% CAGR because vendor-managed plans now offer “pay-as-processed” billing. Low-code orchestration and template-driven schemas shorten deployment cycles. Community editions of Iceberg and Delta expose enterprise-grade capability without license fees, letting resource-constrained firms join the data lakes market mainstream.
By Business Function: Operations steady, finance & risk surging
Operations and supply-chain workloads generated 29.40% of 2025 spend, with manufacturers blending IoT telemetry, supplier EDI, and logistics feeds for predictive maintenance. Schema-on-read flexibility makes lakes ideal for fusing semi-structured sensor files with ERP tables, supporting control-tower dashboards that slice downtime risk.
Finance and risk applications are growing at 25.2% CAGR. Regulators now expect decade-deep tick histories, and lakehouses store these volumes efficiently. The Federal Reserve’s April 2025 buffer-rule proposal underscores the need to model capital impacts under stressed conditions. Banks that centralize risk, treasury, and ESG records inside a governed lake eliminate reconciliation delays, gaining reporting agility.
By End-User Vertical: IT and telecom lead, healthcare advances
IT and telecom operators held 21.60% of 2025 revenue. Carriers ingest call-detail records, network KPIs, and support transcripts in lakes, then run fraud detection and churn analytics that improve lifetime value. Softteco notes Vodafone and AT&T use AI-driven lake architectures to optimize towers and personalize offers.
Healthcare and life sciences are projected to climb at a 25.6% CAGR. Hospitals marry electronic health records, imaging, and genomics in unified repositories that power precision-medicine studies. Microsoft Fabric deployments illustrate how unified ingestion pipelines cut data prep times, enabling real-time clinical alerts. Pharma firms exploit repeatable lake workflows to trim discovery cycles, driving sustained investment in the data lakes market.
Geography Analysis
North America generated 37.40% of 2025 revenue and continues to set benchmarks in architecture maturity. Financial institutions lengthen time-series retention to meet evolving stress-test templates, while hospital networks build multimodal patient graphs that underpin AI-driven diagnostics. Venture capital also fuels governance-start-up formation, ensuring a vibrant ecosystem.
Asia-Pacific is the fastest-expanding region, clocking a 23.5% CAGR through 2031. Governments in Japan, India, and Singapore sponsor sovereign-cloud projects, spurring demand for region-compliant lake zones. Telcos in China analyze massive 5G logs for capacity planning, whereas Indonesian fintechs share fraud-intelligence lakes to curb cybercrime. Vendors establishing APAC headquarters, such as Wasabi in Japan, aim to catch the projected 36% IaaS upturn.
Europe accelerates adoption under strict data-sovereignty mandates. The European Strategy for Data drives investment in local hosting, and AWS will open a Brandenburg region by late 2025 to satisfy residency rules. Manufacturers store real-time Scope-3 emissions for CSRD reporting, and banks refine Basel III calculations inside audit-ready lakes. The European Banking Authority’s 2025 stress-test templates reinforce technical requirements that lakehouses fulfill.

Competitive Landscape
The data lakes market is moderately fragmented. Hyperscalers-AWS, Microsoft Azure, Google Cloud-dominate infrastructure, leveraging global regions and integrated governance. Specialized platforms such as Databricks and Snowflake distinguish themselves on performance, notebook integration, and lakehouse completeness. Open-source communities steer Iceberg, Delta, and Hudi, giving buyers format options that loosen vendor grip.
Strategic acquisitions are reshaping value-chains. Databricks purchased Tabular in 2024 to tie Iceberg lineage into Delta workflows, signaling a bet on universal metadata. Fivetran bought Census in 2025, unifying ingestion and reverse ETL to close the activation loop-. Commvault’s 2024 Clumio deal adds ransomware-recovery snapshots for S3 lakes. These moves point to a future where integrated suites span ingestion, governance, protection, and activation.
Despite hyperscaler heft, the top five suppliers capture roughly 55% of total spend, leaving headroom for innovators that specialize in cost-optimization, cross-cloud query acceleration, and vertical-specific governance blueprints. AI-augmented data-quality observability and sovereign-cloud governance are two emerging white spaces likely to attract new entrants.
Data Lake Industry Leaders
Microsoft Corporation
Amazon.com Inc.
Capgemini SE
Oracle Corporation
Teradata Corporation
- *Disclaimer: Major Players sorted in no particular order

Recent Industry Developments
- May 2025: Fivetran acquired Census, adding reverse-ETL capabilities that activate data in operational systems.
- April 2025: The Federal Reserve proposed revisions to stress-capital buffer calculations, increasing demand for decade-deep risk data.
- January 2025: The U.S. Treasury released a report on how bank size affects capital-market efficiency, underscoring nuanced data-management needs.
- November 2024: The European Banking Authority issued 2025 stress-test templates that formalize data-input standards.


Global Data Lake Market Report Scope
A data lake is a centralized repository that allows consumers to store all the semi-structured, structured, and unstructured data at any scale. Consumers can store their data as-is without having to structure it first. They can run in different types of analytics, from dashboards and visualizations to big data processing, real-time analytics, and machine learning, to make better decisions.
The data lakes market is segmented by offering (solution, service), by deployment (cloud, on-premise), by end-user vertical (IT and telecom, BFSI, healthcare, retail, manufacturing, other end-user verticals)), by geography (North America (United States, Canada), Europe (United Kingdom, Germany, France, Italy, Rest of Europe), Asia Pacific (China, Japan, India, Rest of Asia Pacific), Latin America (Mexico, Brazil, Argentina, Rest of Latin America), Middle East and Africa (United Arab Emirates, Saudi Arabia, South Africa, Rest of the Middle East and Africa).
The market sizes and forecasts are provided in terms of value in USD for all the above segments.
| Solutions | Data Discovery and Cataloging |
| Data Integration and ETL/ELT | |
| Analytics and Visualization Tools | |
| Governance and Security Platforms | |
| Services | Professional Services (Consulting, Integration) |
| Managed Services |
| Cloud | Public Cloud |
| Private Cloud | |
| Hybrid/Multi-Cloud | |
| On-Premise |
| Large Enterprises |
| Small and Mid-Size Enterprises (SMEs) |
| Operations and Supply-Chain |
| Finance and Risk |
| Sales and Marketing |
| Human Resources |
| IT and Telecom |
| BFSI |
| Healthcare and Life Sciences |
| Retail and E-commerce |
| Manufacturing and Industrial |
| Media and Entertainment |
| Government and Public Sector |
| Energy and Utilities |
| Others (Education, Hospitality) |
| North America | United States |
| Canada | |
| Mexico | |
| South America | Brazil |
| Argentina | |
| Chile | |
| Peru | |
| Rest of South America | |
| Europe | Germany |
| United Kingdom | |
| France | |
| Italy | |
| Spain | |
| Rest of Europe | |
| Asia-Pacific | China |
| Japan | |
| India | |
| Australia | |
| New Zealand | |
| Rest of Asia-Pacific | |
| Middle East | United Arab Emirates |
| Saudi Arabia | |
| Turkey | |
| Rest of Middle East | |
| Africa | South Africa |
| Rest of Africa |
| By Offering | Solutions | Data Discovery and Cataloging |
| Data Integration and ETL/ELT | ||
| Analytics and Visualization Tools | ||
| Governance and Security Platforms | ||
| Services | Professional Services (Consulting, Integration) | |
| Managed Services | ||
| By Deployment | Cloud | Public Cloud |
| Private Cloud | ||
| Hybrid/Multi-Cloud | ||
| On-Premise | ||
| By Organization Size | Large Enterprises | |
| Small and Mid-Size Enterprises (SMEs) | ||
| By Business Function | Operations and Supply-Chain | |
| Finance and Risk | ||
| Sales and Marketing | ||
| Human Resources | ||
| By End-User Vertical | IT and Telecom | |
| BFSI | ||
| Healthcare and Life Sciences | ||
| Retail and E-commerce | ||
| Manufacturing and Industrial | ||
| Media and Entertainment | ||
| Government and Public Sector | ||
| Energy and Utilities | ||
| Others (Education, Hospitality) | ||
| By Geography | North America | United States |
| Canada | ||
| Mexico | ||
| South America | Brazil | |
| Argentina | ||
| Chile | ||
| Peru | ||
| Rest of South America | ||
| Europe | Germany | |
| United Kingdom | ||
| France | ||
| Italy | ||
| Spain | ||
| Rest of Europe | ||
| Asia-Pacific | China | |
| Japan | ||
| India | ||
| Australia | ||
| New Zealand | ||
| Rest of Asia-Pacific | ||
| Middle East | United Arab Emirates | |
| Saudi Arabia | ||
| Turkey | ||
| Rest of Middle East | ||
| Africa | South Africa | |
| Rest of Africa | ||


Key Questions Answered in the Report
Why are enterprises moving from warehouses to lakehouses?
Lakehouses lower analytics TCO by 35–40% and support AI model training on raw data while preserving ACID performance guarantees.
How big is the data lakes market in 2026?
The data lakes market is valued at USD 22.8 billion in 2026 and is forecast to reach USD 61.84 billion by 2031.
Which region is growing fastest for data lake adoption?
Asia-Pacific leads with a projected 23.5% CAGR between 2026 and 2031, driven by rapid digital transformation and sovereign-cloud investments.
What is the main challenge preventing data lakes from delivering value?
Metadata drift can turn lakes into “data swamps,” prompting investment in automated catalogs and lineage tracking to maintain trust.
How do open-table formats affect vendor lock-in?
Formats like Apache Iceberg and Delta Lake enable multi-cloud portability by decoupling storage from compute engines, letting teams query the same data across different clouds.
Which industry vertical is forecast to grow fastest?
Healthcare & life sciences is set to expand at a 25.6% CAGR through 2031, leveraging data lakes for precision medicine and real-time patient analytics.
Page last updated on:


