Market Overview
| Study Period | 2020 - 2031 |
|---|---|
| Forecast Data Period | 2026 - 2031 |
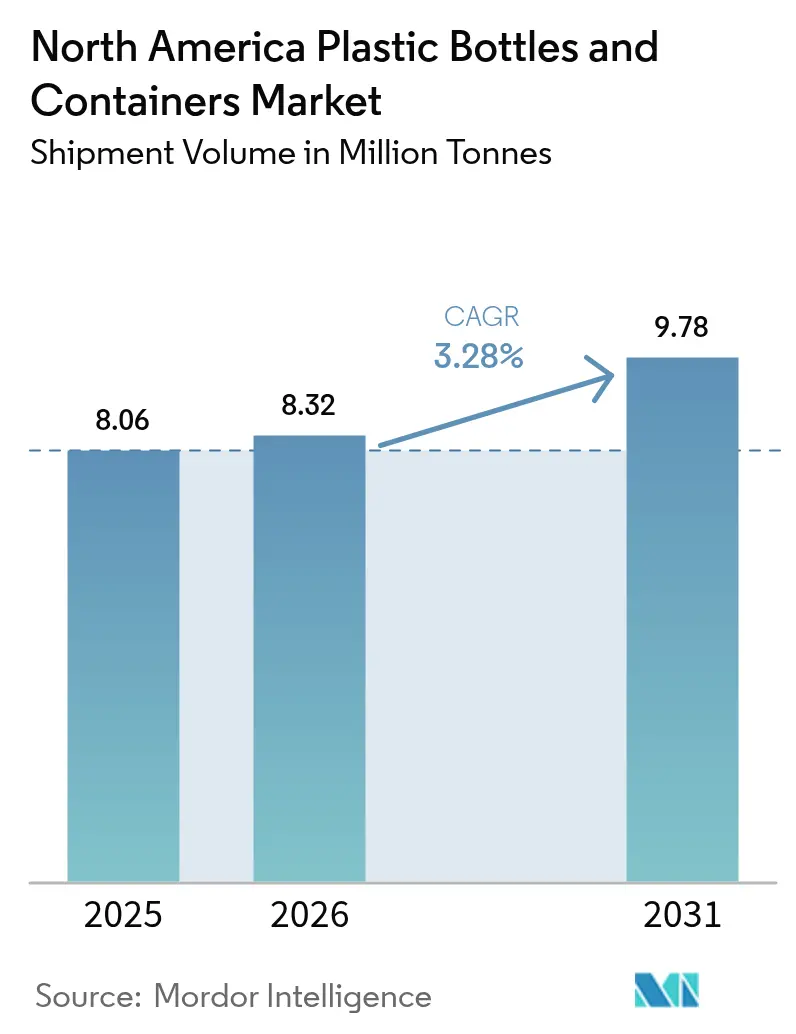
| Base Year Market Size (2025) | 8.06 Million tonnes |
| Market Volume (2026) | 8.32 Million tonnes |
| Market Volume (2031) | 9.78 Million tonnes |
| Growth Rate (2026 - 2031) | 3.28% CAGR |
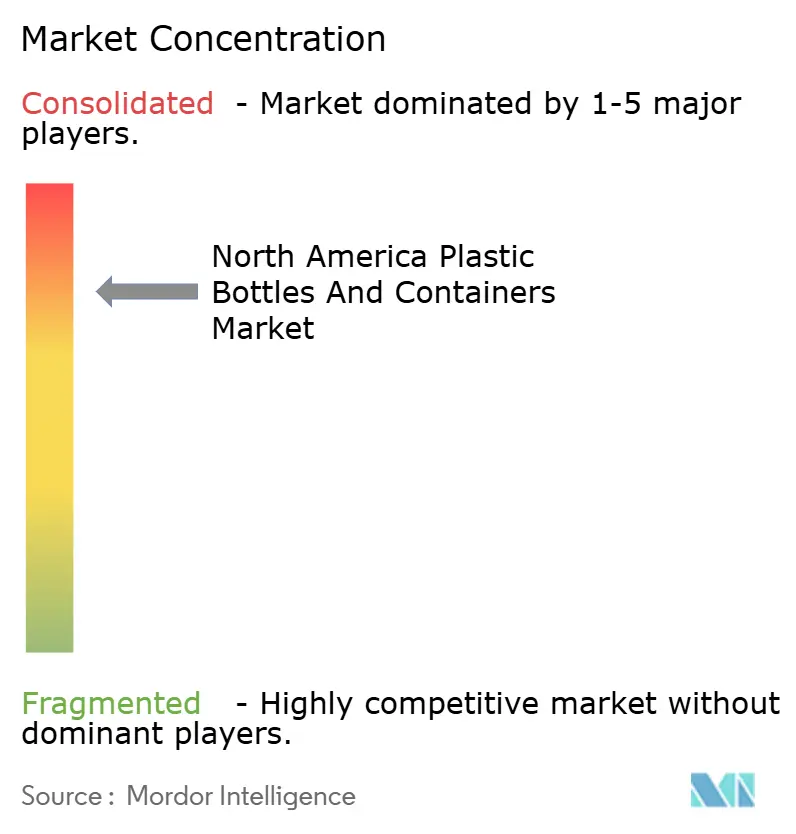
| Market Concentration | High |
Major Players *Disclaimer: Major Players sorted in no particular order Image © Mordor Intelligence. Reuse requires attribution under CC BY 4.0. | |
North America Plastic Bottles And Containers Market Analysis by Mordor Intelligence
North America plastic bottles and containers market size in 2026 is estimated at 8.32 million tonnes, growing from 2025 value of 8.06 million tonnes with 2031 projections showing 9.78 million tonnes, growing at 3.28% CAGR over 2026-2031. Steady gains stem from beverage, pharmaceutical, and e-commerce packaging demand, coupled with brand and regulatory pushes for lighter, more recyclable formats. State-level extended producer responsibility laws, most notably California’s SB 54, reward source-reduced designs and have elevated recycled-content specifications across supply contracts. Brand owners focus on cost-efficient lightweighting that curbs logistics emissions while meeting stringent FDA food-contact and child-resistance rules. Corporate consolidation, highlighted by Amcor’s January 2025 acquisition of Berry Global for EUR 7.8 billion (USD 8.4 billion), lets scaled suppliers secure feedstock, centralize R&D, and speed recycled-content rollouts. Meanwhile, volatile petrochemical pricing and localized single-use bans add margin and compliance risks, but deposit-return schemes and e-commerce durability needs continue to underpin demand for the North America plastic bottles and containers market.
Key Report Takeaways
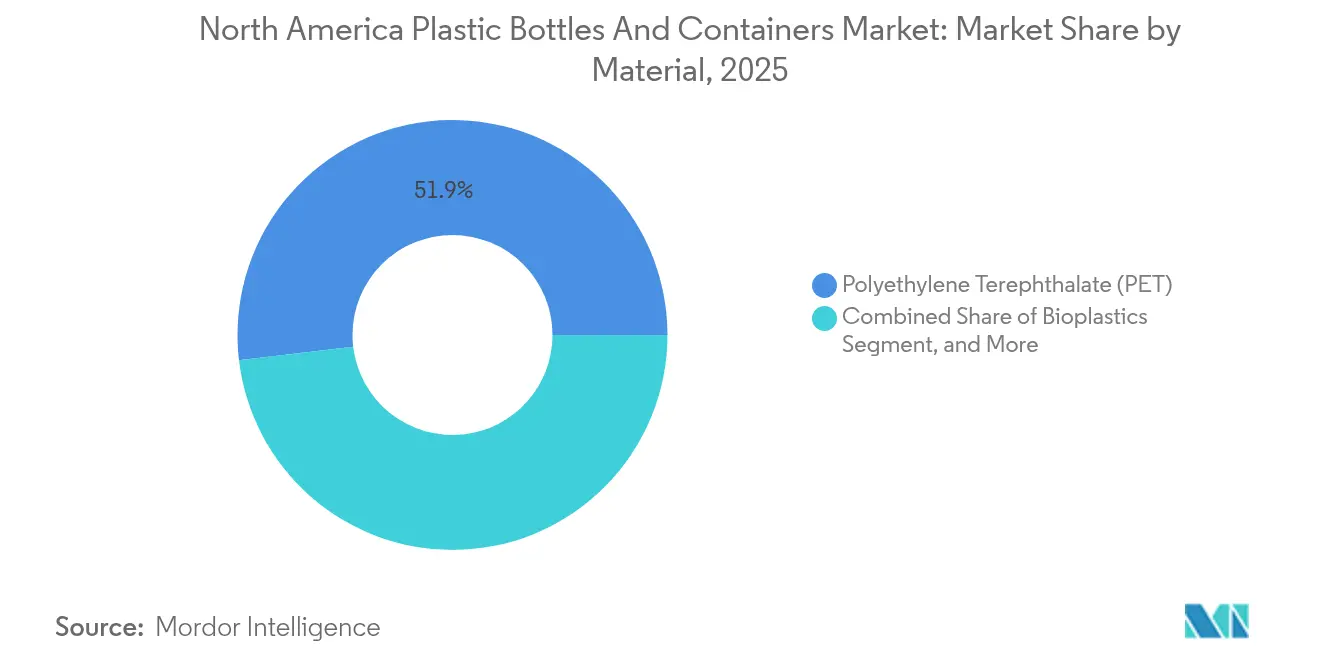
- By material, polyethylene terephthalate (PET) led with 51.87% share in 2025; bioplastics are forecast to advance at a 5.72% CAGR through 2031.
- By packaging type, bottles captured 47.78% volume in 2025, whereas ampoules and vials are set to expand at a 4.63% CAGR to 2031.
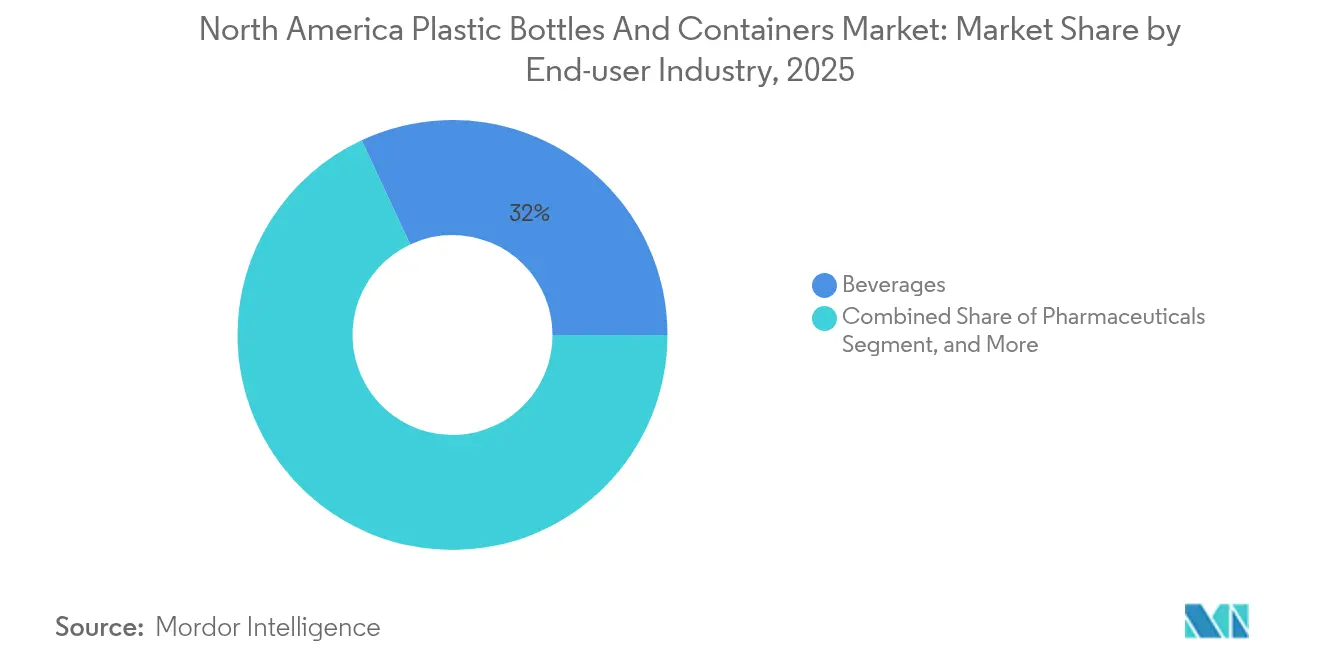
- By end-user segment, beverages held 31.95% of the North America plastic bottles and containers market share in 2025, while pharmaceuticals recorded the highest projected 5.33% CAGR through 2031.
- By manufacturing technology, injection stretch blow molding accounted for a 29.42% share in 2025; injection blow molding is projected to grow at a 5.01% CAGR to 2031.
- By country, the United States contributed 22.31% of the 2025 volume, whereas Mexico is pacing at a 5.78% CAGR through 2031, backed by nearshoring investment flows.
Note: Market size and forecast figures in this report are generated using Mordor Intelligence’s proprietary estimation framework, updated with the latest available data and insights as of 2026.
North America Plastic Bottles And Containers Market Trends and Insights
Drivers Impact Analysis*
| Driver | (~) % Impact on CAGR Forecast | Geographic Relevance | Impact Timeline |
|---|---|---|---|
| Rising lightweight-packaging adoption in beverages | +0.8% | United States and Canada, spill-over to Mexico | Medium term (2-4 years) |
| Deposit-return schemes boosting rPET bottle demand | +0.7% | United States and Canada | Medium term (2-4 years) |
| Premiumisation trend in cosmetics and personal-care SKU sizing | +0.6% | North America core, premium segments | Long term (≥ 4 years) |
| E-commerce demand spike for durable, shippable containers | +0.5% | Global, early gains in United States and Canada | Short term (≤ 2 years) |
| Craft RTD alcoholic beverages shifting to plastic cans | +0.4% | United States core, expanding to Canada | Medium term (2-4 years) |
| Source: Mordor Intelligence | |||
Rising lightweight-packaging adoption in beverages
Beverage producers intensify lightweighting to cut transport costs and meet climate pledges, achieving up to 15% bottle weight cuts without losing barrier strength through advanced injection stretch blow molding. Coca-Cola cut plastic usage across its North American operations by 20% in 2024, encouraged by dimensional-weight freight charges that reward slimmer pack formats. Consumer research still ranks portability and convenience ahead of material concerns, which sustains plastic adoption in outdoor recreation channels. FDA food-contact rules oblige brands to validate thinner walls for safety, spurring resin suppliers to commercialize higher-intrinsic-viscosity PET grades that maintain drop resistance. The driver will sustain mid-single-digit volume gains in premium hydration, flavored waters, and enhanced sports drinks through 2030.
Deposit-return schemes boosting rPET bottle demand
Ten U.S. states and multiple Canadian provinces operate deposit-return systems that raised regional PET recycling to 41.3% in 2024, well above global averages. Cleaner bales and closed-loop economics let converters certify food-grade recycled PET at scale, feeding brand pledges for 30-35% recycled content by 2035. California processed more than 18 billion beverage containers in 2024, creating a dense supply of high-quality rPET for bottle-to-bottle reprocessing. PepsiCo’s reset goals depend on a stable recycled supply, which lifts long-term resin contracts for reclaimed material. Equipment makers are responding by integrating decontamination modules and vision systems that validate pellet clarity in-line, accelerating rPET uptake across the North America plastic bottles and containers market.
Premiumisation trend in cosmetics and personal-care SKU sizing
Luxury skin-care and fragrance brands specify airless pumps, precision droppers, and refillable capsules that drive smaller-volume, higher-margin containers. AptarGroup invested heavily in airless solutions in 2024, noting double-digit dispenser growth across prestige categories. Unilever’s refill pilot lines reinforce the shift as shoppers seek both indulgence and sustainability cues. These formats need tight dimensional tolerance and advanced multilayer barriers to guard active ingredients, nudging converters toward injection blow molding platforms. Regulatory oversight under FDA cosmetic rules mandates extractables control, elevating technical hurdles but cementing value-added margins for suppliers.
E-commerce demand spike for durable, shippable containers
Online fulfillment reshapes container spec sheets, making drop resistance and leak prevention paramount. Amazon requires tamper-proof closures on liquids, driving heavy investment in fitment redesign and lab testing that simulates real-world shipping shocks. Prescription drug delivery adds child-resistant and DOT-compliant layers, further complicating packaging engineering. Dimensional-weight freight rules again reward lightweight yet rigid containers, sustaining innovation in optimized neck finishes and base geometries. Accelerated by pandemic-era habits, this driver has a short-term but outsized influence on the near-term trajectory of the North America plastic bottles and containers market.
Restraints Impact Analysis*
| Restraint | (~) % Impact on CAGR Forecast | Geographic Relevance | Impact Timeline |
|---|---|---|---|
| Volatile petro-feedstock prices | -0.9% | North America core, global supply chain impacts | Short term (≤ 2 years) |
| Escalating brand-owner sustainability commitments | -0.5% | United States and Canada, premium segments | Long term (≥ 4 years) |
| Municipal single-use-plastic bans in key U.S. states | -0.3% | United States core, selective municipalities | Medium term (2-4 years) |
| Emergence of aluminum bottles in sports drinks | -0.2% | United States and Canada, sports beverage segment | Medium term (2-4 years) |
| Source: Mordor Intelligence | |||
Volatile petro-feedstock prices
Natural-gas-linked ethylene costs swung by 25-30% in 2024, pinching margins for resin buyers locked into quarterly contracts. Smaller molders face 30-90-day pass-through lags that erode profitability during spikes. Plant outages at major Gulf Coast crackers amplify volatility, forcing converters to hedge or carry high inventory. Silgan trimmed USD 50 million of operating costs in 2024 to offset resin swings, illustrating the overhead burden placed on the supply base. Continued price turbulence weighs on near-term expansion plans within the North America plastic bottles and containers market.
Escalating brand-owner sustainability commitments
Global brands now interrogate life-cycle data and levy scorecards on suppliers, adding administrative costs and capex pressure. Coca-Cola tightened recycled-content targets but kept absolute tonnage flat, compelling converters to fund rPET processing lines. Extended producer responsibility fees penalize hard-to-recycle formats, nudging procurement toward mono-material solutions that can increase resin consumption per unit. Converters must reconcile higher compliance spending with razor-thin contract pricing, a restraint likely to temper long-run growth for the North America plastic bottles and containers market.
*Our forecasts treat driver/restraint impacts as directional, not additive. The impact forecasts reflect baseline growth, mix effects, and variable interactions.
Segment Analysis
By Material: PET Dominance Drives Recycling Innovation
PET supplied 51.87% of 2025 volume, retaining lead due to cost-effective barrier strength and a continent-wide collection network that supports closed-loop bottle-to-bottle programs. High-density polyethylene remains entrenched in dairy and household chemicals thanks to chemical resistance, whereas polypropylene commands heat-resistant drug and personal-care lines. Bioplastics, though just a niche today, are slated for a 5.72% CAGR, reflecting brand bids for compostable or low-carbon alternatives despite capacity shortages.
Intensified lightweighting lets converters shave 15% resin from PET bottles, translating to freight and carbon gains that sync with brand pledges. Regulatory attention to per- and polyfluoroalkyl substances is minimal for PET, further safeguarding its share. The North America plastic bottles and containers market size for PET will thus edge upwards, even as bioplastics nibble high-margin applications in premium cosmetics and specialty foods.


By Packaging Type: Bottles Lead While Precision Applications Grow
Bottles controlled 47.78% of 2025 shipments, serving beverages, personal care products, and household cleaners. New base geometries and optimized neck threads help maintain rigidity after weight reduction, locking in its dominance. Ampoules and vials are forecast to climb at 4.63% CAGR, propelled by parenteral drugs and biologics that require precise micro-dosing.
Pharmaceutical guidelines that stress particulate control and extractables run compliance costs high, cementing value-added pricing in these small formats. The North America plastic bottles and containers market size for ampoules will therefore outpace macro volumes as injectable therapies rise.
Other types, such as jars and canisters, remain important in premium beauty and food preservation niches, where barrier laminations guard oxygen-sensitive formulas.
By End-user Industry: Pharmaceuticals Accelerate Amid Beverage Maturity
Beverages supplied the largest 31.95% slice in 2025, driven by bottled water and functional drinks. Even so, pharmaceuticals hold the fastest 5.33% CAGR on the back of an aging population and direct-to-consumer prescription delivery. Drug-device combination products often integrate desiccants and tamper evidence, raising technical requirements.
Food brands leverage individual-serve designs that meet calorie-control lifestyles, while cosmetics promote airless dispensers with refill cartridges that align with luxury positioning. Industrial and automotive fluids fill larger size needs, demanding chemical resistance and UN-rated closures. Together, these niches keep unit diversity high across the North America plastic bottles and containers market.
By Manufacturing Technology: Precision Molding Gains Ground
Injection stretch blow molding captured 29.42% share in 2025, favored for even wall distribution in carbonated beverages and aseptic milk. Injection blow molding is primed for a 5.01% CAGR because its parison-controlled process excels at creating thick necks and small orifices suited for droppers and vials.
Extrusion blow molding defends commodity household chemicals, but energy-efficient all-electric machines now close some cost gaps for injection platforms. Husky’s 2024 launch of servo-driven ISBM units claims 20% energy savings, pushing adoption. As automation increases, the North America plastic bottles and containers market size attached to injection blow molding will widen, reshaping capex priorities.
Geography Analysis
The United States held a 22.31% share in 2025, supported by entrenched beverage and pharma ecosystems but slowed by maturity and rising compliance costs. Canada benefits from synchronous provincial EPR rules that simplify design-for-recycling choices, sustaining moderate growth.
Mexico stands out with a 5.78% CAGR to 2031 thanks to foreign direct investment in beverage plants and nearshoring that exploits labor and freight advantages under the USMCA. New Mexican facilities incorporate recycled-content extrusion lines and advanced ISBM machines, allowing rapid service to southern U.S. distribution hubs. The North America plastic bottles and containers market size expansion in Mexico offsets slower gains in the United States, balancing regional output.
The United States anchors the North America plastic bottles and containers market with deep beverage and pharmaceutical demand driven by FDA and EPA compliance regimes. Extended producer responsibility bills in California, Oregon, Maine, and Colorado load cost onto resin-intensive designs yet spark recyclable mono-material solutions. Municipal bans on single-use plastics in select cities compel alternate pack options, particularly for institutional channels such as universities and municipal parks. a ;
Canada’s harmonized EPR rollout reduces administrative drag and scales collection, while British Columbia’s high capture rates model effective circularity. Ontario’s Blue Box shift to full producer responsibility by 2026 accelerates design alignment on rPET bottles and HDPE monolayers. Premium personal-care production in Ontario and Quebec underpins steady demand for specialty dispensers and airless jars.
Mexico’s surge follows investment announcements by multinational beverage companies building high-speed ISBM lines near Monterrey and Guadalajara. These plants, equipped with in-house pelletizing for rPET flake, serve both domestic consumption and export loads into Texas. Supply-chain resilience attained through nearshoring diminishes trans-Pacific freight risk, cementing Mexico’s status as the fastest riser within the North America plastic bottles and containers market.
Value Chain Analysis
The value chain begins with feedstock and recycled-material sourcing. It covers virgin resins (notably PET, HDPE, and PP) from petrochemical producers and post-consumer bales from deposit-return and curbside collection systems. Material preparation and qualification include food-contact compliance, decontamination for rPET, and traceability, which then feed into preform production and blow molding (ISBM, EBM, and injection blow molding), as well as injection molding for closures and dispensing components.
Converters produce bottles, jars, canisters, and precision pharma formats for brand owners and contract fillers. Distribution is typically centered on high-volume beverage routes and regulated pharmaceutical supply chains that require child-resistant and tamper-evident performance. Collection and sorting systems, including deposit-return networks in parts of the United States and Canada, route material back to reclaimers and compounders, tightening bottle-to-bottle flows. Extended producer responsibility programs and reporting initiatives have also pushed policy and compliance functions deeper into day-to-day operations, increasing packaging data demands and affecting design-for-recycling decisions for inks, labels, closures, and mono-material choices. Consolidation across packaging manufacturing and adjacent segments further shapes the chain, with scale used to secure recycled-content feedstock and fund conversion upgrades, while capacity additions in Canada and Mexico help reduce lead times to North American filling operations.
Competitive Landscape
Consolidation has sharpened bargaining power on resin and machinery, capped by Amcor’s purchase of Berry Global in January 2025, which created a USD 24 billion revenue leader with USD 650 million in expected annual synergies.[3]Amcor plc, “Annual Report 2024 - Sustainability Initiatives and Market Performance,” amcor.com Silgan’s earlier move for Weener Packaging added dosing and dispensing know-how that fortifies its premium beauty and pharma positions. Graham Packaging’s USD 35 million Louisiana upgrade illustrates how incumbents retool with energy-efficient blow molders to hold share.
Technology race themes circle around lightweighting, high-PCR content, and digital process control. Husky’s servo upgrades and Aptar’s 30% PCR dispensing range prove that R&D budgets skew toward sustainability deliverables. New entrants chase bioplastics niches and chemical recycling loops, but high qualification costs in pharma and food restrict rapid scaling.
Feedstock volatility drives strategic hedging, while tight labor markets spur automation rollouts that cut unit labor minutes. White-space in aluminum bottle encroachment for sports drinks forces plastic suppliers to defend share through improved oxygen barriers and carbon footprint audits. Overall, the North America plastic bottles and containers market operates within a tightening oligopoly where scale, innovation speed, and recycled-content capability determine long-term survival.
North America Plastic Bottles And Containers Industry Leaders
Alpha Packaging Inc.
Gerresheimer AG
AptarGroup Inc.
Plastipak Holdings Inc.
Amcor plc
- *Disclaimer: Major Players sorted in no particular order

Market Opportunities and Future Outlook
EPR-driven redesign and recycled-content enablement are opening near-term opportunities in compliant formats, especially mono-material, high-PCR bottles and closures that address both performance expectations and reporting needs. California moved SB 54 implementation forward in May 2026, which increases the urgency of verified recyclability and source-reduction pathways and pushes brands to tighten specifications across supply contracts. This supports demand for in-region rPET and recycled PE capacity, as well as testing, certification, and digital traceability services that help brand owners document packaging attributes across multi-state and cross-border footprints.
Investment and vertical integration by beverage and resin participants are also strengthening opportunities across preform, cap, and reclaim linkages. In 2026, Coca-Cola Canada Bottling announced a CAD 141 million expansion in Brampton, Ontario, reflecting ongoing throughput needs for high-volume bottle formats. CG Roxane expanded its Benton, Tennessee site to bring cap and preform manufacturing in-house alongside rPET-related operations. On the materials side, Nova Chemicals began taking commercial orders in 2026 for its Syndigo recycled polyethylene resin from an Indiana facility, supporting broader recycled PE use in nonfood applications and building a pathway toward food-grade recycled resins. Recycling-side moves such as Niagara Bottling securing a Vernon, California facility to reprocess post-consumer PET into food-grade containers point to more localized circular supply chains, reducing reliance on long-haul material flows while improving supply certainty for converters and brand owners.
Recent Industry Developments
- April 2026: Amcor opened an advanced healthcare packaging coating facility in Malaysia, expanding its global capability set in regulated healthcare packaging. The added coating and conversion capacity supports higher-value pharma and medical packaging programs that also influence North American supply strategies through network optimization and technology transfer.
- December 2025: AptarGroup acquired Sommaplast, a provider of oral dosing pharmaceutical packaging solutions, including closures and dispensing systems. The deal strengthens Aptar's presence in dosing and delivery components that pair with bottles and containers in pharmaceutical and OTC applications, deepening its ability to offer integrated packaging systems to brand owners.
- April 2025: Amcor completed its combination with Berry Global, creating a larger packaging supplier with broader consumer and healthcare packaging coverage. The integration increases scale for R&D and procurement, which can accelerate lightweighting and recycled-content rollouts across bottles, containers, and related closures in North America.


Research Methodology Framework and Report Scope
Market Definition and Coverage
For this study, the market covers plastic bottles and plastic containers used to package products across North America, with demand tracked through the conversion of major packaging resins into finished bottle and container formats.
Scope exclusions: We exclude non-plastic packaging formats and do not count secondary packaging such as cartons, wraps, or pallets.
Segmentation Overview
- By Material
- Polyethylene Terephthalate (PET)
- High-Density Polyethylene (HDPE)
- Polypropylene (PP)
- Low-Density Polyethylene (LDPE)
- Bioplastics
- Other Plastics
- By Packaging Type
- Bottles
- Jars and Canisters
- Jerrycans
- Ampoules and Vials
- Other Packaging Types
- By End-user Industry
- Beverages
- Non-Alcoholic Beverages
- Bottled Water
- Carbonated Soft Drinks
- Dairy and Functional Drinks
- Other Non-Alcoholic Beverages
- Alcoholic Beverages
- Non-Alcoholic Beverages
- Food
- Pharmaceuticals
- Cosmetics and Personal Care
- Industrial Chemicals
- Other End-user Industries
- Beverages
- By Manufacturing Technology
- Extrusion Blow Moulding
- Injection Stretch Blow Moulding
- Injection Blow Moulding
- Compression Blow Moulding
- Other Manufacturing Technologies
- By Country
- United States
- Canada
- Mexico
Data Sources, Market Sizing, and Validation
Desk Research
Desk research was used to set the starting market structure and to put guardrails around volumes, trade flows, and end-use demand patterns. We relied on public data series and technical references such as US Census Bureau manufacturing and trade releases, USITC trade statistics, Statistics Canada tables, Mexico INEGI industrial statistics, and EPA packaging and waste publications, followed by peer-reviewed papers on packaging and polymers.
On top of that, we reviewed company annual reports, investor presentations, association publications, and reputable press to understand capacity additions, lightweighting direction, and recycled content targets. A paid subscription covering company financials and another subscription covering shipment-level import and export records were also used to sanity-check supplier exposure and material movement by category. The sources listed above are illustrative only, and we also referred to other public documents and datasets for data collection, validation, and research clarification.
Primary Interviews and Surveys
Primary interviews and surveys focused on validating real-world conversion volumes, demand shifts by end use, and how material substitution is playing out across PET, HDPE, PP, and other resins. We spoke with a mix of packaging converters, resin-linked stakeholders, and downstream buyers across the United States, Canada, and Mexico, and we used these inputs to close information gaps and re-check growth assumptions.
Distribution of primary research fieldwork respondents
| Company type | Respondent position | Region |
|---|---|---|
| Top tier: 37% | CXOs: 14% | |
| Mid tier: 48% | Functional/Unit leaders: 27% | |
| Smaller Players: 15% | Managers: 59% |
Market-Sizing & Forecasting
Sizing starts from a top-down build where resin conversion into bottles and containers is reconstructed using production and trade indicators, and then allocated into end-use packaging demand. To keep totals realistic, we also use selective bottom-up approximations, such as sampled converter output checks, typical resin-to-pack yield factors, and volume cross-checks by major pack formats.
Key inputs used in the model include apparent consumption signals for polymers used in bottles and containers, manufacturing output trends for plastic packaging, import and export movements for relevant pack formats and resin-linked intermediates, lightweighting trends that change grams per pack over time, and end-use indicators tied to beverages, food, home care, and personal care. When a data point is missing for a smaller country slice or a niche end use, we handle the gap by using proxy ratios from close peer categories and then re-test the approach through interviews before finalizing.
For forecasting, scenario analysis is used so growth can be flexed based on recycled content adoption speed, regulatory timing for packaging waste, and expected changes in product mix that affect container weight. The final outlook is then aligned with what industry experts see for capacity additions and material substitution, and we adjust when those views consistently point to a different trajectory.
Data Validation & Update Cycle
Outputs are validated through triangulation across independent signals, followed by variance checks by country and by major end uses, so sudden jumps in volumes are questioned before sign-off. We also run reasonability checks against known capacity movements and trade shifts, and outliers are flagged for a second analyst review before the numbers are locked.
The work is refreshed annually, and interim updates are triggered when major regulation changes, plant start-ups, or sharp raw material dislocations are observed. Right before delivery, we complete a final pass so clients receive a current view rather than an older model snapshot.
Mordor Intelligence's North America Plastic Bottles Containers Market Size Compared Against Other Published Estimates
Published market sizes for plastic bottles and containers in North America can look far apart because the measurement basis is not always the same, and the year used for the headline can also differ. Some sources size the market in revenue, while others focus on shipment volume, which changes what gets counted and how growth is expressed.
The biggest gap drivers here typically come from value versus volume reporting, differences in whether broader rigid packaging items like tubs, closures, or other container types are folded into the total, and how pricing is handled when resin and conversion costs move quickly. Another driver is refresh cadence, where older price decks or exchange-rate timing can inflate or compress value estimates across the United States, Canada, and Mexico.
Benchmark comparison
| Source | Market Size | Gaps in Research Methodology |
|---|---|---|
| Mordor Intelligence | USD 8.06 M (2025) | |
| Global Consultancy A | USD 20.80 B (2024) | This figure is value-based and can trend higher when broader container baskets are priced together and resin-linked cost pass-through assumptions are applied across a wider set of packaging formats. |
| Regional Consultancy B | USD 37.92 B (2021) | This figure uses an older base year and is revenue-based, which can reduce comparability if inflation, currency timing, and a wider definition of plastic packaging are embedded in the headline total. |
The table highlights a clear issue, volume in tonnes versus revenue in USD is being mixed across publications. By keeping the headline tied to shipment volume and limiting scope to bottles and containers rather than a broader rigid packaging basket, the spread becomes easier to explain and to replicate in updates, which is consistent with how the market is treated by Mordor Intelligence.


Key Questions Answered in the Report
How big is the North America plastic bottles and containers market today?
It totaled 8.32 million tonnes in 2026 and is projected to reach 9.78 million tonnes by 2031 at a 3.28% CAGR.
Which material leads regional demand?
PET holds 51.87% of 2025 volume because of superior barriers and broad recycling access.
What is the fastest-growing end-user segment?
Pharmaceuticals are forecast to rise at 5.33% CAGR through 2031 thanks to aging demographics and e-pharmacy channels.
Why is Mexico’s growth outpacing the United States?
Nearshoring investments and USMCA trade benefits are propelling Mexico at a 5.78% CAGR to 2031.
How are deposit-return schemes affecting supply?
State and provincial programs lifted PET recycling to 41.3% in 2024, enlarging food-grade rPET availability for new bottle production.
What impact does feedstock volatility have on producers?
25-30% swings in ethylene costs compress margins, prompting cost cuts and hedging strategies across converters.
Page last updated on:


