Market Overview
| Study Period | 2020 - 2031 |
|---|---|
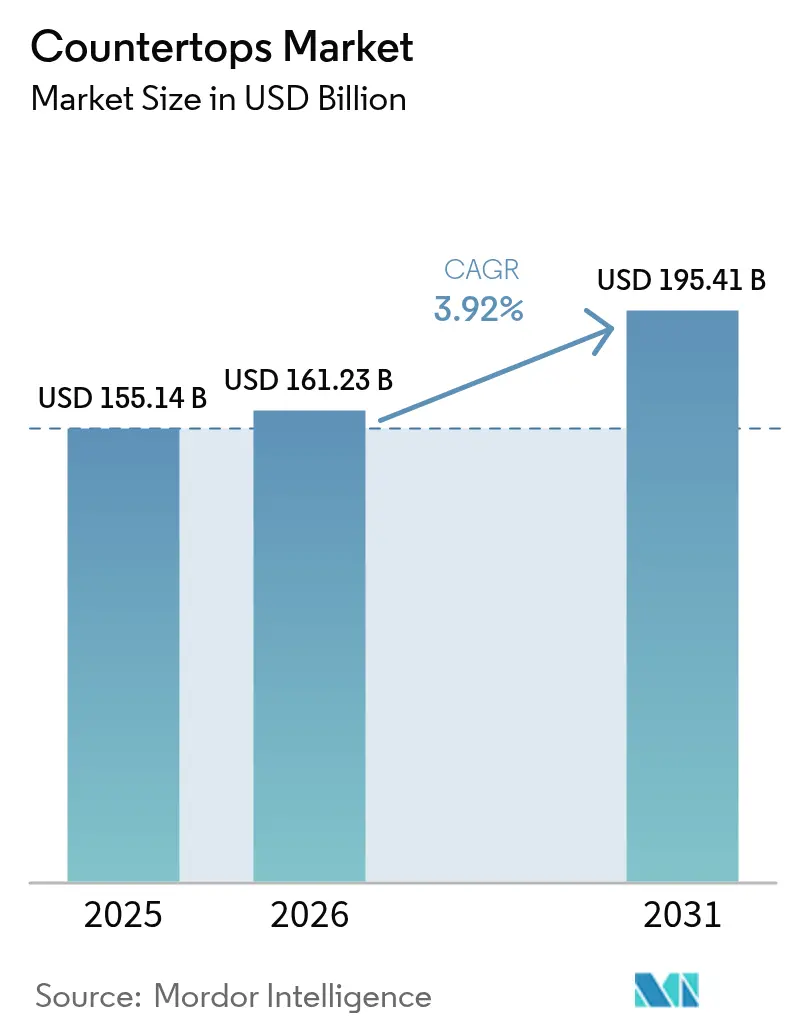
| Market Size (2026) | USD 161.23 Billion |
| Market Size (2031) | USD 195.41 Billion |
| Growth Rate (2026 - 2031) | 3.92% CAGR |
| Fastest Growing Market | Asia Pacific |
| Largest Market | Asia-Pacific |
| Market Concentration | Medium |
Major Players *Disclaimer: Major Players sorted in no particular order Image © Mordor Intelligence. Reuse requires attribution under CC BY 4.0. | |
Countertops Market Analysis by Mordor Intelligence
Countertops market size in 2026 is estimated at USD 161.23 billion, growing from 2025 value of USD 155.14 billion with 2031 projections showing USD 195.41 billion, growing at 3.9% CAGR over 2026-2031. This organic expansion illustrates the sector’s resilience, as demand persists even while broader construction spending cycles fluctuate. Rapid urbanization in Asia-Pacific, improving household disposable incomes in several emerging economies, and consistent renovation activity in North America and Europe together form the strongest volume catalysts. Meanwhile, a steady trend toward premium surfacing materials supports value growth, because engineered quartz, sintered stone, and large-format porcelain carry higher average selling prices than commodity granite. Across the supply chain, sustainability requirements, stricter worker-safety mandates, and the emergence of omnichannel retailing each create new avenues for differentiation and margin protection.
Key Report Takeaways
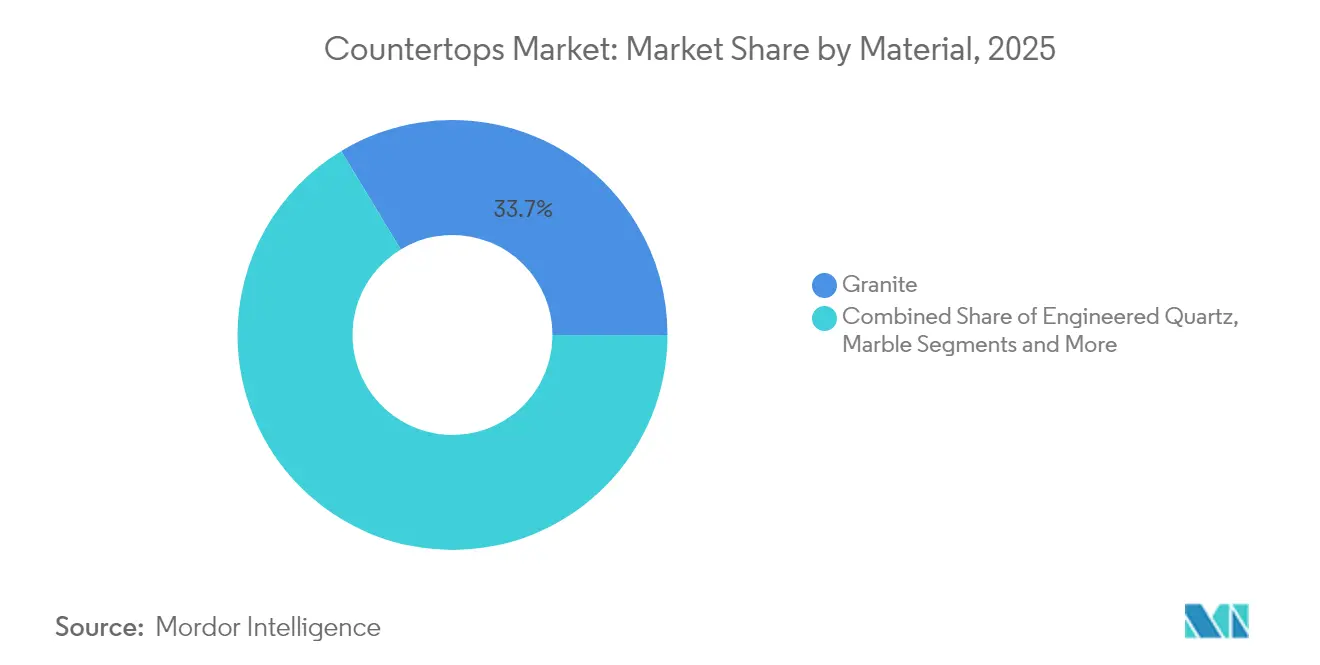
- By material, granite held 33.65% revenue share of the countertops market in 2025; engineered quartz is forecast to grow at 7.12% CAGR through 2031.
- By end-user, residential construction commanded 61.80% of the countertops market in 2025, while that same segment is projected to progress at 4.63% CAGR to 2031.
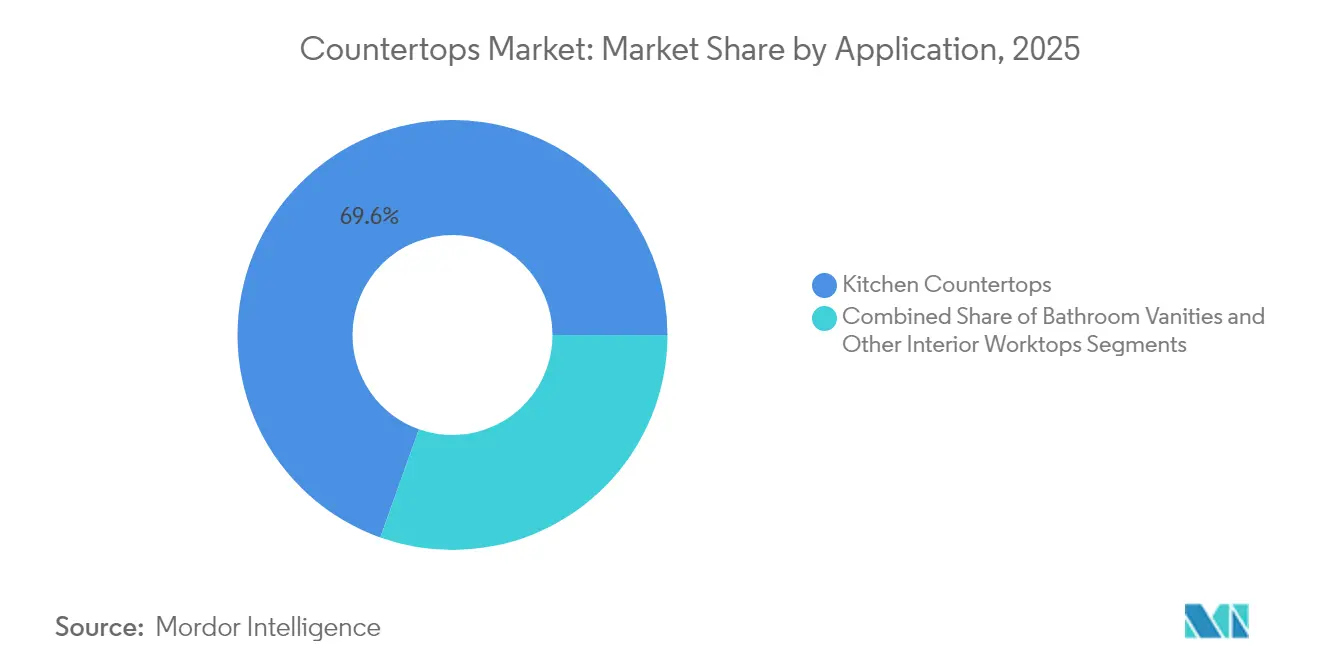
- By application, kitchen countertops captured 69.55% share of the countertops market size in 2025 and are advancing at a 5.18% CAGR through 2031.
- By installation type, renovation projects represented 55.70% of the countertops market in 2025, and new construction installs show the swiftest growth at 4.89% CAGR.
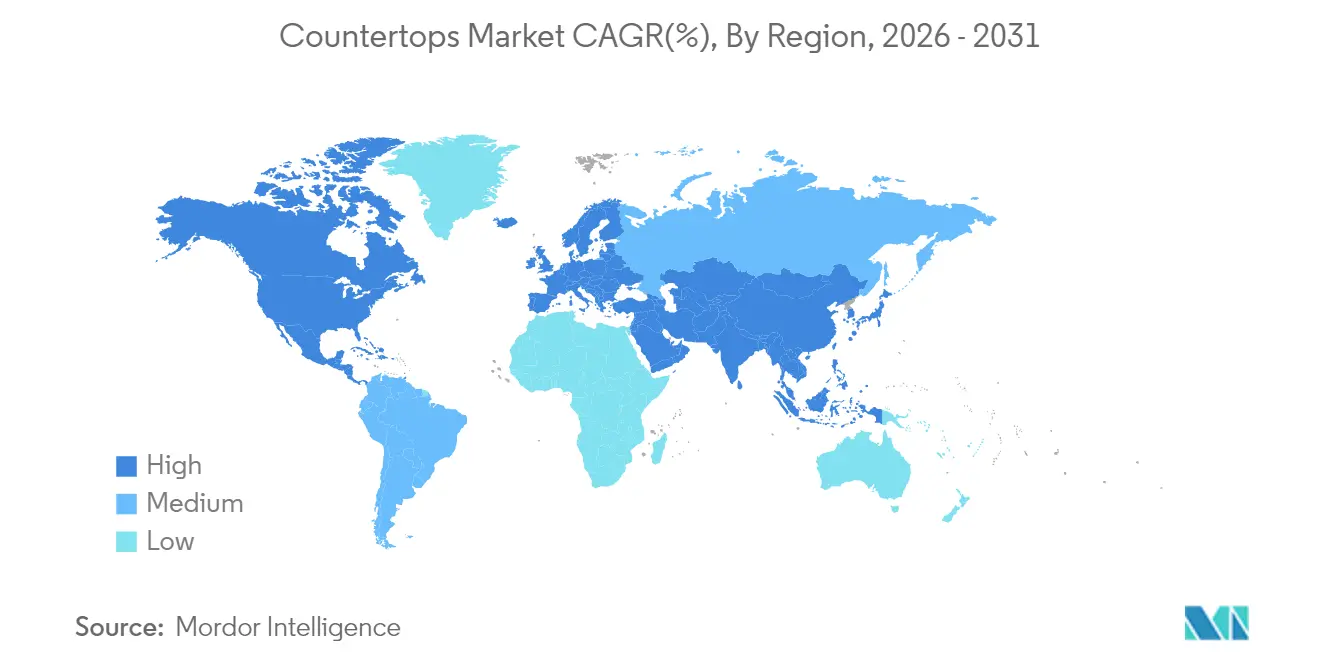
- By geography, Asia-Pacific accounted for 37.05% countertop market share in 2025 and exhibits the fastest regional CAGR at 6.02% through 2031.
Note: Market size and forecast figures in this report are generated using Mordor Intelligence’s proprietary estimation framework, updated with the latest available data and insights as of 2026.
Global Countertops Market Trends and Insights
Drivers Impact Analysis*
| Driver | (~) % Impact on CAGR Forecast | Geographic Relevance | Impact Timeline |
|---|---|---|---|
| Rising residential remodeling & kitchen renovations | +1.2% | Global (strongest in North America & Europe) | Medium term (2-4 years) |
| Growing adoption of engineered quartz surfaces | +0.8% | Global (led by North America & Asia-Pacific) | Long term (≥ 4 years) |
| Expansion of organized retail & home-improvement chains | +0.6% | Asia-Pacific core; spill-over to MEA | Medium term (2-4 years) |
| Shift toward antibacterial, non-porous countertops | +0.4% | Global (accelerated in developed markets) | Short term (≤ 2 years) |
| Thin-slab sintered-stone tech cuts export logistics cost | +0.3% | Global (exporters in Europe & Asia benefit) | Long term (≥ 4 years) |
| Circular-economy recycling of stone off-cuts | +0.2% | North America & EU, expanding in Asia-Pacific | Long term (≥ 4 years) |
| Source: Mordor Intelligence | |||


Rising Residential Remodelling & Kitchen Renovations
Kitchen renovation remains the single largest trigger for countertop replacement projects, because homeowners perceive surface upgrades as high-impact improvements that immediately elevate both aesthetics and everyday usability. Mortgage-rate volatility has lengthened ownership tenure, which in turn nudges households to remodel rather than relocate, a pattern that supports sustained spending on premium worktops. Public disclosures from The Home Depot and Lowe’s for fiscal 2024 reveal softer year-over-year comps but confirm that kitchen categories outperformed other discretionary project lines, underscoring countertops’ relative resilience. Fabricators also report that open-concept floor plans are raising average linear-foot requirements, boosting material volumes per job. Over the medium term, housing stock age in the United States, Canada, and much of Western Europe will keep remodel pipelines active, because properties built in the early-2000s boom are now entering their first full renovation cycle.
Growing Adoption of Engineered Quartz Surfaces
Engineered quartz combines high compressive strength and a non-porous matrix, eliminating the need for periodic sealing while offering superior stain resistance relative to most natural stones. Continuous-casting technology now delivers patterns that convincingly emulate marble veining, which broadens appeal to design-forward buyers. Health Canada’s 2025 reaffirmation of crystalline silica as a Category 1A carcinogen has tightened industrial hygiene requirements during fabrication, yet leading slab producers have moved to mitigate shop-floor risk through lower-silica formulations and automated wet-cutting work cells. Demand remains robust because owners value the predictability of quartz performance, and builders appreciate its stable supply chains versus certain exotic granites that face quarry-output fluctuations. Over the next five years, incremental cost reductions driven by scale, resin substitution, and thinner-slab offerings should further accelerate quartz’s share capture.
Expansion of Organized Retail & Home-Improvement Chains
Big-box retailers, specialty DIY chains, and digitally native e-commerce platforms have converged on a showroom-plus-fabrication model that integrates design, quotation, and professional installation under a single contract. In countries such as India, Indonesia, and Vietnam, publicly listed hardware chains doubled their footprint between 2022 and 2024, giving international brands shelf space previously monopolized by fragmented stone yards. These retailers offer consumer-credit facilities and extended warranties, smoothing the buyer journey and pulling premium materials deeper into the mass-market segment. In parallel, enterprise resource-planning integrations now feed real-time slab availability to in-store kiosks, shortening decision cycles and reducing costly over-ordering. Although slower macroeconomic conditions can trim traffic, the high gross margins of countertop programs ensure that retailers continue giving the category prime floor space.
Shift Toward Antibacterial, Non-Porous Countertops
COVID-19 heightened preferences for hygienic interiors, pushing engineered quartz, solid surface acrylics, and glazed porcelain into top-of-mind consideration lists for both homeowners and facility managers. Antimicrobial additive packages—often silver-ion or copper-infused—have become standard in the latest product launches from Cosentino and DuPont, according to their 2025 corporate fact sheets. In commercial kitchens and healthcare environments, regulatory codes already stipulate easy-to-sanitize work surfaces, which means contractors specify non-porous slabs during project planning rather than conducting later substitutions. Residential adopters subsequently borrow these material preferences, especially when media coverage of foodborne illness outbreaks spikes. The design community further reinforces the trend by favoring waterfall edges and integrated sinks that remove typical grout lines where bacteria can harbor.
Restraints Impact Analysis*
| Restraint | (~) % Impact on CAGR Forecast | Geographic Relevance | Impact Timeline |
|---|---|---|---|
| Raw material & energy price volatility | -0.7% | Global (especially Asia-Pacific & Europe) | Short term (≤ 2 years) |
| Stricter silica-dust exposure regulations | -0.5% | Global (led by North America & Europe) | Medium term (2-4 years) |
| Trade tariffs on fabricated stone | -0.4% | Global trade routes; US-Asia corridors | Short term (≤ 2 years) |
| Integrated premade cabinetry | -0.3% | North America & Europe; spreading to APAC | Long term (≥ 4 years) |
| Source: Mordor Intelligence | |||
Raw-Material & Energy Price Volatility
Quartz sand, polyester resins, pigments, and diesel together account for more than half of the engineered-stone cost of goods sold, so price spikes translate directly into margin squeeze. Europe’s 2024 natural-gas shock forced kiln operators to run curtailed schedules, which tightened porcelain slab availability and raised spot prices for installers. In Asia, fluctuating freight rates and currency shifts create additional uncertainty because importers often purchase slabs in USD but sell in local currencies with thin buffers. Fabricators try to hedge by maintaining larger inventories, yet that ties up working capital and raises warehouse overhead. Consequently, some distributors now experiment with variable-rate quotation software that links retail pricing to resin and energy indices published by commodity exchanges.
Stricter Silica-Dust Exposure Regulations
The United States Occupational Safety and Health Administration enforces an action level of 25 µg/m³ for respirable crystalline silica, while Australia introduced even tougher draft proposals in 2025[1]Occupational Safety and Health Administration, “Respirable Crystalline Silica Standard,” osha.gov . Meeting these thresholds requires closed-loop water-fed tools, high-vacuum extraction, and personal air-monitoring programs—all expensive for small shops with limited cash flow. Non-compliance carries stiff penalties that can shutter businesses, accelerating consolidation as larger firms acquire under-capitalized competitors. In the longer term, potential migration toward low-silica sintered stones could alleviate some occupational-health costs but would force additional retraining and tooling-change investments.
*Our forecasts treat driver/restraint impacts as directional, not additive. The impact forecasts reflect baseline growth, mix effects, and variable interactions.
Segment Analysis
By Material: Engineered Surfaces Challenge Natural Stone Dominance
Granite commanded 33.65% of the countertops market size in 2025, a testament to its long-standing reputation for durability, colour variety, and broad price segmentation that ranges from entry-level domestic stones to exotic high-end imports. However, engineered quartz tallied the fastest growth trajectory at 7.12% CAGR, driven by factory-controlled consistency and cost-effective pattern replication that appeals to contractors seeking predictable yields. Marble’s share has held steady in luxury hospitality and formal residential environments, although its susceptibility to etching and staining limits penetration into mass-market kitchens. Solid surface acrylics, notably DuPont Corian, remain staples in healthcare and education projects where seamless joints satisfy stringent cleaning protocols. Large-format porcelain slabs have begun to erode granite’s share by offering similar veining aesthetics, better UV resistance, and far slimmer thicknesses, which align with contemporary design preferences.
End-users are also experimenting with niche materials such as recycled glass and concrete for bespoke statement pieces, though these still represent single-digit share slices. The relative cost of stainless-steel tops remains high, confining adoption primarily to commercial food-preparation environments. Supply dynamics are equally diverse: multinational conglomerates operate integrated quarry-to-slab mills, while regional fabricators secure exotic blocks via containerized imports, then customize locally. Collectively, such innovations are reshaping material-selection criteria, tilting the competitive balance toward engineered options that promise easier maintenance, traceable sourcing, and aligned ESG credentials.


By End-User: Residential Demand Drives Market Growth
The residential segment contributed 61.80% of 2025 revenue, reflecting both new-build completions and retrofit upgrades across mature housing markets. Single-family remodels, especially in Sun Belt states, demonstrate average per-project surface requirements exceeding 60 square feet, underpinned by the popularity of oversized islands. In multi-family developments, developers increasingly specify mid-tier quartz instead of entry-level laminate to position units competitively in crowded rental markets. Moreover, social-media design influencers propagate rapid trend cycles, pushing color and finish experimentation that further lifts replacement demand even before functional life expires.
Although commercial demand constitutes only a small portion of overall sales, it demonstrates significant diversity. Quick-service restaurant chains replace tops every five to seven years due to branding refreshes, while boutique hotels specify distinctive natural-stone slabs to create site-specific aesthetics. Healthcare facilities install solid surface sheets that allow on-site repair after strong disinfectant exposure, thereby protecting lifecycle costs. Office-fit-out volumes remain muted because hybrid-work models reduce new builds, but co-working operators still invest in durable yet visually arresting reception counters to reinforce brand identity. Overall, residential and commercial cycles do not always coincide, giving manufacturers an element of demand hedging that moderates aggregate volatility.
By Application: Kitchen Countertops Maintain Central Position
Kitchen worktops represented 69.55% of application volume in 2025 and continue to expand at a 5.18% CAGR due to the kitchen’s shift from pure utility zone to social nucleus of the home. Island installations frequently exceed 9 ft in single span, requiring wide-body slabs that manufacturing advances now supply routinely. Appliance integration—such as flush-mount induction cooktops—drives demand for heat-resistant porcelain, while downdraft vents and pop-up sockets require precise CNC cut-outs, elevating fabrication complexity and value add. Designers embrace waterfall edges for visual continuity, doubling the vertical surface area consumed per project and increasing total material tonnage. Furthermore, open-plan layouts mean countertops form part of sightlines from living and dining areas, incentivizing homeowners to invest in visually striking materials.
Bathroom vanities account for the second-largest share and benefit from growth in luxury en-suite layouts that feature double-sink configurations. Powder rooms have emerged as design showcases, where rare marble or recycled-glass slabs fulfill a statement role. Laundry rooms, once relegated to laminate, increasingly receive mid-market quartz as households pursue cohesive aesthetics across tertiary spaces. Outdoor kitchens capitalize on higher-density porcelain and certain granites that withstand freeze-thaw cycles, a niche expanding in warmer climates but also appearing in cold-climate second homes with heated patio features. The aggregate impact of these use-case expansions ensures that application diversity continues to widen, reinforcing up-selling opportunities even within existing footprints.
By Installation Type: Renovation Projects Lead Market Activity
Renovations generated 55.70% of global revenue in 2025, underscoring how existing housing stock serves as a perpetual demand engine when ownership tenures lengthen. Older granite tops installed during the 1990s and early 2000s boom are reaching aesthetic obsolescence, prompting replacements regardless of structural integrity. Insurance-funded repairs after plumbing failures or storm damage introduce forced substitution events, contributing several percentage points to annual volume in cyclone- and hurricane-prone regions. Meanwhile, programmatic renovation incentives—such as Germany’s Building Efficiency Act—encourage sustainable material swaps, indirectly stimulating countertop turnover. Digital measurement apps now enable franchised installers to capture field dimensions remotely, compressing lead times and making retrofit projects less disruptive for occupants.
New construction installs hold the higher forward CAGR of 4.89%, fueled by public housing initiatives in China, private developer activity in India, and single-family starts in the United States Sun Belt. Builders increasingly lock in national supply agreements with slab producers to secure just-in-time deliveries, a practice that reduces on-site breakage and working-capital requirements. In higher-end subdivisions, specification upgrades from laminate to Quartz Level 1 afford developers marketing differentiation at minimal incremental cost relative to total house price. Multifamily developers choose standardized vanity modules with pre-mounted tops to shorten punch-list cycles and reduce job-site labour. Altogether, installation-type diversification helps producers balance the seasonal ebb and flow intrinsic to construction schedules.
Geography Analysis
In 2025, the Asia-Pacific region contributed 37.05% to the global countertop market revenue. With a projected CAGR of 6.02%, the region is poised to drive significant market growth. China’s urbanization pipeline remains large, with provincial governments subsidizing first-home purchases that include standardized kitchen fit-outs, each specified with at least one engineered-stone slab per dwelling. India’s Smart Cities Mission has accelerated the build-out of municipal infrastructure as well as supporting private high-rise residential schemes, leading to robust demand for affordable granite sourced domestically from Rajasthan and Karnataka. Southeast Asian economies, especially Vietnam and Indonesia, show double-digit housing-start growth, and rising disposable incomes draw consumers toward mid-tier quartz surfaces stocked by expanding home-center chains. Japanese and South Korean renovation markets are mature yet attractive, because per-square-foot spending stays high as consumers replace aging laminate with premium porcelain to achieve sleek, minimalist aesthetics. Australian demand benefits from high immigration and frequent flip-cycles in metropolitan housing, although distance from major slab-export origins keeps landed costs elevated and encourages local quarry development.
By 2025, North America is projected to lead the countertops market, with the United States contributing over four-fifths of the regional volume. This dominance is attributed to its extensive installed housing base and the widespread adoption of a do-it-for-me remodeling approach. Canada’s countertop market demonstrates faster relative quartz uptake because provincial building codes and insurance guidelines emphasize non-porous materials to mitigate mold risk in colder climates. Mexico is emerging as a fabrication hub for export into the United States, capitalizing on favourable United States-Mexico-Canada Agreement (USMCA) provisions that sidestep punitive tariffs on Asian imports. Despite near-term headwinds from elevated mortgage rates, publicly traded U.S. fabricators still report healthy backlogs, as homeowners prioritize kitchen over discretionary furnishings according to 2025 earnings calls. Region-wide, heightened worker-safety scrutiny around silica dust is catalysing capital expenditure on water-jet profiling and robotic polishers, levelling advantages toward better-capitalized mid-cap operators.
In 2025, Europe faced economic headwinds but leveraged renovation subsidies targeting energy efficiency, which were often integrated with interior upgrade initiatives. Italy and Spain maintained their leadership in the marble and granite market, contributing over half of the EU's block export volumes. Concurrently, Central European manufacturers, particularly in Poland and Czechia, increasingly prioritized value-added processing of engineered stone. High electricity tariffs have spurred kiln-energy innovations; several Iberian porcelain plants adopted microwave-assisted sintering in 2024. Scandinavian consumers demonstrate a strong appetite for certified sustainable materials, so recycled glass and bio-resin quartz command premium shelf space in Swedish and Norwegian showrooms. Brexit-related customs check momentarily slowed slab imports into the United Kingdom during 2024, but inventory normalization occurred by mid-2025, and local distributors diversified sources toward Türkiye and Italy to mitigate future border frictions.

Competitive Landscape
The countertops market exhibits moderate fragmentation, with the top five manufacturers collectively accounting for a notable share of the global market. This structure presents opportunities for consolidation through mergers and regional bolt-on acquisitions. DuPont leverages its well-established Corian brand to dominate the solid surface sheets segment, which is widely utilized in healthcare and education refurbishments due to its seamless joins that enhance infection control[3]DuPont, “Bio-Based Corian Design Week Launch,” dupont.com . LX Hausys, Vicostone, and several Chinese companies, including Fasa Industrial, occupy the next competitive tier, securing their positions through strategic regional distribution and OEM private-label agreements.
Strategic themes center on vertical integration, digital engagement, and ESG positioning. Several large players added Bretonstone lines to existing natural-stone sawmills, enabling material portfolio cross-selling via the same dealer networks. Artificial-intelligence-powered online visualizers now appear on nearly every major brand’s website, letting consumers drag and drop high-resolution slab textures into a kitchen photograph, thereby shortening the sales funnel. Sustainability certifications—including Environmental Product Declarations and Declare labels—act as tie-breakers in commercial tenders, giving early adopters pricing leverage. Private-equity firms are actively roll-up targeting family-owned fabricator clusters in Florida, São Paulo, and Bavaria, banking on procurement scale and centralized back-office systems to unlock EBITDA margin expansion. Meanwhile, regional installers defend local share through five-day turnaround promises and mobile slab galleries, supported by cloud-based quoting software developed in partnership with equipment OEMs.
Countertops Industry Leaders
Cosentino Group (Silestone, Dekton)
Caesarstone Ltd.
DuPont de Nemours (Corian)
LX Hausys (HI-MACS, Viatera)
Mohawk Industries (MSI Surfaces)
- *Disclaimer: Major Players sorted in no particular order

Recent Industry Developments
- May 2025: DuPont has announced the branding for Qnity, the new independent public company from its planned Electronics business spin-off. Qnity will focus on providing advanced solutions for the semiconductor and electronics industries, enabling progress in computing, smart technologies, and connectivity. The name "Qnity" (pronounced cue-ni-tee) reflects 'Q' for electrical charge and 'unity' for collaboration.
- March 2025: CRH plc finalized 40 acquisitions worth USD 5.0 billion during 2024, expanding aggregates, ready-mix, and engineered-stone capacity across 28 countries to address rising demand for integrated building-materials bundles.
- March 2025: Health Canada reaffirmed quartz silica as a Category 1A carcinogen and issued a new technical guidance note outlining mandatory air-monitoring protocols for countertop fabrication shops.
- December 2024: CRH plc reported USD 35.6 billion total revenue for 2024, of which 35% stemmed from residential products that include countertops, signalling the segment’s importance within a diversified portfolio.


Research Methodology Framework and Report Scope
Market Definitions and Key Coverage
Our study defines the global countertops market as the value generated from factory-made horizontal work surfaces installed in residential and commercial buildings, whether new construction or renovation, and built from materials such as granite, engineered quartz, marble, solid surface, laminate, porcelain slab, wood, concrete, and recycled composites. Installations shipped loose and finished on-site, as well as fully prefabricated vanity or island tops, are included within this value pool.
Scope exclusion: decorative wall panels, cabinet carcasses, and slab sales that are not converted into finished tops remain outside our numbers.
Segmentation Overview
- By Material
- Granite
- Engineered Quartz
- Marble
- Solid Surface / Acrylic
- Ceramic & Porcelain Slab
- Concrete
- Butcher-Block / Wood
- Others (Recycled Glass, Stainless Steel, etc.)
- By End-User
- Residential
- Commercial
- By Application
- Kitchen Countertops
- Bathroom Vanities
- Other Interior Worktops
- By Installation Type
- New Construction
- Renovation / Retrofit
- By Geography
- North America
- Canada
- United States
- Mexico
- South America
- Brazil
- Peru
- Chile
- Argentina
- Rest of South America
- Europe
- United Kingdom
- Germany
- France
- Spain
- Italy
- BENELUX (Belgium, Netherlands, Luxembourg)
- NORDICS (Denmark, Finland, Iceland, Norway, Sweden)
- Rest of Europe
- Asia-Pacific
- India
- China
- Japan
- Australia
- South Korea
- South-East Asia (Singapore, Malaysia, Thailand, Indonesia, Vietnam, Philippines)
- Rest of Asia-Pacific
- Middle East and Africa
- United Arab Emirates
- Saudi Arabia
- South Africa
- Nigeria
- Rest of Middle East and Africa
- North America
Detailed Research Methodology and Data Validation
Primary Research
We reinforced desk findings through interviews and structured calls with fabricators, slab distributors, home-center buyers, remodeling contractors, and code inspectors across North America, Europe, and Asia-Pacific. These discussions clarified realistic waste factors, fabrication yield, price pass-through lags, and forthcoming silica-dust regulations, allowing us to recalibrate assumptions before final modeling.
Desk Research
Mordor analysts began with publicly available building-activity datasets such as U.S. Census housing starts, Eurostat dwelling completions, and China National Bureau of Statistics floor-space data, which helped size the addressable demand base. Trade association factbooks from the National Kitchen & Bath Association, Marble Institute of America, and World Ceramic Tiles Forum supplied penetration rates by material and region. Company 10-Ks and investor decks yielded average selling prices and channel mix, while customs codes for harmonized commodities 6802 and 6810 indicated cross-border flows. Paid databases, D&B Hoovers for fabricator financials and Volza shipment logs for engineered quartz, rounded out import volumes and verified pricing corridors. This sample list is illustrative; numerous other secondary sources informed data checks and context.
Market-Sizing & Forecasting
A top-down housing and construction-driven demand pool was built from dwelling completions, average countertop square footage per unit, material mix shares, and replacement cycles; selective bottom-up supplier roll-ups and sampled ASP × volume checks validated totals. Key variables like residential remodeling spending, engineered quartz penetration, commercial kitchen capex, average slab price indices, and regional renovation rates feed a multivariate regression that projects value through 2030. Gap areas in bottom-up evidence, for example, smaller emerging markets, were tuned with proxy indicators such as urbanization pace and bank housing credit growth.
Data Validation & Update Cycle
Outputs pass two analyst review rounds, variance flags trigger re-checks against independent indicators (e.g., Freightos stone freight rates, OSHA rule changes), and reconciliations are logged before sign-off. We refresh the model annually and issue interim tweaks when material events, tariff shifts, health regulations, and large capacity additions move underlying drivers.
Why Mordor's Countertops Market Baseline Inspires Decision-Maker Confidence
Published estimates often differ because each firm picks its own mix of materials, end-uses, price points, and update cadence.
Key gap drivers we see are rival studies bundling unfinished slab trade, omitting installation labor, applying uniform price growth across regions, or projecting aggressive post-COVID remodeling spikes without moderating for interest-rate resets. Mordor's scope focuses strictly on finished tops at installed prices, uses region-specific ASP curves, and is refreshed every twelve months, which together temper volatility and enhance comparability.
Benchmark comparison
| Market Size | Anonymized source | Primary gap driver |
|---|---|---|
| USD 155.14 B | Mordor Intelligence | - |
| USD 157.74 B | Global Consultancy A | Includes raw slab exports and excludes on-site fabrication waste adjustment |
| USD 136.19 B | Industry Association B | Applies constant ASP uplift from 2022 without regional differentials |
| USD 99.13 B | Trade Journal C | Limits scope to natural and engineered stone, omitting laminate and solid surface |
Taken together, the comparison shows that once scope, price basis, and refresh rhythm are aligned, Mordor's balanced approach offers a dependable midpoint grounded in transparent variables and steps clients can replicate or stress-test for their own planning.


Key Questions Answered in the Report
What is the current value of the countertops market?
The countertops market stands at USD 161.23 billion in 2026, reflecting robust demand from both new construction and renovation projects.
Which material is growing fastest in the countertops market?
Engineered quartz registers the strongest momentum, with a projected 7.12% CAGR through 2031 supported by durability and design-consistency advantages.
How large is the Asia-Pacific share of the countertops market?
Asia-Pacific contributes 37.05% of global revenue in 2025 and posts the highest regional CAGR at 6.02% thanks to sustained urbanization and middle-class growth.
Why are thin-slab sintered-stone products important?
Thin-slab porcelain and ultra-compact stone slash freight costs, lower embodied carbon, and enable new vertical-cladding and furniture applications that thicker granite cannot match.
How strict are new silica-dust regulations for countertop fabrication?
Agencies such as OSHA and Health Canada mandate airborne silica limits of 25 µg/m³ or lower, compelling workshops to install high-vacuum extraction, wet-cutting systems, and continuous air-monitoring devices.
What is the overall growth outlook for the countertops market?
From 2026 to 2031, the countertops market is projected to expand at a dependable 3.92% CAGR, reaching USD 195.41 billion by the end of the forecast period.
Page last updated on:


