Corporate Employee Transportation Service Market Size and Share
Market Overview
| Study Period | 2019 - 2031 |
|---|---|
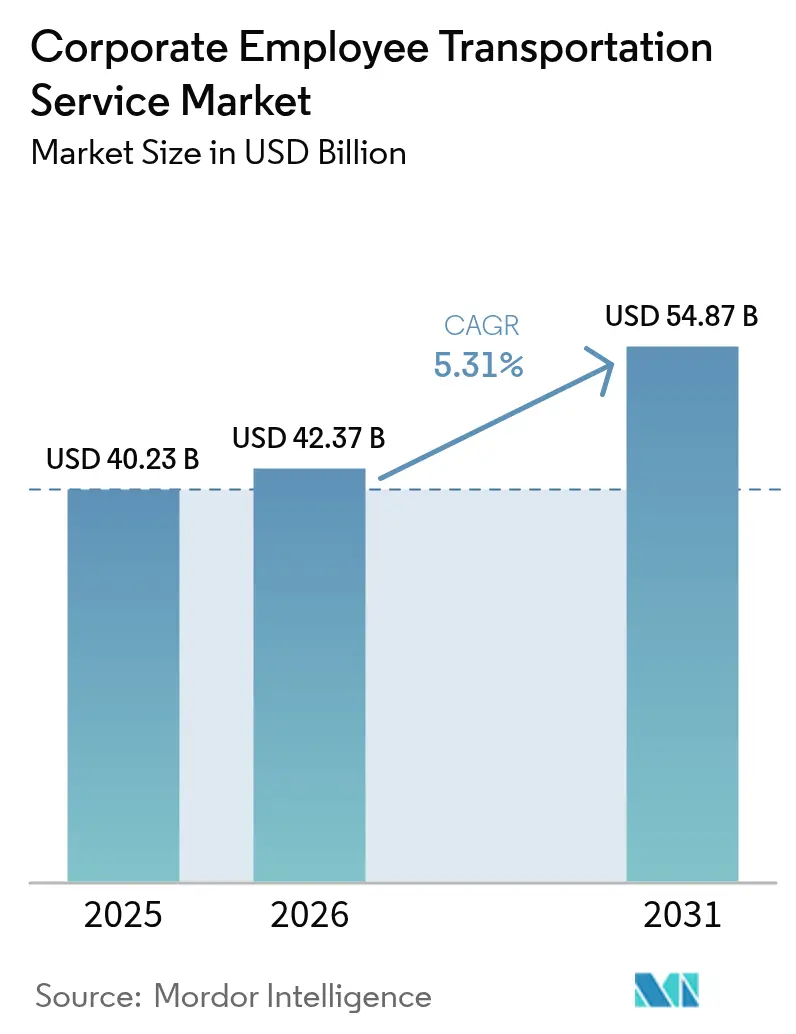
| Market Size (2026) | USD 42.37 Billion |
| Market Size (2031) | USD 54.87 Billion |
| Growth Rate (2026 - 2031) | 5.31% CAGR |
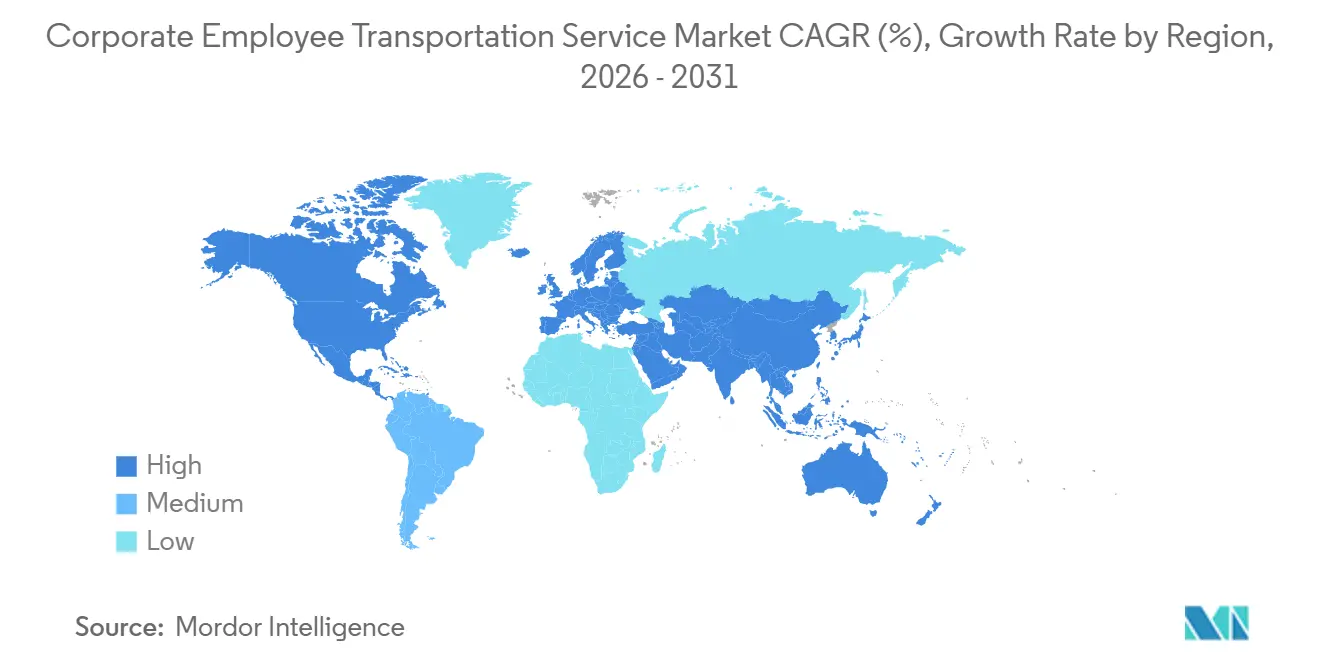
| Fastest Growing Market | Asia Pacific |
| Largest Market | Asia Pacific |
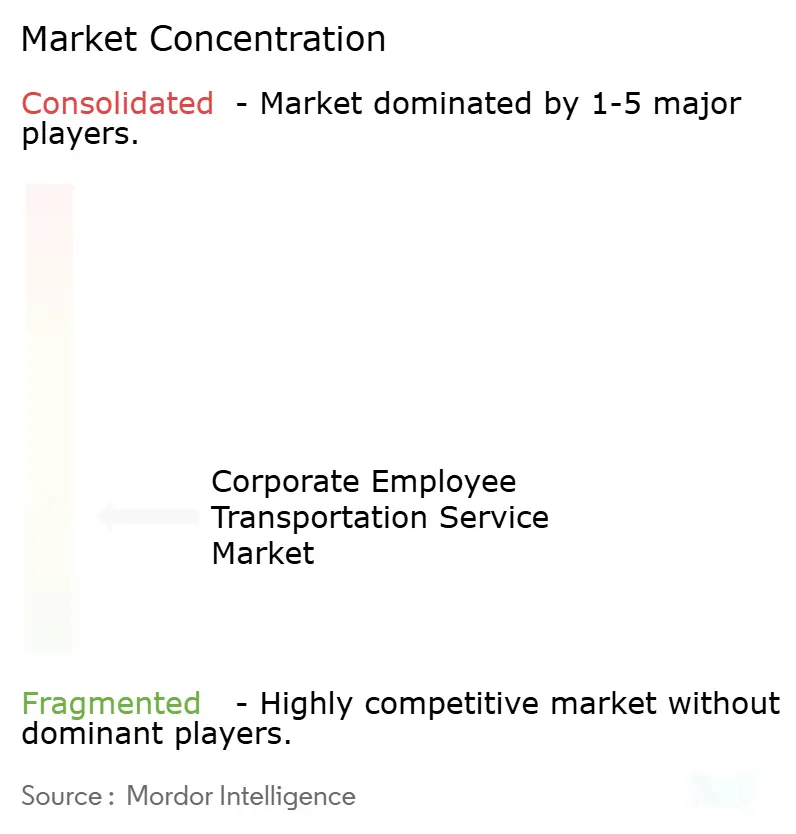
| Market Concentration | Low |
Major Players *Disclaimer: Major Players sorted in no particular order Image © Mordor Intelligence. Reuse requires attribution under CC BY 4.0. | |
Corporate Employee Transportation Service Market Analysis by Mordor Intelligence
The Corporate Employee Transportation Service Market size is projected to expand from USD 40.23 billion in 2025 and USD 42.37 billion in 2026 to USD 54.87 billion by 2031, registering a CAGR of 5.31% between 2026 to 2031. Enterprises are shifting from owning fleets to opting for outsourced or rental services. This transition not only turns a capital expense into a variable cost but is also bolstered by zero-emission fleet mandates. These mandates now include employee shuttles under Scope-3 reporting requirements. Digital platforms, by dynamically pooling riders, have managed to significantly reduce the cost per employee-mile. This has prompted traditional bus contractors to rethink their strategies. In Germany, France, and Belgium, the push towards electrification is gaining momentum. Tax credits are playing a pivotal role, reducing employer payroll expenses while simultaneously ensuring adherence to the European Commission’s proposals. The Asia-Pacific region is set to contribute a substantial share of future revenue and is projected to grow steadily. This growth is largely driven by an expansion in tier-2 cities in India and China, outpacing investments in public transit. The competitive landscape is intensifying. Software-driven aggregators are finding more lucrative avenues in monetizing routing data and ESG dashboards compared to their asset-heavy counterparts.
Key Report Takeaways
- By ownership model, outsourced transportation service held 47.18% of the Corporate employee transportation service market share in 2025, whereas rentals and leasing are advancing at a 5.33% CAGR through 2031.
- By vehicle type, buses and coaches contributed 42.37% of 2025 revenue, while vans and MPVs are projected to grow at a 5.37% CAGR to 2031.
- By service model, MaaS platforms captured 37.12% of 2025 revenue and are strengthening at a 5.47% CAGR through 2031.
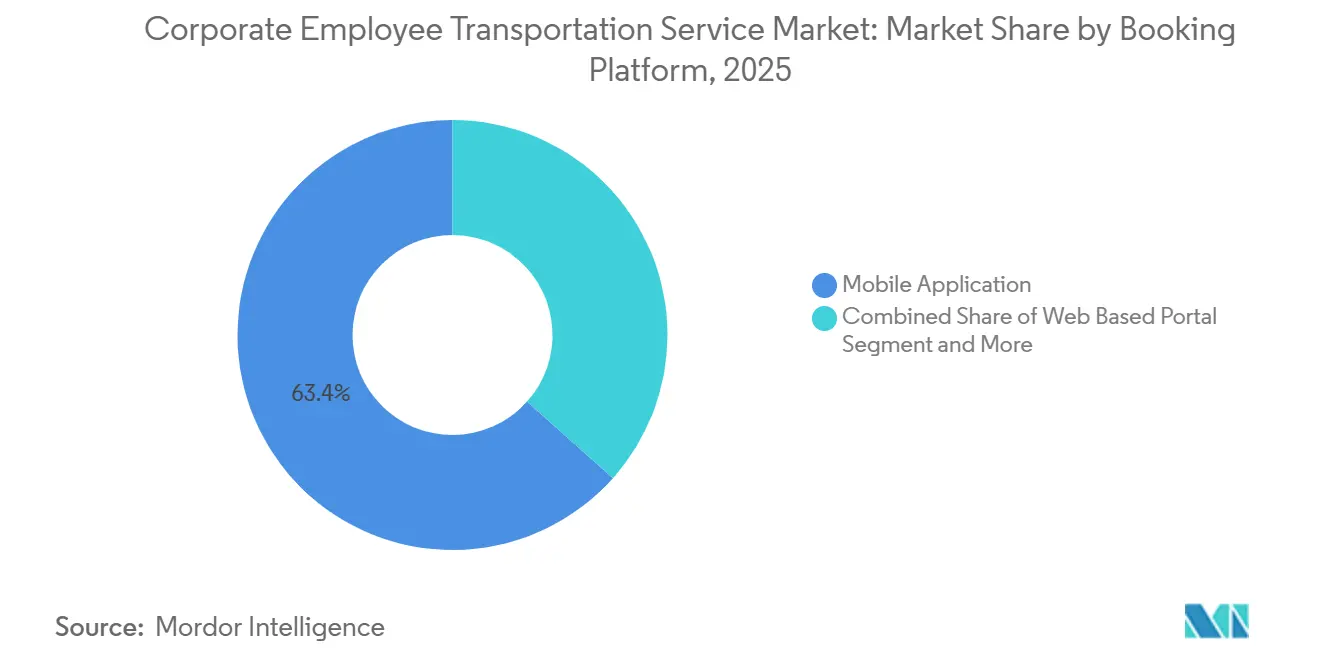
- By booking platform, mobile applications dominated with a 63.37% share in 2025 and will expand at a 5.49% CAGR to 2031.
- By end-user industry, IT and IT-enabled services contributed 31.24% of 2025 revenue, but healthcare and life sciences will post the fastest 5.41% CAGR through 2031.
- By geography, Asia Pacific accounted for the largest 37.73% share of Corporate employee transportation service revenue in 2025 and is projected to record the fastest 5.44% CAGR between 2026 and 2031.
Note: Market size and forecast figures in this report are generated using Mordor Intelligence’s proprietary estimation framework, updated with the latest available data and insights as of 2026.
Global Corporate Employee Transportation Service Market Trends and Insights
Drivers Impact Analysis*
| Driver | (~) % Impact on CAGR Forecast | Geographic Relevance | Impact Timeline |
|---|---|---|---|
| Growing Employers Focus on ESG and Scope-3 Emission Cuts | +1.5% | North America and EU, spillover to Asia Pacific multinationals | Long term (≥ 4 years) |
| Digital On-Demand Shuttle Platforms Scaling Globally | +1.2% | Global, with early traction in India, UAE, Southeast Asia | Medium term (2-4 years) |
| Rapid Urban Sprawl in Tier-2 Cities of Asia and Africa | +1.1% | India (Pune, Hyderabad, Coimbatore), China (Chengdu, Hangzhou), Sub-Saharan Africa | Medium term (2-4 years) |
| Corporate War for Talent, Boosting Commuter Benefits | +0.9% | Asia Pacific core (India, China tier-2 cities), North America tech hubs | Short term (≤ 2 years) |
| Tax Incentives for Shared Mobility in Europe | +0.8% | France, Germany, Belgium, Netherlands | Short term (≤ 2 years) |
| Autonomous Shuttle Pilots Entering Commercial Phase | +0.6% | France, Singapore, United States (Texas, California), Japan | Long term (≥ 4 years) |
| Source: Mordor Intelligence | |||


Growing Employer Focus on ESG and Scope-3 Emission Cuts
Companies subsidizing commutes must now disclose Category 7 emissions. This has led to an uptick in telematics installations on shuttle fleets. Meanwhile, the European Commission's updated regulations mandate a significant share of zero-emission corporate vehicles within a few years, with a complete transition planned over the long term. In recent years, France boosted its Forfait Mobilités Durables tax credit, and Germany raised its employer subsidy cap, all without impacting payroll taxes. Fleet operators, keen on compliance, have begun preordering models such as the Ford E-Transit and the BYD e-Bus. With a majority of younger knowledge workers considering sustainability in their commute when making job choices, and with investors increasingly pricing in climate risks, aligning with ESG principles has become a competitive imperative.
Digital On-Demand Shuttle Platforms Are Scaling Globally
Cloud-native routing engines now update seat allocations every 15 minutes, lowering cost per employee-mile by 20-30% relative to fixed routes. MoveInSync processes more than 1 million rides daily in 50 Indian cities, delivering AI-driven dynamic pooling that cuts idle kilometers by a minimal rate in 2025. Swvl entered the UAE and Spain with a SaaS offering before its 2024 bankruptcy exposed scale-up risks [1]“Annual Report 2025,” MoveInSync Technology Pvt Ltd, moveinsync.com . In China, Carplus serves 30+ cities, while a 2024 GIZ study recorded 6,000 on-demand routes in 36 cities, signaling public-sector support [2]“Transport and Climate Change,” Deutsche Gesellschaft für Internationale Zusammenarbeit, giz.de . Platforms increasingly surface real-time carbon dashboards to satisfy multinational reporting, converting commuting data from cost center to compliance asset.
Rapid Urban Sprawl in Tier-2 Cities of Asia and Africa
Public-transit infrastructure lags population growth by 5-7 years in many smart-city projects, according to an IIT Bhilai study. Telangana’s state bus utility added 275 electric buses in 2025, yet last-mile gaps persist around Hyderabad’s fintech corridor. Chinese tier-2 hubs such as Chengdu and Hangzhou absorb tech talent fleeing high-cost megacities, but suburban industrial parks remain underserved. In Sub-Saharan Africa, multinational back offices in Nairobi and Lagos lease dedicated vans because informal matatu networks lack reliability. Employers are evolving into anchor customers for public-private transit partnerships that could later extend service to broader communities.
Corporate War for Talent Boosts Commuter Benefits
Employers in Tier-2 Indian cities like Pune and Coimbatore, where attrition rates are relatively lower, are faring better than their counterparts in Bengaluru, where rates are significantly higher. Employers in these Tier-2 cities are sweetening relocation packages with subsidized shuttles. In the near future, Hical Technologies aims to reduce single-occupancy drives by integrating Tummoc’s multimodal booking tool on Bengaluru’s Outer Ring Road. In the U.S., employers situated in suburban office parks are turning to Zum, a company that recently secured substantial funding, to provide shift-aligned transport solutions, effectively addressing transit deserts. Hospitals, in their quest to uphold Joint Commission accreditation, are increasingly leaning on dependable round-the-clock shuttle loops, underscoring the importance of commuter benefits as a pivotal retention strategy.
Restraints Impact Analysis*
| Restraint | (~) % Impact on CAGR Forecast | Geographic Relevance | Impact Timeline |
|---|---|---|---|
| Labor Shortages in Licensed Commercial Drivers | -0.8% | Global, acute in North America, Europe, India | Short term (≤ 2 years) |
| Rising Insurance Premiums for Corporate Fleets | -0.6% | North America, Europe, spillover to Asia Pacific | Medium term (2-4 years) |
| Legacy Union Opposition to Ride-Sharing Models | -0.4% | Europe, North America (California, New York), Latin America | Medium term (2-4 years) |
| Data-Privacy Backlash Against Employee Tracking Apps | -0.3% | EU (GDPR jurisdictions), California (CCPA), emerging in Asia Pacific | Short term (≤ 2 years) |
| Source: Mordor Intelligence | |||
Labor Shortages in Licensed Commercial Drivers
FMCSA projects the U.S. will face a significant driver shortfall by 2025, driven by an aging workforce and competitive wages in warehousing. Meanwhile, Europe’s International Road Transport Union highlights a notable deficit across the continent, with Germany experiencing even steeper shortages as drivers return home for better pay. In India, the All India Motor Transport Congress estimates a substantial shortfall, leading to consistent annual wage increases, which in turn, tighten operator margins. This scarcity is pushing investments into driver-assist and autonomous technologies, though lagging approval timelines continue to pose challenges.
Rising Insurance Premiums for Corporate Fleets
In recent years, AM Best has noted a significant annual premium hike, linking the surge to medical inflation and the intricacies of autonomous repairs. Meanwhile, Verisk Analytics highlighted a notable uptick in claim severity over the past few years, heightening the risk associated with nuclear verdicts. With employers imposing limits on shuttle budgets, operators face a dilemma: self-insure—feasible only for large fleets—or forsake low-margin routes, leading to diminished service in secondary markets.
*Our forecasts treat driver/restraint impacts as directional, not additive. The impact forecasts reflect baseline growth, mix effects, and variable interactions.
Segment Analysis
By Ownership: Outsourcing Dominates, Rentals Surge
Outsourced providers captured 47.18% of 2025 revenue, underscoring corporate appetite for asset-light models that convert fleet depreciation into service expense and transfer regulatory exposure. The Corporate employee transportation service market size for rentals and leasing is forecast to climb at 5.33% CAGR through 2031 as 3- to 12-month contracts hedge hybrid-work volatility. Enterprises retaining proprietary fleets typically exceed 500 daily riders on predictable shifts, but even they now layer SaaS routing on top of outsourced maintenance arrangements.
Rentals offer the advantage of flexible capacity with short notice. However, due to vehicle-supply constraints, lease rates have significantly increased. This rise has narrowed the cost difference between leasing and ownership, especially in high-utilization corridors. Full-service leases, which include maintenance and insurance, shift the residual-value risk from lessees to lessors. Additionally, platform aggregators, like Enterprise Holdings’ corporate mobility division, are enhancing rental vans with telematics and carbon reporting. This innovation enables employers to fulfill their Scope-3 disclosure requirements without being tied down by capital commitments.


By Vehicle Type: Buses Anchor, Vans Gain Agility
Buses and coaches generated 42.37% of segment revenue in 2025, favored for 50-plus-seat density on trunk routes. Vans and MPVs, however, are growing at a 5.37% CAGR as employers prioritize last-mile agility. The Corporate employee transportation service market share commanded by vans will expand because electric models like Ford’s E-Transit offer sub-USD 0.25 per mile energy cost, outperforming diesel minibuses on routes under 130 miles.
Fleet managers increasingly deploy multimodal hierarchies: 50-seat coaches during morning peaks, 20-seat minibuses for midday shuttles, and 15-seat electric vans on low-density evenings. Regulatory pressure accelerates downsizing; COM(2025)96 applies stringent zero-emission quotas earlier for heavy vehicles, nudging operators toward right-sized electric vans that hit compliance targets sooner. Chinese OEMs such as BYD undercut European incumbents on price in the electric-minibus niche, catalyzing competitive churn.
By Service Model: MaaS Platforms Lead and Accelerate
MaaS platforms already secure 37.12% of revenue and will grow at a 5.47% CAGR to 2031, pivoting the Corporate employee transportation service market toward software-centric economics. Uber for Business and Lyft Business now embed shared-commute modules inside familiar ride-hailing apps, using calendar data to trigger automatic pool creation.
Hybrid operators combine ownership of vehicles with proprietary algorithms, earning margin on both asset utilization and platform subscription. Ridecell’s middleware enables predictive maintenance that significantly reduces downtime, illustrating how data loops defend the share. Pure-play MaaS disruptors struggle with driver-acquisition costs; incumbents cross-sell to existing consumer bases at marginal marketing spend, intensifying consolidation pressure.
By Booking Platform: Mobile Apps Dominate Digital Shift
Mobile applications commanded 63.37% of 2025 transactions and will advance at 5.49% CAGR, cementing app-first convenience as default. Web portals persist for administrative tasks but cede rider engagement to smartphones. The Corporate employee transportation service market size attached to SMS and USSD bookings is shrinking as low-cost Android adoption spreads in Sub-Saharan Africa.
Apps are now integrating features like cafeteria orders, desk reservations, and safety check-ins alongside commute bookings. MoveInSync's app has introduced a gamified approach to CO₂ savings, utilizing leaderboards, which has significantly improved user retention. Operators that fail to achieve fast load times or native push notifications experience a notable decline in monthly active users. This shortfall has driven some to seek white-label solutions from Fleet Complete. With employees hesitant to download multiple workplace mobility apps, there's a push towards integrating these services into platforms like Slack or Microsoft Teams, signaling a growing trend toward consolidation in the market.
By End-user Industry: IT Anchors, Healthcare Surges
IT and IT-enabled services contributed 31.24% of 2025 spend, anchored in Bengaluru, Hyderabad, and Manila where public transit underserves vast tech campuses. Yet healthcare and life sciences will post a 5.41% CAGR, the highest among verticals, enlarging their Corporate employee transportation service market share as 24/7 shift rosters require precise shuttle scheduling.
Hospitals are deemed mission-critical; Joint Commission compliance and Medicare funding hinge on workforce availability, enabling premium pricing. Life-sciences campuses such as Genentech’s South San Francisco hub stretch across hundreds of acres, necessitating high-frequency internal loops synced with biosafety protocols. In contrast, hybrid work erodes IT ridership 30-40%, prompting route consolidation and per-ride cost inflation that commoditizes operator margins.
Geography Analysis
Asia-Pacific leads with 37.73% of 2025 revenue and a projected 5.44% CAGR, driven by India's tier-2 GCC expansion and China's tech migration to cities like Chengdu and Hangzhou. Bengaluru's Outer Ring Road cluster, with a large workforce, integrates Tummoc to reduce solo driving. Telangana's electric bus initiative addresses the rising demand from the fintech corridor but only partially meets the needs. A recent audit highlighted state facilitation, showcasing a substantial number of on-demand routes and vehicles in China. Southeast Asian capitals, struggling with low peak-hour speeds, are increasingly adopting dynamic-pool platforms over traditional fixed-route buses.
North America and Europe, together accounting for a major share of revenue, are driven by ESG mandates and fiscal incentives. France's Forfait Mobilités Durables and Germany's subsidy programs encourage employers to adopt shared zero-emission fleets by offering payroll tax benefits. In the United States, suburban office parks face challenges due to the lack of fixed transit options, and Zum's recent funding aims to address this gap. However, hybrid work has significantly reduced ridership in cities like San Francisco and Seattle. Employers are now prioritizing shuttles as tools for talent retention, shifting the focus from cost efficiency to employee attrition management.
The Middle East, Africa, and South America contribute the remaining share. In Saudi Arabia's NEOM, autonomous shuttles are positioned as a key mobility solution, though recent job cuts have delayed progress. Dubai's free zones operate electric shuttle loops, while in Argentina, tax benefits for employer transport, such as VAT credits and fuel-tax relief, make shuttles a more cost-effective option than salary increases. Despite challenges like fragmented regulations and currency fluctuations in Sub-Saharan Africa deterring multinationals from cross-border fleet operations, cities like Nairobi and Lagos are leasing vans to address the unreliability of informal transit systems.

Competitive Landscape
The corporate employee transportation service market is moderately fragmented, with a significant portion of global revenue concentrated among the top operators. Tech-enabled challengers like MoveInSync in India, Zum in the U.S., and BusUp in Spain are bundling route optimization, compliance, and ESG dashboards into SaaS layers. This strategy has enabled them to achieve considerably higher gross margins compared to their asset-heavy counterparts. In the U.S., Transdev has been actively acquiring regional shuttle operators. Meanwhile, FirstGroup has shifted its focus, divesting Greyhound to concentrate on contract transit. Swvl's Chapter 11 filing in 2024 serves as a cautionary tale, highlighting the pitfalls of venture-subsidized blitzscaling in the absence of sustainable unit economics.
Technology plays a pivotal role in this landscape. Operators leveraging AI-driven dynamic routing experience significantly improved vehicle utilization. Ridecell's fleet-automation middleware, now in use by Transdev, seamlessly integrates HR badges with parking systems, creating a data-driven customer lock-in.
Global roll-ups face challenges due to regulatory disparities. Standards like ISO 39001, varying driver-licensing regimes, and unique labor codes across countries make winner-take-all scenarios unlikely. Companies like Navya and EasyMile, once focused on campus pilots, are now securing fee-bearing contracts for their autonomous shuttles. This shift indicates a broader industry trend: moving from labor arbitrage to prioritizing software IP as the primary profit driver.
Corporate Employee Transportation Service Industry Leaders
Transdev Group
MoveInSync Technology Solutions Private Limited
Busbank (Global Charter Services, Inc. )
Swvl Holdings Corp
FirstGroup plc
- *Disclaimer: Major Players sorted in no particular order

Recent Industry Developments
- June 2025: Swvl, a leading name in the mobility sector, has expanded into Europe, debuting its Software-as-a-Service (SaaS) platform in the UK. With the signing of its first enterprise contract, the company highlights the platform's promise as a coveted global solution for digitizing mobility and boosting workforce mobility.
- November 2024: Detroit expanded its Accessibil-D autonomous shuttle service, building on the success of a pilot program that boasted impressive 10-minute wait times. With a substantial USD 7.5 million grant from the U.S. Department of Transportation, this initiative seeks to transform local transit by providing a cutting-edge, efficient solution for residents and visitors alike.
- August 2024: The Michigan Department of Transportation has invested a substantial USD 1.67 million to bring to life the innovative Connect AV shuttle, which will traverse a vibrant 10.8-mile urban route. This ambitious project is designed to achieve full autonomy, showcasing the future of transportation in the cities.


Global Corporate Employee Transportation Service Market Report Scope
The scope of the report includes Ownership (Company-Owned, Outsourced, and More), Vehicle Type (Passenger Cars and More), Service Model (MaaS and More), Booking Platform (Mobile, Web, and Call-Center), End-User Industry (IT/ITES, BFSI, and More), and Geography.
| Company-owned Transportation Service |
| Outsourced Transportation Service |
| Rentals / Leasing |
| Pick & Drop (Scheduled Shuttle) |
| Passenger Cars |
| Vans and MPVs |
| Minibuses |
| Buses & Coaches |
| Mobility-as-a-Service (MaaS) |
| Software-as-a-Service (SaaS) / Trip-Planning |
| Managed Transportation Services |
| Hybrid (MaaS + Managed Fleet) |
| Mobile Application |
| Web-based Portal |
| Call-center / Offline |
| IT and IT-enabled Services (ITES) |
| Banking, Financial Services and Insurance (BFSI) |
| Manufacturing and Industrial |
| Healthcare and Life Sciences |
| Energy and Utilities |
| Others (Education, Government, etc.) |
| North America | United States |
| Canada | |
| Rest of North America | |
| South America | Brazil |
| Argentina | |
| Rest of South America | |
| Europe | Germany |
| United Kingdom | |
| France | |
| Italy | |
| Rest of Europe | |
| Asia-Pacific | China |
| Japan | |
| India | |
| South Korea | |
| Rest of Asia-Pacific | |
| Middle-East and Africa | United Arab Emirates |
| Saudi Arabia | |
| Egypt | |
| South Africa | |
| Rest of Middle-East and Africa |
| By Ownership | Company-owned Transportation Service | |
| Outsourced Transportation Service | ||
| Rentals / Leasing | ||
| Pick & Drop (Scheduled Shuttle) | ||
| By Vehicle Type | Passenger Cars | |
| Vans and MPVs | ||
| Minibuses | ||
| Buses & Coaches | ||
| By Service Model | Mobility-as-a-Service (MaaS) | |
| Software-as-a-Service (SaaS) / Trip-Planning | ||
| Managed Transportation Services | ||
| Hybrid (MaaS + Managed Fleet) | ||
| By Booking Platform | Mobile Application | |
| Web-based Portal | ||
| Call-center / Offline | ||
| By End-user Industry | IT and IT-enabled Services (ITES) | |
| Banking, Financial Services and Insurance (BFSI) | ||
| Manufacturing and Industrial | ||
| Healthcare and Life Sciences | ||
| Energy and Utilities | ||
| Others (Education, Government, etc.) | ||
| By Geography | North America | United States |
| Canada | ||
| Rest of North America | ||
| South America | Brazil | |
| Argentina | ||
| Rest of South America | ||
| Europe | Germany | |
| United Kingdom | ||
| France | ||
| Italy | ||
| Rest of Europe | ||
| Asia-Pacific | China | |
| Japan | ||
| India | ||
| South Korea | ||
| Rest of Asia-Pacific | ||
| Middle-East and Africa | United Arab Emirates | |
| Saudi Arabia | ||
| Egypt | ||
| South Africa | ||
| Rest of Middle-East and Africa | ||


Key Questions Answered in the Report
What is the projected global size of corporate employee transportation services by 2031?
Revenue is forecast to reach USD 54.87 billion by 2031, rising from USD 42.37 billion in 2026.
Which region is expected to post the quickest growth through 2031?
Asia-Pacific is set to expand at a 5.44% CAGR, led by rising demand in India and China’s tier-2 cities.
How do zero-emission fleet mandates affect corporate commuting budgets?
European tax credits and payroll exemptions offset 8-12% of employer costs but accelerate vehicle electrification timelines to meet 2035 targets.
Why are Mobility-as-a-Service platforms gaining share among employers?
They bundle real-time routing, carbon dashboards, and flexible pricing, helping organizations cut per-employee shuttle costs by up to 30%.
What is the primary business risk created by commercial-driver shortages?
A global deficit of licensed drivers inflates wages 10-15% annually, squeezing operator margins and prompting investment in automation.
How are hospitals ensuring reliable staff commutes for 24/7 operations?
Health-system contracts now specify dedicated, shift-synchronized shuttles whose reliability supports Joint Commission compliance and patient-care continuity.
Page last updated on:


