
Contract Cleaning Services Market Size and Share
Market Overview
| Study Period | 2020 - 2031 |
|---|---|
| Market Size (2026) | USD 417.71 Billion |
| Market Size (2031) | USD 549.23 Billion |
| Growth Rate (2026 - 2031) | 5.63 % |
| Fastest Growing Market | Asia Pacific |
| Largest Market | North America |
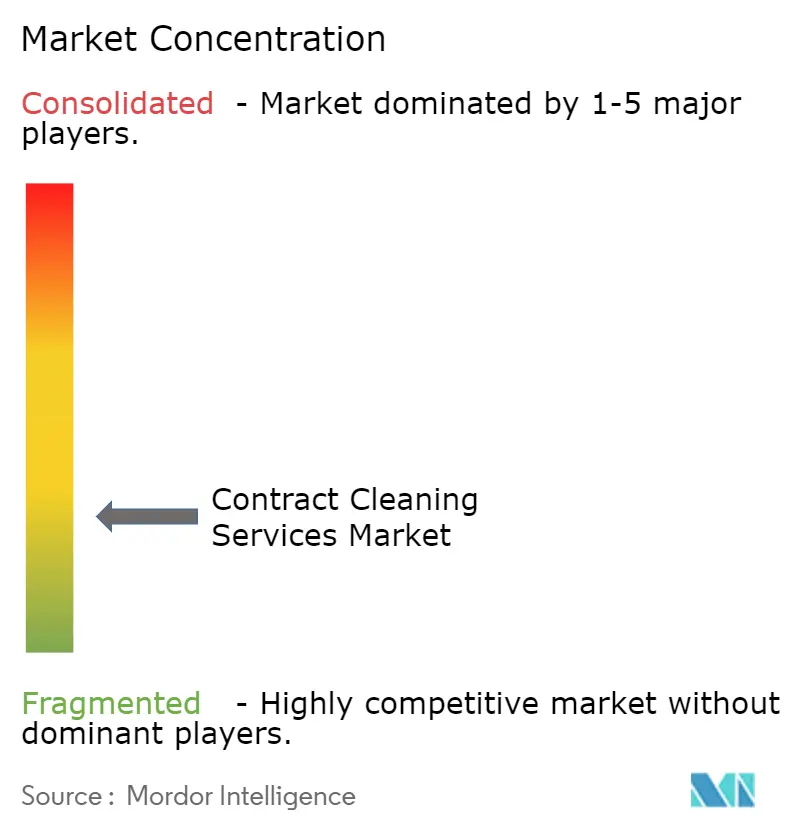
| Market Concentration | Low |
Major Players *Disclaimer: Major Players sorted in no particular order Image © Mordor Intelligence. Reuse requires attribution under CC BY 4.0. | |
Contract Cleaning Services Market Analysis by Mordor Intelligence
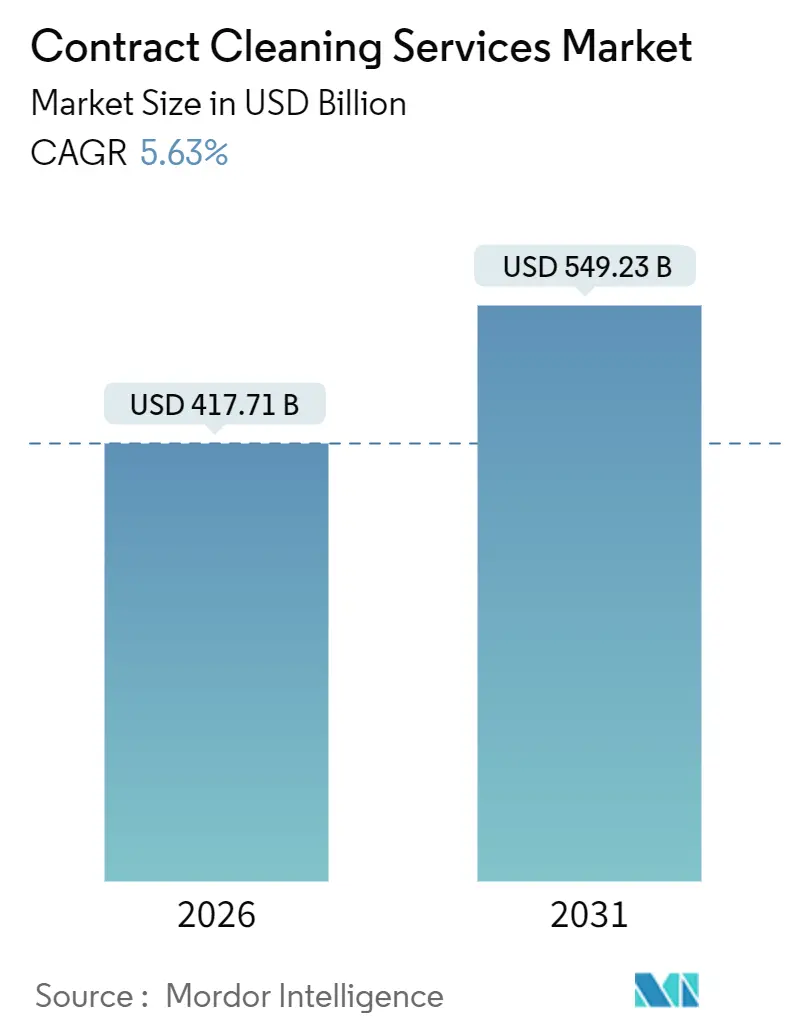
The contract cleaning services market size stood at USD 417.71 billion in 2026 and is projected to reach USD 549.23 billion by 2031, advancing at a 5.63% CAGR during 2026-2031. The expansion reflects a structural shift in hygiene expectations as cleaning moves from discretionary cost to operational safeguard. Heightened infection-control standards, rapid commercial real estate growth in Asia Pacific, and corporate outsourcing of non-core activities are accelerating demand across offices, logistics hubs, and hospitals. Digital technologies such as autonomous scrubbers and IoT sensors are raising service transparency, allowing providers to command value-based pricing. However, wage inflation, fragmented competition, and chemical price volatility are compressing margins, prompting consolidation and automation. Government guidelines on infection prevention, sustainability procurement, and labor safety continue to shape service specifications and vendor accountability.
Key Report Takeaways
- By service type, interior cleaning held 45.83% of contract cleaning services market share in 2025, while specialized cleaning is forecast to expand at a 7.31% CAGR through 2031.
- By contract type, long-term agreements captured 62.76% revenue share in 2025; short-term contracts are advancing at 6.23% CAGR to 2031.
- By end user, commercial facilities led with 48.37% of the contract cleaning services market size in 2025, whereas industrial sites exhibit the fastest 7.02% CAGR through 2031.
- By mode of service, outsourced models controlled 72.21% share in 2025 and are growing at a 5.87% CAGR during the forecast horizon.
- By region, North America accounted for 33.62% of 2025 revenue; Asia Pacific is the fastest-growing region at 7.86% CAGR to 2031.
Note: Market size and forecast figures in this report are generated using Mordor Intelligence’s proprietary estimation framework, updated with the latest available data and insights as of January 2026.
Market Trends and Insights
Drivers Impact Analysis of Contract Cleaning Services Market*
| Driver | (~) % Impact on CAGR Forecast | Geographic Relevance | Impact Timeline |
|---|---|---|---|
| Increasing Hygienic Consciousness | +1.2% | Global, heightened focus in North America and Europe | Medium term (2–4 years) |
| Hospital-Acquired Infection Mitigation in Healthcare | +1.1% | Global, regulation is intense in North America and Europe | Medium term (2–4 years) |
| Commercial Real Estate Expansion Demand | +0.9% | Asia Pacific core, spillover to the Middle East | Long term (≥ 4 years) |
| Outsourcing of Non-Core Activities Growth | +0.8% | Global, particularly North America and Europe | Short term (≤ 2 years) |
| Robotics and IoT Adoption in Cleaning Equipment | +0.7% | North America, Europe, and developed Asia Pacific markets | Long term (≥ 4 years) |
| ESG-Linked Sustainability Cleaning Contracts | +0.6% | North America and Europe, emerging in Asia Pacific | Medium term (2–4 years) |
| Source: Mordor Intelligence | |||
Increasing Hygienic Consciousness
Elevated hygiene standards have turned cleaning into brand protection. Organizations publish disinfection schedules on lobby displays to reassure workers and visitors. The Centers for Disease Control and Prevention’s 2024 revisions require EPA-registered disinfectants for high-touch surfaces, lifting average contract values for healthcare and hospitality clients. Roughly 25% of large U.S. buildings deployed IoT sensors by 2024 to verify task completion in real time, allowing premium pricing for technology-enabled providers.[1]International Facility Management Association, “Benchmarking IoT Adoption in Facility Management,” ifma.org Peer benchmarking now pushes facilities to match the most stringent protocols, driving a race-to-the-top in service intensity.
Hospital-Acquired Infection Mitigation in Healthcare
About 1 in 25 U.S. in-patients acquired an infection on any given day in 2024, making environmental hygiene a clinical imperative. Hospitals are hiring certified infection-prevention technicians trained in dwell-time chemistry and ATP bioluminescence auditing. APIC’s 2024 competency standards mandate coursework in microbiology and PPE donning, reinforcing demand for specialized contracts.[2]Association for Professionals in Infection Control and Epidemiology, “Environmental Services Competency Model,” apic.org Many agreements now tie payment to surface microbial counts and patient-satisfaction scores, directly linking cleaning performance to reimbursement and renewal.
Commercial Real Estate Expansion Demand
Asia Pacific’s urbanization drives massive footprints that require daily maintenance. China’s urbanization rose to 66.2% in 2023, targeting 70% by 2030, adding millions of square meters of cleanable space.[3]National Bureau of Statistics of China, “China Statistical Yearbook 2024,” stats.gov.cn India absorbed 52 million sq ft of offices in 2023, yet local vendors struggle to scale, creating openings for multinational providers. Return-to-office mandates in the United States lifted occupancy back toward 50% by late 2024, restoring pre-2020 cleaning frequencies. New building stock often specifies robotics and green chemicals, increasing contract values.
Outsourcing of Non-Core Activities Growth
Finance leaders prefer turning fixed janitorial labor into variable fees. Outsourced models held 72.21% share in 2025, as firms shifted regulatory, turnover, and benefits liabilities onto vendors. Private-equity roll-ups are knitting regional firms into national platforms, cross-selling landscaping and security to deepen wallet share.[4]GDI Integrated Facility Services, “Investor Presentation 2025,” gdi.com Outsourcing also transfers reputational risk: if an inspection fails, the provider absorbs scrutiny, shielding the client brand.
Restraints Impact Analysis of Contract Cleaning Services Market*
| Restraint | (~) % Impact on CAGR Forecast | Geographic Relevance | Impact Timeline |
|---|---|---|---|
| Rising Labor Costs and High Employee Turnover | -1.1% | Global, acute pressure in North America and Europe | Medium term (2–4 years) |
| Intense Competition among Small and Established Companies | -0.7% | Global, fragmented in North America and Europe | Short term (≤ 2 years) |
| Volatile Chemical Supply Chains Affecting Service Reliability | -0.5% | Global, with regional variations based on import dependence | Short term (≤ 2 years) |
| Regulatory Scrutiny on Water Usage and Wastewater Disposal | -0.4% | North America and Europe, emerging in water-scarce regions | Long term (≥ 4 years) |
| Source: Mordor Intelligence | |||
Rising Labor Costs and High Turnover
Median janitorial wages rose to USD 31,860 in 2023 and climbed another 6.1% in 2024, squeezing providers bound by fixed-price contracts.[5]U.S. Bureau of Labor Statistics, “Occupational Employment and Wages – Janitors and Cleaners, 2024 Edition,” bls.gov Turnover exceeds 200%, forcing firms to replace entire workforces twice a year, inflating recruiting and training expenses. Overnight shifts, physical strain, and limited prestige hamper retention. Immigration curbs further tighten supply, nudging providers toward automation and premium-pay models that promise workforce stability.
Intense Competition among Small and Established Companies
The contract cleaning services market remains fragmented: the top five companies hold only about 30% global revenue, leaving thousands of regional outfits vying on price. Small operators underbid incumbents by 10-15% yet often miss service-level metrics, triggering penalties. Franchise networks such as Jani-King offer procurement scale but still compete internally, diluting brand pricing power. Resulting margin pressure discourages investment in technology and training, perpetuating commoditization.
*Our forecasts treat driver/restraint impacts as directional, not additive. The impact forecasts reflect baseline growth, mix effects, and variable interactions.
Contract Cleaning Services Market Segment Analysis
By Service Type:
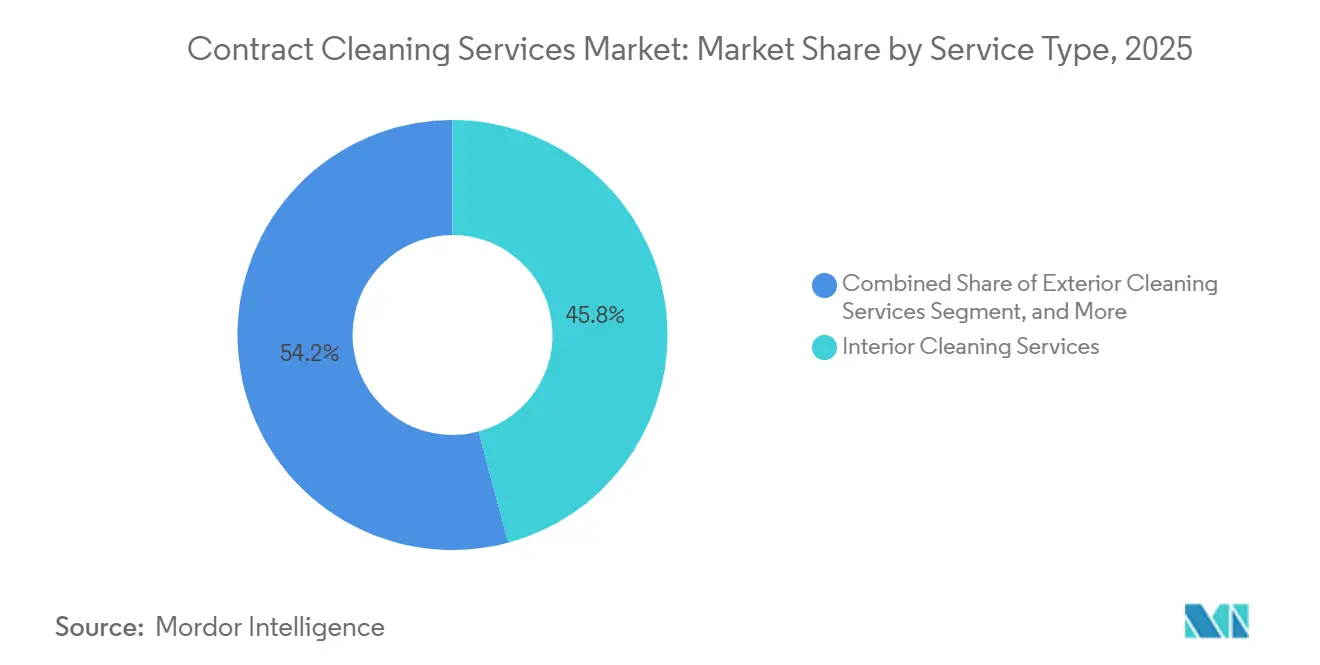
Specialized Cleaning Extends Growth EdgeSpecialized cleaning accounted for 24.17% of revenue in 2025 and is forecast to grow at 7.31% CAGR through 2031, outpacing the broader contract cleaning services market. Demand stems from cleanroom maintenance, infection-control, and food-safety protocols requiring ISO 14644 and FSMA compliance. Interior cleaning remained the workhorse, holding 45.83% of 2025 revenue, but faces price pressure as buyers view vacuuming and restroom sanitation as commoditized tasks, prompting competitive bidding rounds that compress margins.
Providers bundle interior, exterior, and specialty tasks into integrated proposals to defend share. Equipment suppliers now offer HEPA-filtered vacuums and autonomous scrubbers that cut labor hours, freeing staff for value-added specialty roles. The contract cleaning services market size for specialized assignments is projected to widen as hospitals link renewal to ATP scores and manufacturers to particulate counts. Exterior cleaning, while niche, benefits from façade code enforcement in high-rise corridors, sustaining steady demand for rope-access crews.



By Contract Type:
Hybrid Structures EmergeLong-term deals commanded 62.76% share in 2025 as clients sought price predictability and continuity, yet short-term pacts are expanding at 6.23% CAGR. Hybrid work reduces fixed cleaning frequencies, leading corporates to experiment with flexible scopes that ramp with occupancy. Gig platforms offer on-demand tasks but lack reliability for mission-critical spaces. Consequently, master service agreements set baseline pricing while call-off orders adjust activity, giving facility managers agile control without constant rebidding.
The contract cleaning services market share held by long contracts may slip marginally as economic uncertainty favors flexibility. Providers hedge by embedding annual labor-cost escalators and technology-usage clauses. Autonomous equipment leases are often bundled into 3-5-year terms, securing revenue streams even if human labor hours shrink.
By End User:
Industrial Demand Surges with Logistics Build-outCommercial sites delivered 48.37% of 2025 revenue, yet industrial facilities exhibit the fastest 7.02% CAGR through 2031. E-commerce giants added hundreds of warehouses that require daily floor sweeping, racking dust removal, and spill response to safeguard worker safety. Food processors, responding to FSMA, demand documented sanitation standard operating procedures that elevate cleaning to a critical control point. Healthcare, driven by HAI mitigation, sources premium infection-prevention contracts tied to clinical outcomes.
Office tenants push sustainability labeling, requesting ISSA CIMS-GB certified providers. Education facilities pivot to day-time cleaning for visibility, improving worker retention and occupant reassurance. Residential outsourcing grows among dual-income households but remains margin thin due to dispersed geography and shorter visits.

By Mode of Service:
Outsourcing Consolidates DominanceOutsourced operations controlled 72.21% of the contract cleaning services market in 2025 and will compound at 5.87% CAGR. CFOs prefer moving janitorial labor off balance sheets, transferring compliance and injury liabilities to vendors. Technology platforms that timestamp tasks enable granular verification, overcoming historic mistrust around invisible night-shift labor. In-house teams persist in defense sites and unionized public buildings, yet many hybridize by retaining security-sensitive roles and externalizing specialized tasks.
Provider differentiation hinges on proprietary software that feeds dashboards to client facility managers. Larger firms bundle energy management, landscaping, and waste hauling, positioning as one-stop facility partners. Smaller operators respond by affiliating with franchise brands or merging to gain scale.
Geography Analysis
North America Contract Cleaning Services Market
North America generated 33.62% of 2025 global revenue as return-to-office mandates restored daytime occupancy. U.S. companies adopted visible hygiene practices, from lobby disinfectant stations to QR-code cleaning logs. Labor scarcity remains a structural headwind, with 61% of janitorial firms citing staffing as the primary constraint. Wage inflation and benefits costs compress margins, but automation offsets some pressure, particularly in large-box retail and airports.
APAC Contract Cleaning Services Market
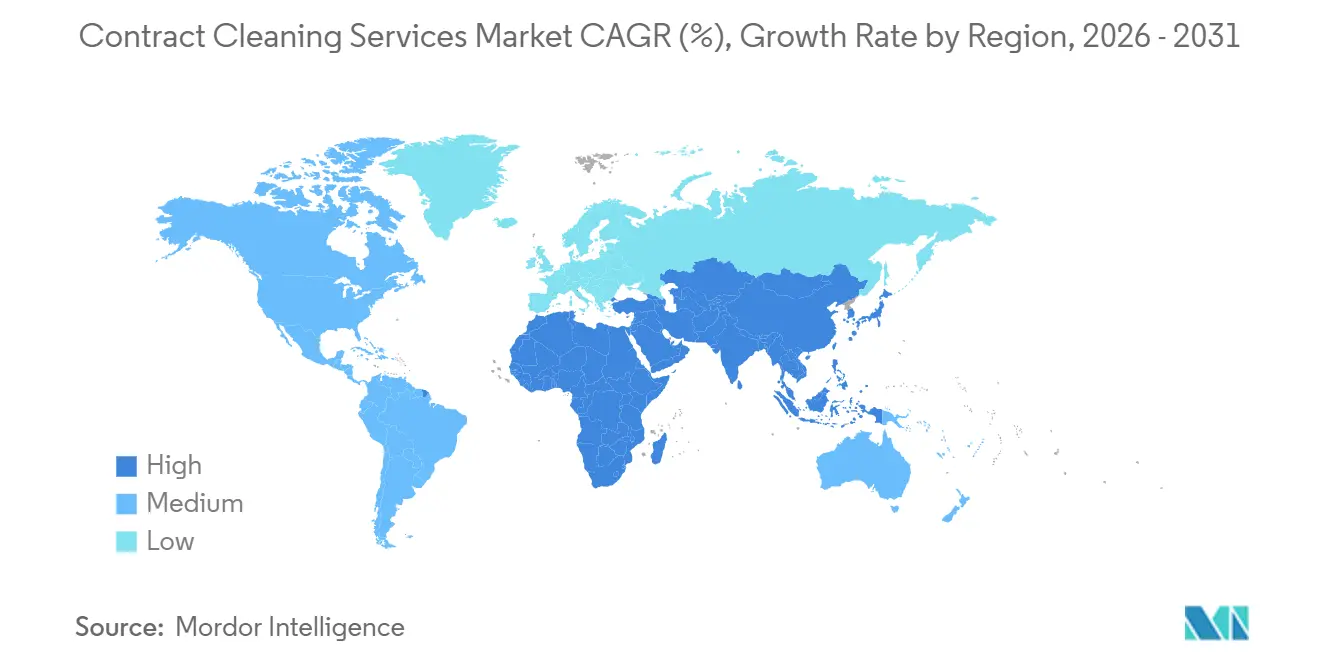
Asia Pacific is the fastest-growing region at 7.86% CAGR, lifted by China’s urbanization toward 70% by 2030 and India’s office build-out. Multinationals pioneer regional training academies to professionalize local labor and secure bilingual supervisors. Fragmented vendor landscapes and uneven regulatory enforcement complicate quality assurance, prompting global firms to invest in proprietary audit apps to track service delivery.
EMEA and South America Contract Cleaning Services Market
Europe emphasizes ESG and circular economy metrics. Public tenders increasingly require LEED or ISO 14001 certification, driving uptake of low-VOC chemicals and microfiber technologies. The Middle East leverages megaprojects under diversification blueprints like Saudi Vision 2030, but contract labor reforms inject cost uncertainty. South America’s growth concentrates in Brazil, where nearshoring and mall refurbishments fuel demand despite currency volatility. Africa remains nascent; however, logistics corridors in Nigeria and Kenya are beginning to specify third-party cleaning in build-operate-transfer agreements.

Regulatory Landscape
Regulation affecting contract cleaning services is shaped by workplace safety, public procurement specifications, and sustainability standards. In the United States, OSHA requirements applicable to places of employment, including 29 CFR 1910.141 on sanitation, influence how contractors design restroom servicing, handwashing access, and related SOPs, especially for large commercial and industrial sites.
Public-sector buying frameworks increasingly hard-code quality assurance and outcomes into tenders. The U.S. General Services Administration issued an updated National Custodial Specification in 2026 that calls for elements such as detailed schedules and formal quality control planning before work starts, which increases documentation requirements for bidders. Sustainability and process standards also function as gatekeepers, including Green Seal GS-42 (2024 revision) for commercial and institutional cleaning services and Singapore NEA guidance (2026, 3rd edition) that emphasizes outcome-based cleaning contracts with measurable performance indicators rather than prescribed headcount.
Value Chain Analysis
The value chain starts with inputs (chemicals, consumables, and equipment) and increasingly includes software, sensors, and autonomous platforms that make cleaning a managed, auditable service. Equipment OEMs and autonomy providers (for example, Tennant and Brain Corp) bundle hardware and navigation software into integrated offerings, while chemical and dispensing suppliers push standardized, lower-touch systems such as aqueous ozone to reduce handling and logistics complexity for multi-site rollouts.
Service delivery is carried out by local and regional operators, franchises, and large integrated facility services platforms that bid for long-term and multi-country SLAs, then manage hiring, training, supervision, and compliance reporting on-site. Downstream, customers span commercial offices and transport hubs, as well as hospitals and logistics facilities, where KPI-driven verification (task time-stamping, audit trails, and outcome metrics) is becoming central to contract governance. Bottlenecks cluster around labor availability and retention, plus the operational readiness needed for autonomy at scale, including maintenance coverage, technician skills, and change management, which favors providers that can standardize processes and support fleets across geographies.
Competitive Landscape
The contract cleaning services market is structurally fragmented. ABM Industries, ISS, Sodexo, Compass Group, and Aramark collectively earned roughly 30% of global revenue in 2025, leaving 70% for regional and niche providers. Low capital barriers invite entrants, but scale advantages in procurement, training, and technology favor large platforms. ABM bought Able Services for USD 830 million in December 2023, adding aviation and healthcare contracts while integrating workforce-management software to cut overtime. GDI acquired Ainsworth for CAD 1.1 billion (USD 810 million) in February 2024, broadening into HVAC and energy services.
White-space segments include data centers, life sciences labs, and cold storage, which demand strict particulate and temperature controls. Providers invest in ISO 14644 training and sensor arrays to monitor humidity and microbial counts. Technology is a competitive wedge: Brain Corp autonomous scrubbers deployed by ABM cut labor hours up to 15%. Franchise systems offer local entrepreneurship, yet enforcing uniform quality across thousands of owners challenges brand equity. Private equity capital flows continue to finance regional roll-ups, betting on exit premiums as integration synergies materialize.
Contract Cleaning Services Industry Leaders
ABM Industries Incorporated
Jani-King International Inc.
ISS A/S
Anago Cleaning Systems Inc.
Sodexo Group
- *Disclaimer: Major Players sorted in no particular order
Contract Cleaning Services Market Companies Covered in this Report
- ABM Industries Incorporated
- ISS A/S
- Sodexo S.A.
- Compass Group PLC
- Aramark Corporation
- Jani-King International Inc.
- Anago Cleaning Systems Inc.
- Duraclean International Inc.
- Pritchard Industries Inc.
- Vanguard Cleaning Systems Inc.
- Stanley Steemer International Inc.
- The ServiceMaster Company LLC
- Mitie Group PLC
- OCS Group Limited
- CleanNet USA Inc.
- Coverall North America Inc.
- Chem-Dry (Harris Research Inc.)
- GDI Integrated Facility Services Inc.
- Atalian Global Services S.A.S.
- C&W Facility Services Inc.

Market Opportunities and Future Outlook
White-space growth is concentrated in premium, specification-heavy environments where buyers pay for measurable outcomes and compliance. Data centers, life sciences labs, and cold storage sites need tighter particulate control, documented sanitation, and auditability, aligning with specialized cleaning capabilities and training tied to standards such as ISO 14644 referenced in existing market positioning. In healthcare, infection prevention competency frameworks and outcome-linked service levels keep pulling demand toward higher-frequency disinfection, ATP-style auditing practices, and certified technician models rather than basic janitorial scopes.
Technology-enabled, outcome-based contracting is opening room for providers to combine labor with robotics, IoT verification, and sustainability reporting. Transport for London awarding Mitie a five-year data-led cleaning contract in January 2026, including a Cleaning Centre of Excellence, shows procurement shifting toward analytics-backed delivery. Platform and automation efforts by suppliers also broaden the contractor toolkit, including Brain Corp releasing BrainOS Clean 2.0 (March 2026) for adaptive autonomy in floor cleaning robots and Tennant unveiling its X16 SWEEP autonomous industrial sweeper (June 2026). These actions support differentiated offerings such as variable-frequency cleaning tied to occupancy, multi-site standardization, and ESG-aligned product choices linked to recognized service standards (for example, Green Seal GS-42) in regulated and institutional bids.
Recent Industry Developments in Contract Cleaning Services Market
- July 2026: ISS A/S expanded its partnership with a public healthcare provider in Southern Europe, adding cleaning scope with an annual value cited around DKK 100 million. The enlarged remit shows how healthcare buyers are bundling hygiene-critical services under broader SLAs, increasing the importance of standardized quality controls and reporting across sites.
- December 2025: Compass Group introduced a carbon-tracking module within its facility-management app to show clients cleaning-related emissions in real time. This supports ESG-linked procurement by turning cleaning activities into measurable sustainability data that can be embedded into contract KPIs and vendor scorecards.
- February 2024: Tennant Company and Brain Corp signed an exclusive technology agreement to accelerate robotic floor-cleaning innovation and adoption by bundling autonomy software with Tennant equipment. The partnership strengthens the upstream-to-service-provider pathway for Robotics as a Service models, enabling contractors to operationalize autonomous fleets with standardized navigation and fleet management.


Contract Cleaning Services Market Report Scope and Research Methodology
Market Definition and Coverage
This market covers paid cleaning work delivered under a contract for homes and for business sites, where the service provider supplies labor and follows agreed schedules and service levels.
Scope exclusions: Excludes informal cash-based cleaning, unpaid in-house housekeeping by residents, and sales of cleaning chemicals, machines, or tools when not bundled as a service.
Segments Covered in This Report
- By Service Type
- Interior Cleaning Services
- Exterior Cleaning Services
- Specialized Cleaning Services
- By Contract Type
- Short-Term Contract
- Long-Term Contract
- By End User
- Residential
- Commercial
- Industrial
- By Mode of Service
- In-house
- Outsourced
- By Geography
- North America
- United States
- Canada
- Mexico
- South America
- Brazil
- Argentina
- Rest of South America
- Europe
- United Kingdom
- Germany
- France
- Italy
- Spain
- Russia
- Rest of Europe
- Asia-Pacific
- China
- Japan
- India
- South Korea
- Australia and New Zealand
- Rest of Asia-Pacific
- Middle East
- Saudi Arabia
- United Arab Emirates
- Turkey
- Rest of Middle East
- Africa
- South Africa
- Nigeria
- Egypt
- Rest of Africa
- North America
Data Sources, Market Sizing, and Validation
Desk Research
Desk research helps set the boundaries, build the starting demand pool, and sanity check the direction of growth before model assumptions are finalized. We rely on public sources such as labor and wage statistics from the US Bureau of Labor Statistics, macro and sector activity indicators from the World Bank and OECD, and inflation and exchange rate series from central banks and the IMF.
To translate demand signals into service consumption patterns, we also review sources such as government procurement portals and tender notices, trade association updates on cleaning and facility services, and peer reviewed journals that discuss hygiene standards and infection prevention practices. In addition, company annual reports, investor presentations, and reputable press coverage are used to understand service mix shifts, pricing behavior, and outsourcing intensity. Where needed, paid subscriptions for company financials and intelligence, patent databases, and contract and tenders tracking are used to cross-check scale, service capability, and contract trends, and then the inputs are adjusted. The sources listed here are illustrative and not exhaustive, and many other references were used for data collection, validation, and clarification.
Primary Interviews and Surveys
Primary work is used to validate what is actually being bought, how contracts are priced, and which services are being bundled across regions. We speak with service providers, facility managers, procurement teams, and channel partners so gaps from desk findings are closed, and assumptions on contract length, frequency, and pass-through of wage costs are aligned to real buying behavior across APAC, EMEA, and the Americas.
Distribution of primary research fieldwork respondents
| Company type | Respondent position | Region |
|---|---|---|
| Top tier: 30% | CXOs: 16% | APAC: 42% |
| Mid tier: 53% | Functional/Unit leaders: 41% | EMEA: 37% |
| Smaller Players: 17% | Managers: 43% | Americas: 21% |
Market-Sizing & Forecasting
Sizing starts from a top-down build where facility stock and activity levels are translated into an addressable cleaning spend pool, and then split using adoption of outsourced contracts across end sites. In practice, indicators such as commercial floor area additions, hospitality occupancy, healthcare and education facility counts, industrial output, and wage inflation for cleaning occupations are used to shape the demand curve and the pricing curve.
The totals are then corroborated through selective bottom-up approximations, such as sampled contract values by service type, a check on reported revenue ranges for listed and large private providers, and channel checks on typical price per visit and frequency by end user. Where service mix data is thin for smaller geographies, we bridge gaps using proxies like urbanization, formal employment density, and local wage bands, and then reconcile back to the demand pool.
For forecasting, scenario analysis is used because pricing and volumes move differently in this market, and experts often describe multiple paths tied to wage pass-through, contract renegotiation cycles, and hygiene policy intensity. The base case is kept consistent year to year by updating the wage and inflation series, revising service mix shares only when supported by interviews, and then applying the revised parameters across regions and end users.
Data Validation & Update Cycle
Results are validated through triangulation across demand signals, pricing checks, and independent indicators like employment levels in cleaning occupations and building activity data. If the model shows a sharp swing, the driver is traced back to either volume assumptions, contract coverage, or price inflation, and then the input is re-checked before sign-off.
A second analyst review is completed for structure, math consistency, and reasonableness by region, and follow-up calls are triggered when interview feedback and desk signals disagree beyond an acceptable range. The report is refreshed annually, and interim updates are made when material events occur such as wage shocks, major regulatory changes, or a shift in outsourcing behavior. Before delivery, a fresh pass is done so clients receive the latest updated view.
Mordor Intelligence's Contract Cleaning Services Market Size Compared With Other Published Estimates
Published market sizes for contract cleaning services often vary, even when the topic label looks the same, because scope boundaries and pricing assumptions are handled differently. Differences also come from how often the core inputs are refreshed and which year and exchange rate timing are used for converting local revenues into USD.
In this market, the biggest gap drivers are usually whether in-house cleaning labor is counted as part of the market, how specialized services (for example, disinfection or post-construction cleaning) are bundled, and how pricing is moved forward when wages rise but contracts reset later. A refresh-led approach also matters because currency swings can change the USD view even if local currency revenue is steady, which is why the currency timing, wage index updates, and a simple ASP-per-site logic are re-checked during each update cycle before the final number is locked in by Mordor Intelligence.
Benchmark comparison
| Source | Market Size | Gaps in Research Methodology |
|---|---|---|
| Mordor Intelligence | USD 417.71 B (2026) | |
| Global Consultancy A | USD 383.99 B (2024) | Uses an earlier base year and a different service taxonomy, and it is not always clear if in-house cleaning labor is excluded consistently across regions, which can pull the total down. |
| Industry Publisher B | USD 376.77 B (2024) | Starts from a 2023 base and applies a broad growth path, but the USD conversion timing and the way wage inflation is passed into service prices by contract cycle are not fully explained, which can shift the 2024 value. |
The spread in the table is mostly explained by timing and boundary choices, rather than one side being right or wrong. When the scope is kept consistent, and when pricing is updated in line with wage and contract reset patterns, the resulting market size stays more traceable to real cleaning activity and repeatable checks.


Key Questions Answered in the Report
What is the projected value of the contract cleaning services market in 2031?
The contract cleaning services market is forecast to reach USD 549.23 billion by 2031.
Which service type is expanding the fastest within contract cleaning?
Specialized cleaning, covering cleanrooms and infection-control tasks, is growing at a 7.31% CAGR through 2031.
Why are companies outsourcing janitorial operations?
Outsourcing converts fixed labor costs into variable fees, transfers compliance and injury risk to vendors, and provides flexibility to align cleaning intensity with occupancy.
Which region shows the strongest growth momentum?
Asia Pacific is advancing at a 7.86% CAGR, driven by rapid urbanization and commercial real estate development in China, India, and Southeast Asia.
How are labor shortages affecting contract cleaning providers?
Wage inflation and turnover above 200% are compressing margins, prompting greater adoption of autonomous equipment and premium-pay retention strategies.
What are emerging niche opportunities for providers?
Data centers, life sciences labs, and cold-storage warehouses require specialized protocols that command premium pricing and create defensible market niches.
Page last updated on:




