Conveyor Belt Market Size and Share
Market Overview
| Study Period | 2020 - 2031 |
|---|---|
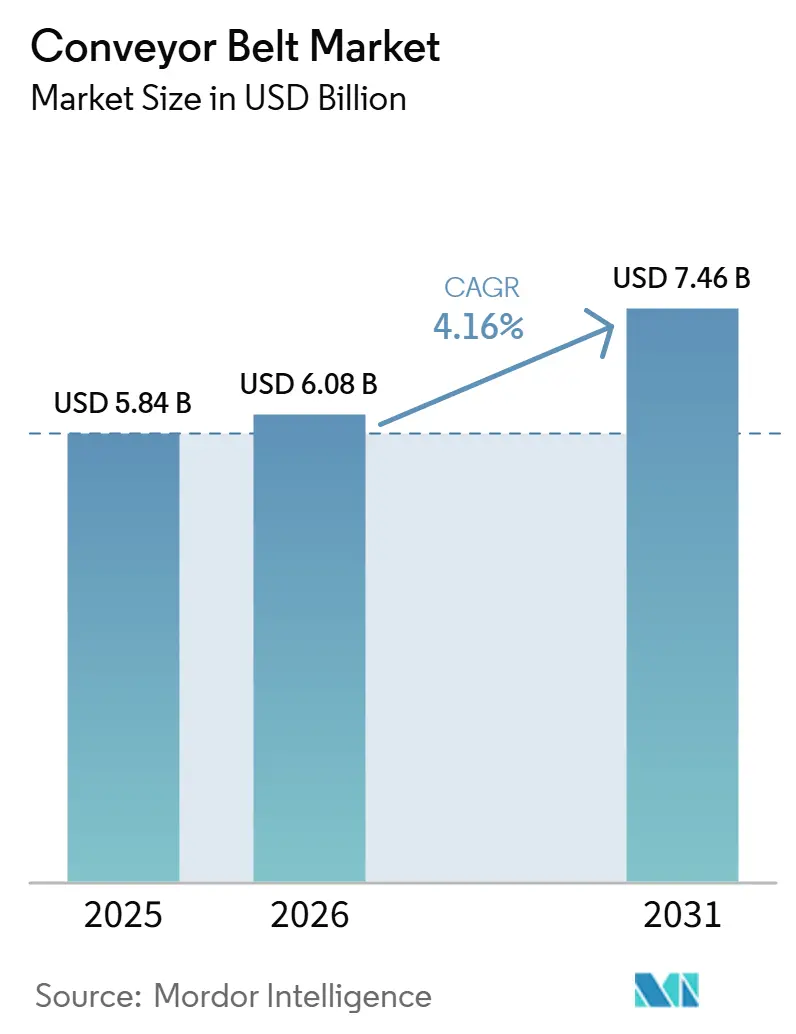
| Market Size (2026) | USD 6.08 Billion |
| Market Size (2031) | USD 7.46 Billion |
| Growth Rate (2026 - 2031) | 4.16% CAGR |
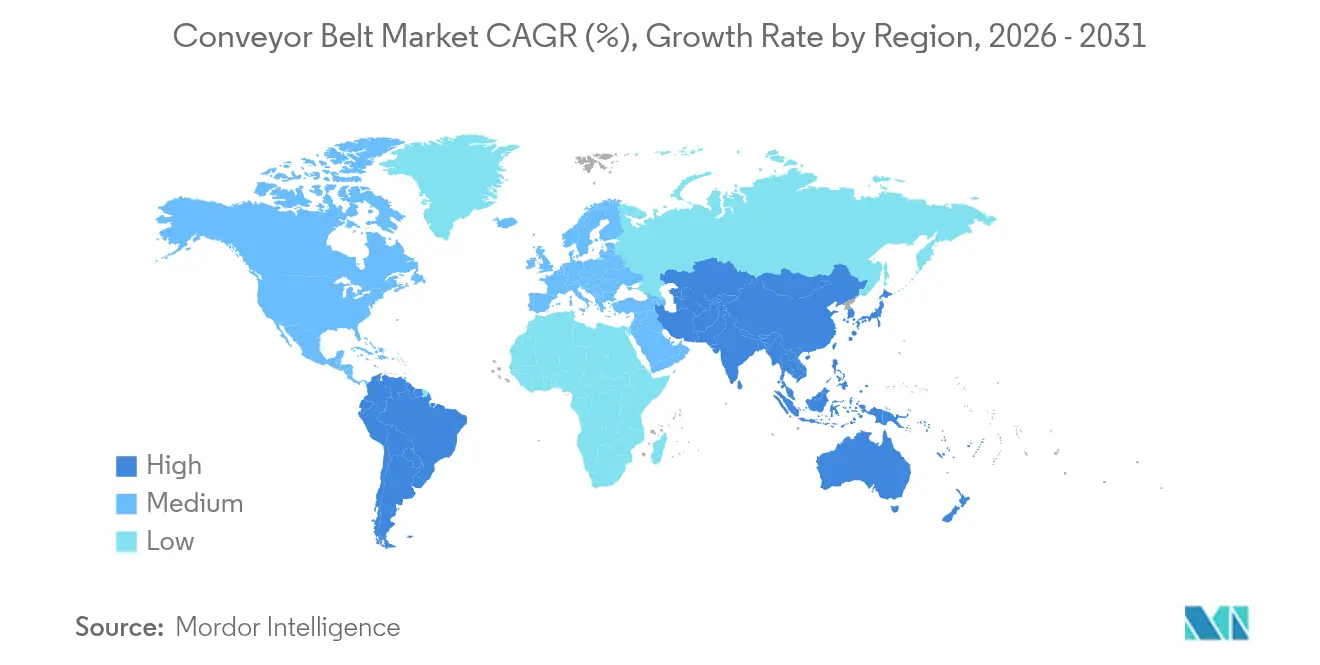
| Fastest Growing Market | South America |
| Largest Market | Asia-Pacific |
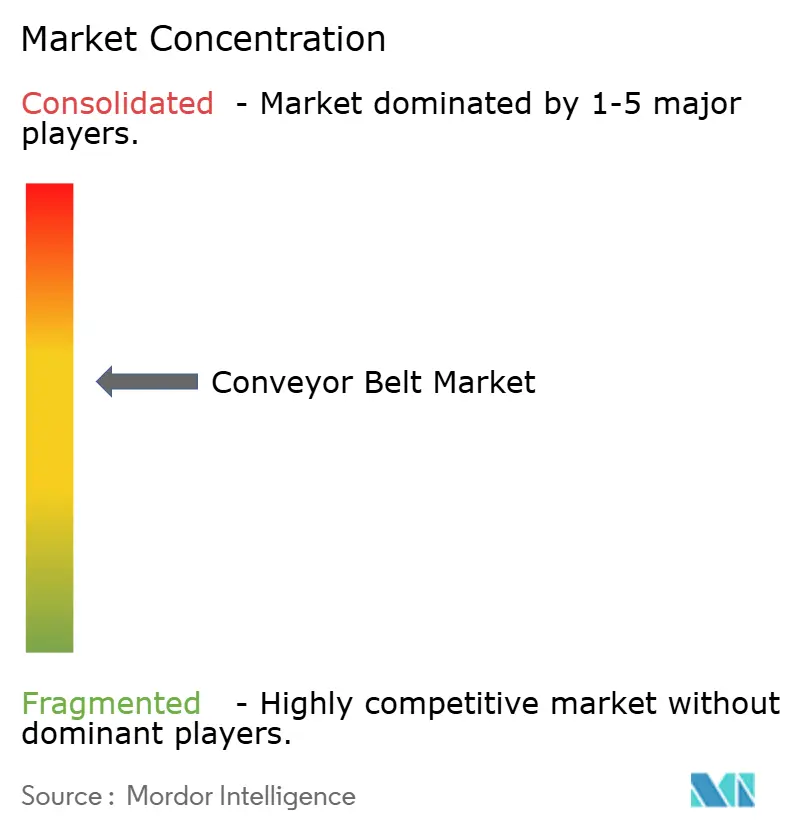
| Market Concentration | Medium |
Major Players *Disclaimer: Major Players sorted in no particular order Image © Mordor Intelligence. Reuse requires attribution under CC BY 4.0. | |
Conveyor Belt Market Analysis by Mordor Intelligence
The conveyor belt market size is expected to grow from USD 5.84 billion in 2025 to USD 6.08 billion in 2026 and is forecast to reach USD 7.46 billion by 2031 at 4.16% CAGR over 2026-2031. Robust demand stems from industrial automation, airport baggage-handling upgrades, and renewed mining capital expenditure, all of which lift replacement cycles and new system installations. Heavy-weight belts continue to anchor revenues, but lightweight, energy-efficient variants are gaining traction as e-commerce operators and food processors modernize facilities. Specialty materials such as aramid and silicone composites see fast adoption because upcoming PFAS curbs compel end users to seek compliant alternatives. Asia-Pacific secures the largest regional share thanks to China’s manufacturing depth and India’s infrastructure pipeline, while South America advances the fastest on the back of large-scale mining projects. Competitive dynamics remain moderate; technology-rich suppliers that bundle IoT monitoring and predictive-maintenance analytics command pricing resilience and build sticky service revenues.
Key Report Takeaways
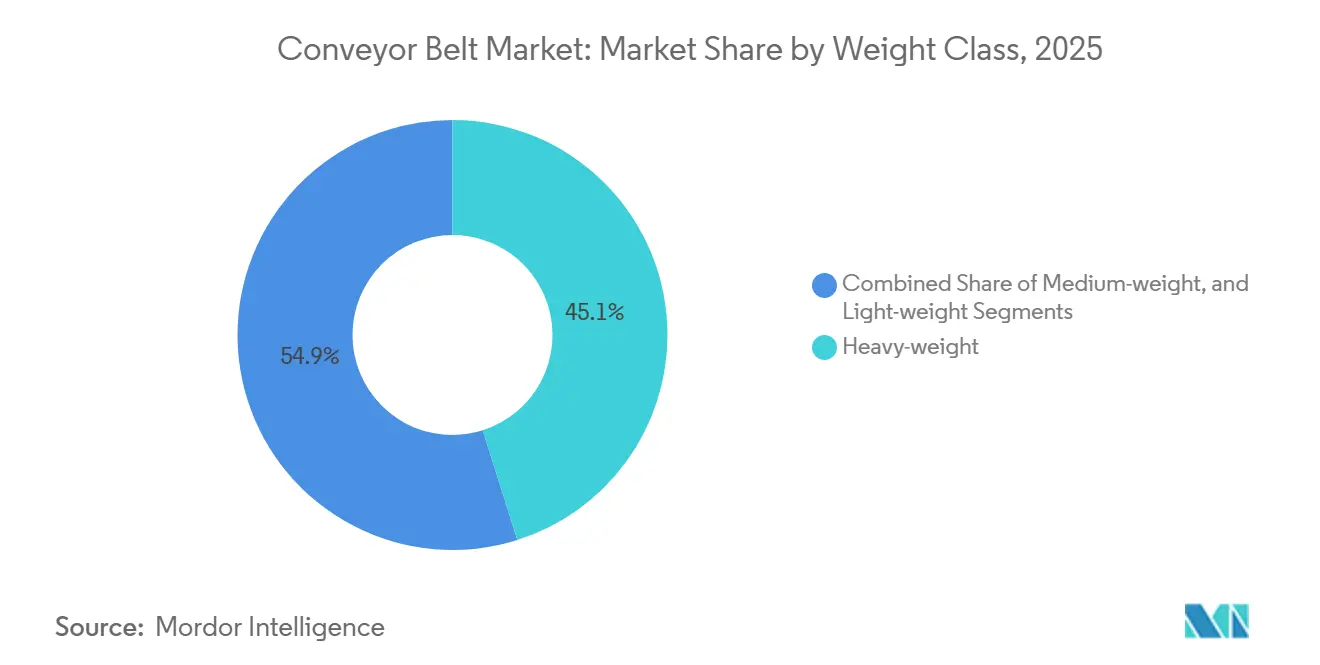
- By weight class, heavy-weight belts led with 45.12% of conveyor belt market share in 2025, while light-weight belts are projected to post a 7.78% CAGR to 2031.
- By belt material, steel-cord reinforced rubber accounted for 35.84% share of the conveyor belt market size in 2025; specialty composites are forecast to expand at an 8.23% CAGR through 2031.
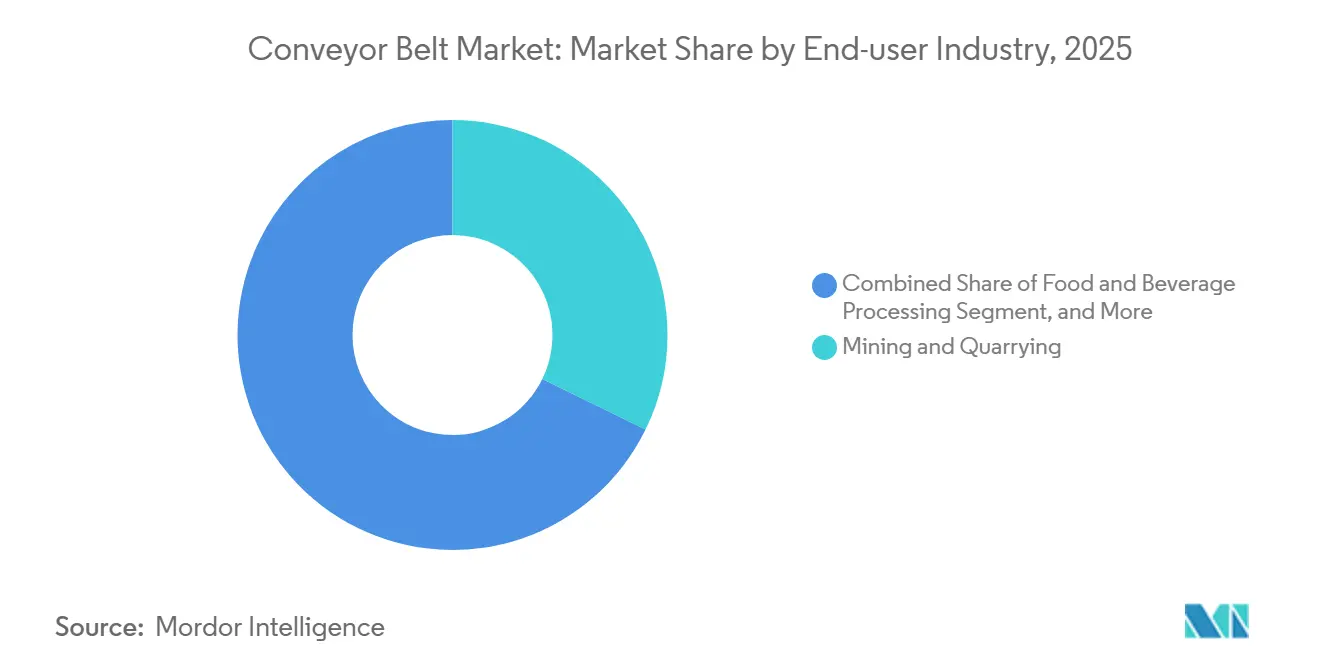
- By end-user industry, mining and quarrying captured 32.25% revenue in 2025; airports and logistics warehousing will grow the fastest at 9.1% CAGR to 2031.
- By installation type, stationary systems held 63.78% of the conveyor belt market size in 2025, whereas portable/mobile systems are rising at an 11.45% CAGR.
- By geography, Asia-Pacific led with 40.58% share in 2025, while South America is projected to register a 6.60% CAGR through 2031.
Note: Market size and forecast figures in this report are generated using Mordor Intelligence’s proprietary estimation framework, updated with the latest available data and insights as of 2026.
Global Conveyor Belt Market Trends and Insights
Drivers Impact Analysis*
| Driver | (~) % Impact on CAGR Forecast | Geographic Relevance | Impact Timeline |
|---|---|---|---|
| Industrial automation wave in e-commerce fulfillment centres | +1.2% | Global, with a concentration in North America and Europe | Medium term (2-4 years) |
| Productivity push in brownfield manufacturing retrofits | +0.8% | APAC core, spill-over to Europe and North America | Long term (≥ 4 years) |
| CAPEX revival in the global mining sector 2025-2028 | +1.5% | Global, with emphasis on South America and APAC | Medium term (2-4 years) |
| Expansion of airports and baggage-handling upgrades | +0.6% | Global, with concentration in North America and Europe | Short term (≤ 2 years) |
| Adoption of antimicrobial food-grade belts post-FSMA amendments | +0.4% | North America and Europe | Short term (≤ 2 years) |
| IoT-enabled predictive-maintenance belts lower unplanned downtime | +0.7% | Global | Medium term (2-4 years) |
| Source: Mordor Intelligence | |||
Industrial automation wave in e-commerce fulfillment centres
Retailers and third-party logistics operators are installing high-throughput sortation conveyors that boost processing capacity to 40,000 parcels per hour while hitting 99.99% accuracy, thereby halving manual handling needs[2]Intralox, “Automation in Motion: Maximizing Throughput in E-commerce Facilities,” intralox.com. Computer-vision modules embedded in these belts catch defects in real time and trim downtime from 3% to 0.1%. Cost pressures from rising labor rates make automation a strategic imperative, locking in multi-year order pipelines for modular, easily re-configurable systems that keep pace with shifting SKU profiles. Because parcel volumes peak seasonally, operators favor light-weight plastic modules that consume less energy and permit rapid belt swaps, reinforcing the structural growth path of the conveyor belt market.
Productivity push in brownfield manufacturing retrofits
Mature factories retrofit conveyor lines with IoT-ready drives and variable-speed controls to stretch asset life and raise overall equipment effectiveness by double-digit percentages. A U.S. flooring producer documented a 40% capacity lift and 25% labor saving after installing ergonomic transfer belts across sanding and packaging stations. Retrofit programs allow gradual Industry 4.0 adoption without disruptive greenfield outlays, which resonates strongly in automotive plants transitioning to electric-vehicle assembly. Energy-efficient motors shrink power draw by up to 30%, a critical benefit as electricity costs escalate, and thus propel further uptake across the conveyor belt market.
CAPEX revival in global mining sector
Copper, lithium, and iron-ore producers have announced multi-billion-dollar expansion programs that rely on long-distance, high-impact belts running at speeds above 8.4 m/s and capacities of 7,000 t/h. Chinese investors committed USD 3.5 billion to Brazilian mineral processing plants, underlining sustained South American momentum. Partnerships such as Roy Hill’s joint project with ContiTech extend belt life sixfold, saving unplanned shutdowns worth millions. Such brown- and greenfield programs elevate the heavy-weight segment and reinforce the long-term expansion trajectory of the conveyor belt market.
IoT-enabled predictive-maintenance belts lower unplanned downtime
Embedded vibration, temperature, and alignment sensors feed algorithms that flag anomalies before catastrophic failure. A metals processor using Flexco’s cloud platform gained a 0.6% throughput uptick worth USD 1.12 million yearly and cut lost production by USD 144,000. Machine-learning models also optimize belt tension and speed, delivering incremental energy savings that offset rising tariffs. As technical staff shortages deepen, remote diagnostics become a core purchasing criterion, increasing switching costs and fortifying supplier–customer ties within the conveyor belt market.
Restraint Impact Analysis*
| Restraint | (~) % Impact on CAGR Forecast | Geographic Relevance | Impact Timeline |
|---|---|---|---|
| Rising electricity tariffs are inflating OPEX for belt drives | -0.9% | Global, with acute impact in Europe | Short term (≤ 2 years) |
| Shortage of skilled belt-maintenance technicians | -0.6% | Global, with a concentration in developed markets | Long term (≥ 4 years) |
| Pending PFAS bans are constraining fluoropolymer belt supply | -0.5% | Europe and North America | Medium term (2-4 years) |
| Volatile synthetic rubber and steel-cord input prices | -0.8% | Global | Short term (≤ 2 years) |
| Source: Mordor Intelligence | |||
Rising electricity tariffs are inflating OPEX for belt drives.
Energy accounts for up to 40% of total conveyor operating cost, and recent tariff hikes in Europe erode margins for mineral processors and food manufacturers. Studies indicate that adaptive speed control can cut consumption by 7.4%, translating to USD 1.08 million in annual savings for a system logging 2,592 hours. Firms therefore fast-track retrofits featuring high-efficiency 24-volt drives and regenerative braking modules, but capital outlays strain small operators and may slow near-term order intake for the conveyor belt market.
Shortage of skilled belt-maintenance technicians
Retirements and limited vocational pipelines leave critical vacancies unfilled, lengthening repair cycles and elevating downtime risk. Providers respond with “train-the-trainer” programs and online certification; Martin Engineering’s FOUNDATIONSTM modules cost USD 299 per course and standardize best practices across dispersed plants. Still, wage inflation and recruitment lead times raise service contracts’ cost, nudging users toward sensor-rich, self-diagnosing solutions that reduce onsite labor dependency, thereby shaping specifications across the conveyor belt market.
*Our forecasts treat driver/restraint impacts as directional, not additive. The impact forecasts reflect baseline growth, mix effects, and variable interactions.
Segment Analysis
By Weight Class: Light-weight Gains Despite Heavy-weight Dominance
The conveyor belt market size for heavy-weight belts captured 45.12% revenue in 2025, anchored by mining and heavy-industry payload demands. Light-weight variants, however, are forecast to expand at 7.78% CAGR because e-commerce fulfillment and food processing plants seek energy efficiency and hygiene compliance. Modular plastic designs shorten sanitation cycles and trim water usage, an environmental benefit that amplifies adoption. Operators also value lower rotational inertia, which pares electricity draw and mitigates tariff shocks. Medium-weight belts serve automotive stamping and component transfer needs, balancing tensile strength with flexibility. Across these tiers, sensor integration and quick-change sprockets support predictive maintenance, underpinning steady revenue streams for service providers within the conveyor belt market.
The competitive intensity varies by weight class. Heavy-weight offerings require proprietary carcass technologies and extensive test facilities, raising barriers to entry. Light-weight belts, although easier to manufacture, depend on application-specific surface chemistries and FDA compliance documentation, which still favors incumbents with broad materials portfolios. Suppliers that bundle monitoring software and rapid-deployment field crews differentiate effectively, reinforcing brand stickiness across the conveyor belt industry.


By Belt Material: Specialty Materials Surge Amid Steel-cord Stability
Steel-cord reinforced rubber retains 35.84% conveyor belt market share given its unmatched tensile capacity for bulk-haul mining. Yet specialty composites such as aramid and silicone are poised for 8.23% CAGR as PFAS-free chemistries win regulatory clearance in food, pharmaceutical, and electronics plants. Aramid’s low weight helps cut drive power, supporting customers’ decarbonization targets. Fabric-reinforced rubber remains a mid-cost workhorse in cement and aggregates, while PVC/PU modules dominate wet-clean environments where bacteria control is paramount.
Research pipelines focus on EPDM and HNBR blends that mimic fluoropolymers’ heat resistance without breaching upcoming EU PFAS rules. Early adopters lock in dual sourcing to hedge supply risk, and contract structures increasingly feature price-adjustment clauses tied to petrochemical feedstocks. As material innovation accelerates, intellectual-property portfolios become central to sustaining margins in the conveyor belt market.
By End-user Industry: Airports Accelerate While Mining Maintains Leadership
Mining and quarrying delivered 32.25% of 2025 revenue, with expansion projects in Chile, Australia, and Indonesia specifying steel-cord belts rated for 10,000 t/h. Airport and logistics facilities, however, are projected to clock 9.1% CAGR, bolstered by U.S. TSA-mandated baggage-handling upgrades and the proliferation of cross-border e-commerce hubs. Food and beverage processors continue to demand antimicrobial, oil-resistant surfaces that withstand aggressive sanitation chemicals.
For example, Seattle-Tacoma International Airport’s USD 540 million system embeds 10 miles of belts and sensors that route 8,200 bags per hour. Automotive plants moving to electric-vehicle battery assemblies specify static-dissipative covers and tight-tolerance tracking to safeguard cell integrity. These heterogeneous requirements expand addressable opportunities and sustain technology differentiation within the conveyor belt market.
By Installation Type: Portable Systems Gain Momentum
Stationary lines dominated with 63.78% of the conveyor belt market size in 2025 because fixed plants enjoy economies of scale and lower maintenance frequency. Yet portable/mobile systems are set to advance at 11.45% CAGR as infrastructure contractors, quarry operators, and seasonal agricultural processors seek rapid deployment and relocation flexibility. Compact fold-up units with integrated telescopic drives now offer ±0.1 mm positioning accuracy, matching many fixed systems while freeing floor space.
Rental models gain popularity, enabling cash-constrained firms to access modern equipment without committing capital. Manufacturers respond by designing plug-and-play electrical architecture and quick-lock frame joints that cut assembly time by 60%. As smart sensors miniaturize, portable belts inherit the same predictive-maintenance functionality found in large complexes, further widening the user base and reinforcing expansion of the conveyor belt market.
Geography Analysis
Asia-Pacific retained 40.58% share of the conveyor belt market in 2025, fueled by continuous Chinese investment in robotics-intensive manufacturing and India’s highway, airport, and mineral-processing build-out. Japan’s plan for a 500-kilometer automated material-handling corridor linking Tokyo and Osaka exemplifies the region’s appetite for advanced conveyor solutions capable of displacing 25,000 daily truck movements. Strong local supply ecosystems allow rapid customization and shorten lead times, giving regional vendors an edge.
South America is projected to lead growth at 6.60% CAGR through 2031 as miners unlock copper and lithium deposits critical to the global energy transition. China’s USD 3.5 billion pledge for Brazilian processing hubs ensures long-term orders for heavy-duty belts, while Argentina’s Bi-Oceanic Railway Corridor will require extensive conveying links to ports once bulk cargo nodes come online. Government infrastructure stimulus further underpins construction material demand, widening the addressable conveyor belt market across the continent.
North America experiences steady replacement demand driven by e-commerce distribution center build-outs and airport baggage upgrades, such as Phoenix Sky Harbor’s USD 310 million project. Energy tariffs rise faster than inflation, accelerating the adoption of variable-frequency drives and regenerative braking modules. Europe faces parallel modernization needs but contends with stringent PFAS legislation that may raise input costs and trigger redesign cycles; nonetheless, the policy also seeds opportunity for local innovators supplying compliant materials. The Middle East and Africa record selective growth linked to phosphate mining in Morocco and logistics free zones in the Gulf, though political risk and water scarcity temper broader deployment.

Competitive Landscape
The conveyor belt market is moderately fragmented. Continental AG’s ContiTech division saw 9.9% year-on-year sales contraction to EUR 1.5 billion (USD 1.63 billion) in Q3 2024, reflecting sluggish European output[1]Continental AG, “Quarterly Statement Q3 2024,” continental.com. In contrast, Yokohama Rubber booked a record 2024 operating profit of USD 853.2 million, buoyed by off-highway tire and heavy conveyor demand. Suppliers that hedge geographical exposure and push high-value niches outperform volume-focused peers.
Motion Industries acquired International Conveyor and Rubber to deepen aftermarket reach, and PPI bought Continental Global Material Handling to assemble a cradle-to-grave offering from rollers to full systems. Technology partnerships proliferate; Flexco links its belts to Software AG’s Cumulocity IoT stack, capturing data that underpins predictive service contracts and drives recurring revenue. Regulatory scrutiny around PFAS incites R&D alliances among chemical firms and belting OEMs pursuing compliant coatings.
New entrants compete on modularity and rapid deployment. Portable-system specialists tout 60% faster setup times, challenging incumbents reliant on large stationary contracts. However, entrenched players wield extensive service networks and proprietary carcass patents that create barriers. Overall, innovation speed, service coverage, and material science leadership define the evolving hierarchy across the conveyor belt market.
Conveyor Belt Industry Leaders
The Yokohama Rubber Co., Ltd.
Bridgestone Corporation
Michelin Group (Fenner Conveyors)
Bando Chemical Industries, Ltd.
Continental Belting Pvt. Ltd.
- *Disclaimer: Major Players sorted in no particular order

Recent Industry Developments
- April 2025: Continental AG confirmed plans to spin off its ContiTech division and reshuffled its executive board.
- March 2025: Pipeotech warned that proposed EU PFAS rules could disrupt fluoropolymer gasket and conveyor materials supply.
- January 2025: TAKRAF won a contract to supply conveyor systems for the Collahuasi expansion project in Chile.
- December 2024: Motion Industries agreed to acquire International Conveyor and Rubber, adding seven U.S. sites.


Global Conveyor Belt Market Report Scope
A conveyor belt, driven by an electric motor, forms a continuous loop wrapped around one or more pulleys. The belt rests on a metal plate bed or rollers for support. The pulley that powers the conveyor belt is termed the drive pulley, whereas the unpowered pulley is referred to as the idler pulley.
The study tracks the revenue accrued through the sale of conveyor belts by various players across the globe. The study also tracks the key market parameters, underlying growth influencers, and major vendors operating in the industry, which supports the market estimations and growth rates over the forecast period. The study further analyses the overall impact of COVID-19 aftereffects and other macroeconomic factors on the market. The report’s scope encompasses market sizing and forecasts for the various market segments.
The conveyor belt market is segmented by type (heavy-weight, medium-weight, lightweight), end-user industry (automotive, retail, food and beverage, industrial, manufacturing, others), and geography (North America, Europe, Asia Pacific, Middle East & Africa, and South America). The market sizes and forecasts regarding value (USD) for all the above segments are provided.
| Heavy-weight |
| Medium-weight |
| Light-weight |
| Steel-cord Reinforced Rubber |
| Fabric Reinforced Rubber |
| PVC / PU Modular Plastic |
| Specialty (Aramid, Silicone, etc.) |
| Mining and Quarrying |
| Food and Beverage Processing |
| Automotive and Tire |
| Airports and Logistics Warehousing |
| General Manufacturing |
| Stationary |
| Portable / Mobile |
| North America | United States | |
| Canada | ||
| Mexico | ||
| South America | Brazil | |
| Argentina | ||
| Rest of South America | ||
| Europe | United Kingdom | |
| Germany | ||
| France | ||
| Italy | ||
| Spain | ||
| Nordics | ||
| Rest of Europe | ||
| Middle East and Africa | Middle East | Saudi Arabia |
| United Arab Emirates | ||
| Turkey | ||
| Rest of Middle East | ||
| Africa | South Africa | |
| Egypt | ||
| Nigeria | ||
| Rest of Africa | ||
| Asia-Pacific | China | |
| India | ||
| Japan | ||
| South Korea | ||
| ASEAN | ||
| Australia | ||
| New Zealand | ||
| Rest of Asia-Pacific | ||
| By Weight Class | Heavy-weight | ||
| Medium-weight | |||
| Light-weight | |||
| By Belt Material | Steel-cord Reinforced Rubber | ||
| Fabric Reinforced Rubber | |||
| PVC / PU Modular Plastic | |||
| Specialty (Aramid, Silicone, etc.) | |||
| By End-user Industry | Mining and Quarrying | ||
| Food and Beverage Processing | |||
| Automotive and Tire | |||
| Airports and Logistics Warehousing | |||
| General Manufacturing | |||
| By Installation Type | Stationary | ||
| Portable / Mobile | |||
| By Geography | North America | United States | |
| Canada | |||
| Mexico | |||
| South America | Brazil | ||
| Argentina | |||
| Rest of South America | |||
| Europe | United Kingdom | ||
| Germany | |||
| France | |||
| Italy | |||
| Spain | |||
| Nordics | |||
| Rest of Europe | |||
| Middle East and Africa | Middle East | Saudi Arabia | |
| United Arab Emirates | |||
| Turkey | |||
| Rest of Middle East | |||
| Africa | South Africa | ||
| Egypt | |||
| Nigeria | |||
| Rest of Africa | |||
| Asia-Pacific | China | ||
| India | |||
| Japan | |||
| South Korea | |||
| ASEAN | |||
| Australia | |||
| New Zealand | |||
| Rest of Asia-Pacific | |||


Key Questions Answered in the Report
What is the current size of the conveyor belt market?
The market is valued at USD 6.08 billion in 2026 and is projected to reach USD 7.46 billion by 2031.
Which weight class leads the conveyor belt market?
Heavy-weight belts lead with 45.12% revenue share, although light-weight belts are the fastest-growing category at 7.78% CAGR.
Why are specialty materials gaining traction in conveyor belts?
Upcoming PFAS restrictions and the need for lighter, energy-efficient designs drive adoption of aramid and silicone composites.
Which region is growing the fastest in the conveyor belt market?
South America is projected to record a 6.60% CAGR through 2031, aided by large mining investments and infrastructure projects.
Page last updated on:


