
United States Material Handling Leasing And Financing Market Size and Share
Market Overview
| Study Period | 2020 - 2031 |
|---|---|
| Forecast Data Period | 2026 - 2031 |
| Base Year Market Size (2025) | USD 1.54 Billion |
| Market Size (2026) | USD 1.78 Billion |
| Market Size (2031) | USD 3.63 Billion |
| Growth Rate (2026 - 2031) | 15.39 % |
| Market Concentration | Medium |
Major Players *Disclaimer: Major Players sorted in no particular order Image © Mordor Intelligence. Reuse requires attribution under CC BY 4.0. | |
United States Material Handling Leasing And Financing Market Analysis by Mordor Intelligence
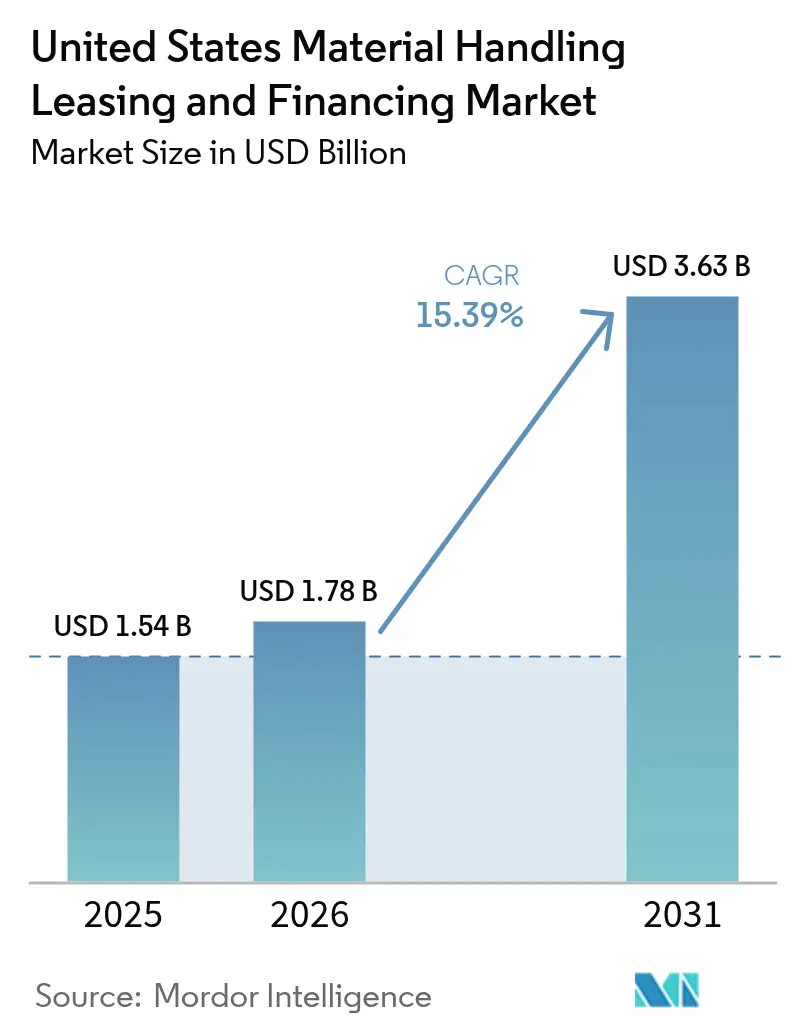
The United States material handling leasing and financing market size is expected to grow from USD 1.54 billion in 2025 to USD 1.78 billion in 2026 and is forecast to reach USD 3.63 billion by 2031 at 15.39% CAGR over 2026-2031. This powerful upswing is propelled by e-commerce warehouse buildouts that demand capital-intensive automated equipment, federal tax optimization under Section 179, and the spread of equipment-as-a-service contracts that lower balance-sheet risk for small and medium enterprises. New business volume for material handling assets advanced 12% during 2024 as large retailers and third-party logistics operators accelerated network expansion.[1]Equipment Leasing and Finance Association, “2024 Annual Survey Results,” elfaonline.org Financiers have responded by developing hybrid lease structures that combine traditional operating leases with embedded technology service clauses, a design that mitigates residual-value uncertainty on automated guided vehicles. In parallel, ESG-linked loan incentives are narrowing the spread between electric and internal-combustion equipment, unlocking new demand in high-regulation states. Competitive intensity is rising because technology-enabled entrants are bundling telemetry, predictive maintenance, and insurance into single monthly invoices, thereby altering fee economics for incumbent lessors.
Key Report Takeaways
- By equipment type, forklifts led with 47.62% revenue share in 2025 while automated guided vehicles are projected to expand at a 16.03% CAGR to 2031.
- By end-user industry, e-commerce and third-party logistics providers accounted for 36.78% of 2025 financing volume, and pharmaceuticals show the fastest 16.49% CAGR through 2031.
- By capacity range, the 5,000-10,000 pound band captured 41.08% of 2025 activity, yet the sub-5,000 pound class is advancing at a 17.62% CAGR on micro-fulfilment demand.
- By financing type, operating leases held 51.73% share in 2025, whereas sale-and-leaseback arrangements exhibit the strongest 16.95% CAGR to 2031.
Note: Market size and forecast figures in this report are generated using Mordor Intelligence’s proprietary estimation framework, updated with the latest available data and insights as of 2026.
United States Material Handling Leasing And Financing Market Trends and Insights
Drivers Impact Analysis*
| Driver | (~) % Impact on CAGR Forecast | Geographic Relevance | Impact Timeline |
|---|---|---|---|
| Rising e-commerce warehouse expansion | +3.20% | National, concentrated in logistics corridors | Medium term (2-4 years) |
| Growing preference for "as-a-service" models among SMEs | +2.80% | National, strongest in urban markets | Short term (≤ 2 years) |
| Accelerated automation mandates due to labor constraints | +2.10% | National, acute in high-wage regions | Long term (≥ 4 years) |
| ESG-linked financing incentives from U.S. banks | +1.90% | National, leadership from major metropolitan areas | Medium term (2-4 years) |
| Secondary market liquidity for used equipment | +1.40% | National, regional variations in availability | Short term (≤ 2 years) |
| Federal tax advantages under Section 179 deduction | +1.80% | National, higher impact in high-tax states | Short term (≤ 2 years) |
| Source: Mordor Intelligence | |||
Rising E-commerce Warehouse Expansion
E-commerce fulfilment networks are the single largest catalyst for the United States material handling leasing and financing market, as operators pack more automation into each square foot to achieve same-day delivery commitments. Amazon committed USD 15 billion to new warehouses for 2024-2025, translating to an estimated USD 3 billion in lift trucks, conveyor lines, and automated guided vehicles.[2]Amazon Investor Relations, “Amazon Announces Major Warehouse Expansion,” aboutamazon.com Regional third-party logistics firms mirror this strategy by deploying micro-fulfilment hubs within 10 miles of dense population clusters, where ceiling heights are lower, and automation density is 40% higher than legacy bulk warehouses. Lease demand spikes because landlords and tenants want off-balance-sheet structures for assets that risk technological obsolescence within five to seven years. Forward-looking lessors package predictive-maintenance telemetry and de-risk the deal with residual-value insurance to remain competitive when bidding for these fast-cycle projects.
Growing Preference for “As-a-Service” Models Among SMEs
Cash-constrained small and medium enterprises increasingly choose bundled offerings that wrap financing, maintenance, battery management, and software upgrades into one invoice. A 2024 survey showed 67% of SME logistics operators evaluating an equipment-as-a-service option after pandemic-era supply shocks exposed the hazards of outright ownership.[3]PwC, “Equipment-as-a-Service Adoption Survey,” pwc.com Programs such as Toyota Material Handling’s Total Solutions require no down payment, provide technology refreshes every 36 months, and fold insurance into the monthly rate. The cost certainty of these packages supports working capital planning and reduces reliance on revolving credit facilities during seasonal demand peaks. Lenders gain high lifetime value because service-rich contracts lock in renewals and generate fee streams long after the original asset repayment, thereby improving return on equity even when base interest margins compress.
Accelerated Automation Mandates Due to Labor Constraints
Warehouse job vacancy rates topped 15% in several high-wage regions during 2024, pushing wage costs up by 8.3% year-on-year.[4]Bureau of Labor Statistics, “Warehouse Worker Wage Data,” bls.gov Management teams therefore deploy automated storage, shuttle, and robotic picking systems to curb labour spend and meet productivity quotas. These complex solutions command premium lease rates, but lenders are engineering hybrid structures that share uptime risk with OEMs through service-level-agreement credits. Honeywell’s Intelligrated unit pioneered “automation-as-a-service” deals that guarantee throughput metrics, effectively anchoring a performance-based rental price and shifting part of the failure risk to the supplier. Such models accelerate capital commitment because CFOs can now benchmark automation’s total cost of ownership against a predictable per-unit-handled fee.
ESG-Linked Financing Incentives from U.S. Banks
Electric forklifts and lithium-ion powered AGVs benefit from rate discounts of 25-50 basis points under new green-lease programs rolled out by large banks. Bank of America carved out USD 500 million specifically for warehouse electrification, citing studies that place material handling fleets at 30% of facility-level emissions. Wells Fargo structures these contracts with step-down coupons that reward customers for hitting verified carbon-reduction targets. The discounted funding narrows the total cost gap between electric and internal-combustion units, especially in states with renewable-heavy grids. Lessors consequently see stronger resale appetite for late-model electric fleets, which improves residual-value assumptions and lowers headline lease payments for customers in sustainability-driven verticals such as pharmaceuticals.
Restraints Impact Analysis*
| Restraint | (~) % Impact on CAGR Forecast | Geographic Relevance | Impact Timeline |
|---|---|---|---|
| High residual-value uncertainty for AGVs | -1.80% | National, concentrated in tech-forward markets | Medium term (2-4 years) |
| Bank tightening on credit scores post-2024 | -2.10% | National, acute for SME borrowers | Short term (≤ 2 years) |
| Volatility in benchmark interest rates | -1.60% | National, uniform impact across regions | Short term (≤ 2 years) |
| Cyber-risk premiums embedded in lease contracts | -0.90% | National, higher in critical infrastructure sectors | Long term (≥ 4 years) |
| Source: Mordor Intelligence | |||
High Residual-Value Uncertainty for AGVs
Automated guided vehicles depreciate much faster than conventional forklifts because control software revisions arrive every 12-18 months, creating obsolescence risk and shrinking the secondary buyer pool. Market data show three-year-old AGVs retain only 35-45% of original cost, versus 60-70% for standard lift trucks. Lessors therefore load an additional 150-200 basis-point premium into AGV lease rates to offset potential residual losses. This price delta slows adoption outside top-tier retailers that can absorb the higher carrying cost. Insurers are experimenting with residual-value guarantees, but underwriting capacity remains thin, meaning lenders must cap exposure or insist on technology refresh clauses mid-lease.
Bank Tightening on Credit Scores Post-2024
The Federal Reserve’s rate cycle triggered a recalibration of commercial credit policy, driving minimum FICO thresholds on unsecured equipment loans from 620 to 680 during 2024. Approval rates on small-ticket transactions fell to 65% as regional banks insisted on stronger collateral and shorter amortization schedules. SMEs without lengthy financial histories face borrowing spreads 200-400 basis points above prime, pushing them toward captive finance arms or fintech platforms that price risk algorithmically. The two-tier funding landscape widens competitiveness gaps and may slow penetration of automated solutions among emerging operators that lack seasoned credit profiles.
*Our forecasts treat driver/restraint impacts as directional, not additive. The impact forecasts reflect baseline growth, mix effects, and variable interactions.
Segment Analysis
By Equipment Type: Automation Drives Premium Segment Growth
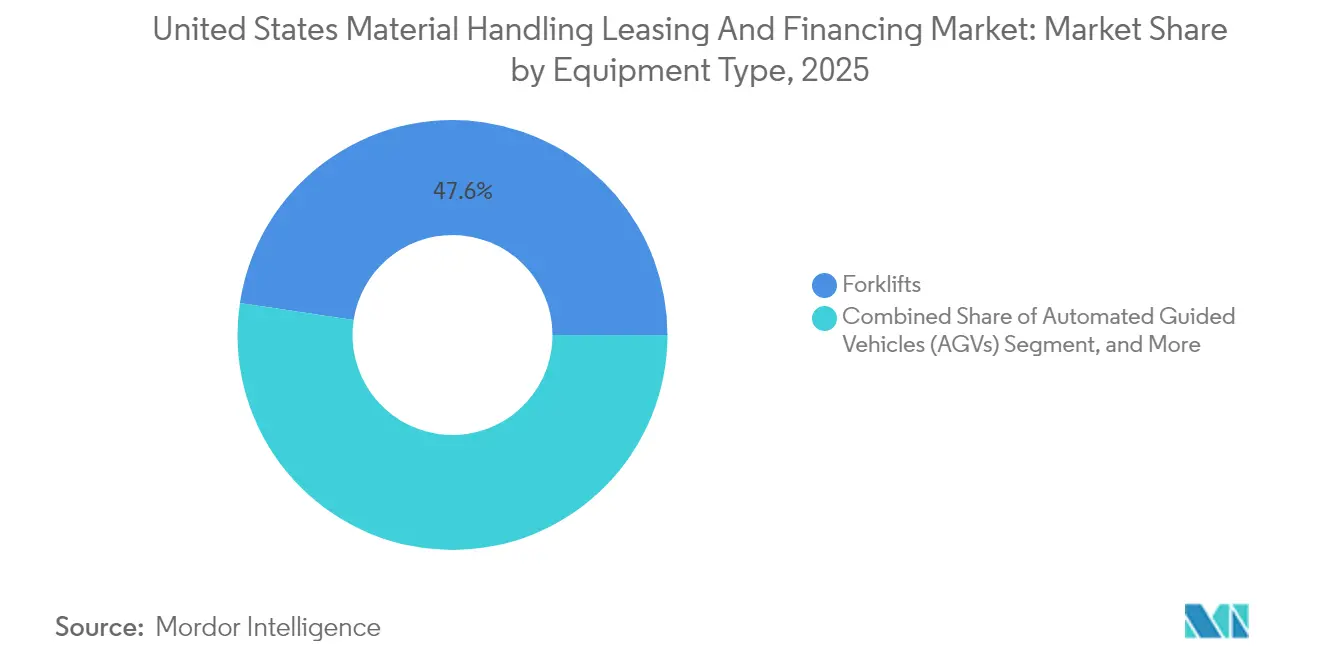
Forklifts retained a 47.62% share of the United States material handling leasing and financing market in 2025 because their universal utility aligns with standardized lease templates that deliver quick credit decisions. At the same time, automated guided vehicles recorded a 16.03% CAGR forecast to 2031 as labour scarcity and rising land costs compel operators to harvest every square foot of cubic storage. Conveyor lines and sorters steady the mid-range, especially inside parcel hubs where volume dictates continuous-flow handling. The United States material handling leasing and financing market size for forklift contracts is forecast to broaden by high-single-digits, yet OEM telemetry add-ons are reshaping residual-value math by enabling condition-based resale pricing. Lessors that integrate IoT analytics into underwriting gain underwriting precision and trim reserve buffers, lowering all-in rates for customers.
Increasing automation shifts lease structures from simple rent-to-own toward performance-linked service contracts bundling software licenses, artificial-intelligence guidance, and on-site technical support. Tesla’s Gigafactory, for instance, embedded a multi-year “equipment availability” guarantee in its agreement with KION Group, obligating the supplier to restore uptime inside a two-hour window or face penalty credits. Such clauses affect cash-flow models because lenders must verify that OEM service capacity can protect throughput targets underpinning the lease. For traditional finance houses, partnering with systems integrators has become essential to protect collateral value, especially for conveyor-plus-robotic hybrids whose resale hinges on modular adaptability.



By End-User Industry: Pharmaceuticals Emerge as Growth Leader
E-commerce and third-party logistics players absorbed 36.78% of 2025 financing volume, yet the pharmaceuticals customer base is forecast to achieve a 16.49% CAGR, driven by stringent cold-chain regulations that mandate advanced storage, lift, and shuttle systems. The United States material handling leasing and financing market share attributable to pharmaceutical operators is set to climb rapidly as firms add high-density automated storage serving cell-and-gene therapy pipelines. Financing tickets skew larger because compliance requires stainless-steel lifts, redundant power, and validated software, each inflating asset cost. Lenders price in FDA validation’s beneficial effect on residuals, as validated equipment often resells at a premium to emerging biomanufacturers seeking pre-qualified machinery.
Manufacturing and retail verticals still supply predictable baseline demand, but their growth rates trail automation-heavy sectors. Food and beverage facilities rely on captive finance channels able to underwrite temperature-controlled lift trucks equipped with corrosion-resistant components. Meanwhile, brick-and-mortar retail invests in back-of-store micro-fulfilment pods, often financed under short-cycle operating leases to accommodate evolving omnichannel strategies. Lessors tailor covenants to handle seasonality, allowing holiday-period payment deferrals that align cash outflows with revenue inflows.
By Capacity Range: Micro-Fulfilment Drives Lightweight Demand
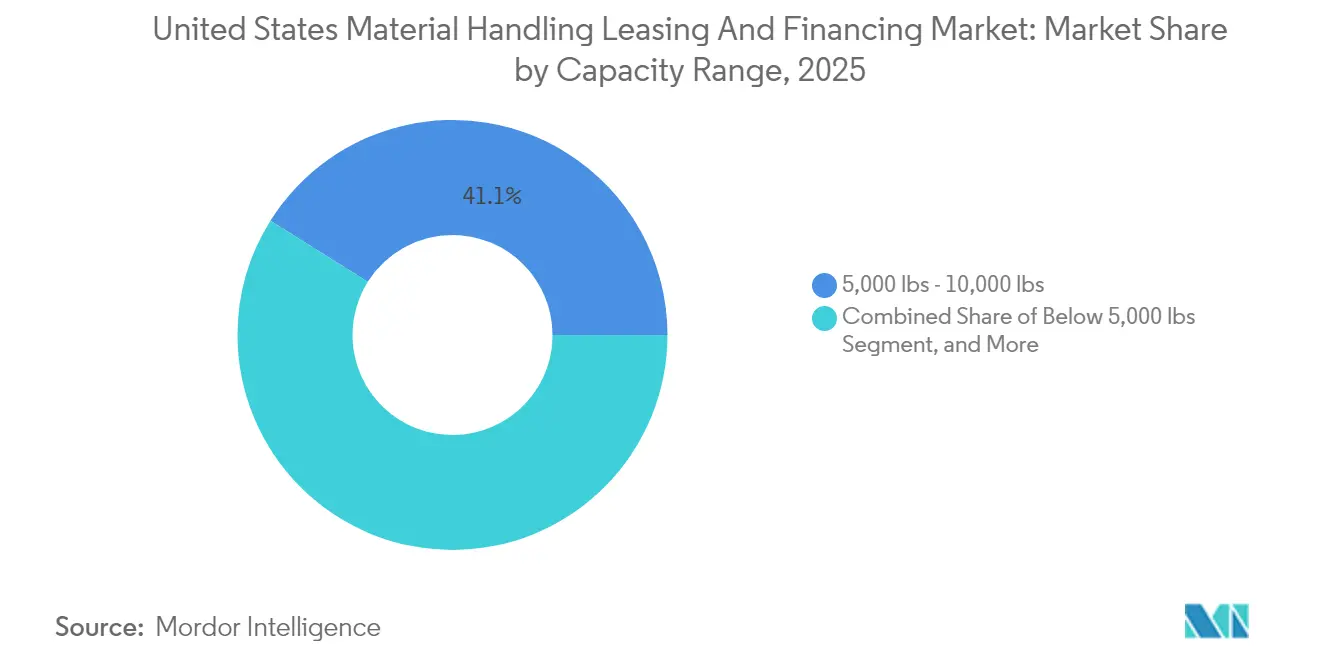
Equipment rated 5,000-10,000 pounds claimed 41.08% of 2025 financed assets, representing the ergonomic sweet spot for general distribution. Nonetheless, units below 5,000 pounds are scheduled for a 17.62% CAGR, as dense urban fulfilment nodes adopt narrow-aisle trucks and compact autonomous mobile robots. The United States material handling leasing and financing market size for light equipment will likely double before 2031. Shorter lease tenors and streamlined documentation draw SME entrants who need agile financing when opening last-mile depots on month-to-month real-estate terms. Residual-value risk is comparatively mild because the secondary market for lightly used Class III pallet trucks remains liquid across foodservice, beverage, and manufacturing outlets.
In contrast, 10,001-20,000-pound models serve bulk manufacturing and port terminals where duty cycles run three shifts, compelling 60-month or longer capital-lease terms. Here, lessors bake in higher maintenance provisions or insist on OEM service contracts to maintain asset condition. Equipment above 20,000 pounds fills niche heavy-industry roles, demanding interest-only structures or balloon payments that synchronize with project lifecycles such as refinery turnarounds.
By Financing Type: Sale-Leaseback Gains Momentum
Operating leases dominated 51.73% of 2025 activity, buoyed by Section 179 tax deductibility that lets lessees’ expense up to USD 1.22 million immediately. The United States material handling leasing and financing market size attributable to operating leases continues to climb, yet sale-and-leaseback transactions show the sharpest 16.95% CAGR as corporates unlock trapped equity. Prologis pioneered facility-plus-equipment packages that monetize tenant fleets while embedding flexible renewal options tied to occupancy terms. Capital leases remain relevant for specialized crane systems whose economic life exceeds 12 years, while traditional loans attract investment-grade borrowers seeking lowest-cost capital.
Sale-leaseback proceeds increasingly fund automation retrofits, allowing operators to tap existing forklift pools for liquidity without diluting shareholder equity. Lessors mitigate risk by coupling residual guarantees with equipment condition assessments conducted at transaction close. Asset tracking via RFID tags feeds dashboards that rank lessee utilization patterns and flag abnormal wear, enabling early intervention and protecting collateral integrity.
Geography Analysis
California, Texas, and the Northeast logistic corridor collectively generated roughly 44.62% of United States material handling leasing and financing market volume in 2025, thanks to port density, consumer concentration, and entrenched manufacturing. The Inland Empire alone accounts for about 7.84% of national bookings, underpinned by Asian import flows funnelled through the Port of Long Beach’s USD 2.6 billion modernization pipeline. Lessors active in these hot zones can price more aggressively because asset redeployment options are plentiful within a 50-mile radius, trimming idle time between contracts.
The Southeast and Mountain West are the fastest-growing territories as e-commerce networks hunt for lower land cost and congestion relief. States such as Georgia and Arizona lure fulfilment centers with tax credits that stack atop Section 179 deductions, compressing effective lease yields and enhancing project IRRs. FedEx’s USD 1.5 billion Memphis superhub revamp includes cutting-edge sorters, shuttles, and autonomous tugs financed chiefly under long-term operating leases, cementing the region’s status as a multi-modal nexus.
Interest-rate volatility influences regional spreads: coastal lenders face stiff competition from national banks, while inland borrowers rely on captive finance or local lenders who demand higher coupons to offset thinner resale channels. Public-private partnerships at major ports foreground a new template in which municipal agencies avoid upfront capital outlays by leasing automated cranes and automated stacking carriers from private lessors, aligning equipment payments with throughput-based concession revenue.
Regulatory Landscape
The market operates under a mix of workplace safety compliance, equipment safety rules, and trade policy that influence equipment costs and lease structuring. OSHA requirements such as 29 CFR 1910.178 (powered industrial trucks) and construction safety standards under 29 CFR 1926 shape operator training, inspections, and documentation that many lessors now incorporate as lease covenants. For robotics, OSHA does not have an industry-specific robot standard, and users and integrators commonly reference ANSI/A3 R15.06-2025 (published in October 2025) for risk assessment and safety practices, including cybersecurity clarifications.
Trade and federal rulemaking activity also affects pricing, residual values, and procurement timing for material handling fleets and port-adjacent equipment. USTR actions implemented 100% Section 301 tariffs on Chinese-origin ship-to-shore cranes and intermodal chassis from November 2025, tightening total project economics for port modernization and influencing lease-versus-buy decisions for crane- and chassis-dependent operations. In 2026, safety-related federal activity included a February 2026 Federal Register action on parts and accessories necessary for safe operation (brakes on portable conveyors), and PHMSA opened an advance rulemaking track in early 2026 on hazardous materials moves using highly automated transportation systems, a relevant compliance watchpoint for automated handling workflows tied to regulated goods. Separately, Section 232 duty settings for certain mobile industrial equipment changed effective June 8, 2026, creating differentiated economics for equipment with higher U.S.-sourced steel or aluminum content under the updated duty framework.
Competitive Landscape
The United States material handling leasing and financing market remains moderately concentrated, with the top ten players capturing close to 60% of funded volume. Still, niche lenders and fintech entrants inject fragmentation by targeting underserved verticals such as micro-fulfilment and robotics. Element Fleet Management’s USD 450 million portfolio acquisition strengthened its presence in high-tech warehouse automation, underscoring a strategic pivot toward solutions expertise rather than pure capital supply.
Technology integration is the new battleground. Wells Fargo’s Smart Fleet portal streams real-time utilization, fault codes, and battery state of charge, enabling dynamic lease renewals aligned with actual wear patterns. Traditional lessors that lack digital telemetry risk commoditization as clients favour partners able to deliver uptime guarantees. Pacific Rim Capital competes on agility – funding approvals in under 48 hours – appealing to retailers racing to open pop-up distribution centers before holiday surges.
Manufacturer-captive finance companies tighten the circle by layering extended warranty, operator training, and software license fees into monthly rentals, gradually absorbing services revenue that once flowed to third-party dealers. Independent lessors respond by offering multi-brand fleet structures, an advantage for clients running mixed OEM environments across national footprints. Mergers such as CIT’s union with First Citizens Bank illustrate scale economics – a wider balance sheet lowers cost of funds, allowing sharper rate quotes while still meeting yield targets.
United States Material Handling Leasing And Financing Industry Leaders
CIT Group Inc.
Crest Capital LLC
Element Fleet Management Corp
Trust Capital LLC
DLL Finance LLC
- *Disclaimer: Major Players sorted in no particular order


Market Opportunities and Future Outlook
White space is concentrated in financing solutions that align with the shift toward retrofit-heavy automation and software-led operations. With 65-70% of annual automation spend reported as going to smaller brownfield projects rather than greenfield builds, lessors and lenders can standardize faster-turn underwriting for modular deployments such as AMRs, robotic picking cells, and conveyor add-ons that are installed in phases and frequently reconfigured. That supports bundled offerings that combine short-tenor operating leases with service, telemetry, and refresh clauses, consistent with equipment-as-a-service adoption patterns already visible among SMEs and programs such as Toyota Material Handling’s Total Solutions.
There is also an opportunity in financing packages that connect hardware to warehouse execution and information systems investment. Modern Materials Handling’s 2026 outlook survey indicates 32% of surveyed companies plan to invest in more material handling equipment and 27% are focused on information systems such as WMS/WCS and asset management software, supporting demand for integrated financing covering both physical assets and enabling software. Industry bodies such as the Equipment Leasing and Finance Association (ELFA) and Equipment Finance Advantage also provide channels for standard setting and adoption of digital origination, credit policy updates, and documentation practices that support smaller ticket, higher-velocity transactions, including used-equipment financing where operators manage costs and lead times while upgrading facilities incrementally.
Recent Industry Developments
- July 2026: Symbotic acquired ARMS Innovations Ltd., adding warehouse operations optimization software capabilities to its automation portfolio. The combination broadens end-to-end automation offerings beyond hardware, increasing the relevance of software-inclusive financing structures and service-led contracts for automated material handling deployments.
- May 2026: The Equipment Leasing and Finance Association reported an equipment finance approval rate of 79.0%, the highest level since December 2021. Easier approval conditions support faster cycle times for leasing and loan decisions for forklifts, automation add-ons, and retrofit projects that are commonly executed in smaller phases.
- July 2024: Toyota Material Handling secured a USD 2 billion credit facility to scale its Total Solutions equipment-as-a-service projects. The added funding capacity supports bundled monthly payment models that combine equipment, maintenance, and technology refreshes, reinforcing competitive pressure on independent lessors to match service-rich structures.


Research Methodology Framework and Report Scope
Market Definition and Coverage
This market measures the revenues generated from leasing and financing arrangements used to acquire and use material handling equipment in the United States, across typical customer industries that operate warehouses, plants, and distribution centers.
Scope exclusions: Pure equipment manufacturing sales (when not tied to a lease, loan, or sale and lease-back contract), as well as operator labor services, are not counted.
Segmentation Overview
- By Equipment Type
- Forklifts
- Automated Guided Vehicles (AGVs)
- Conveyor Systems
- Storage and Retrieval Systems
- Cranes and Hoists
- By End-User Industry
- E-commerce and 3PL
- Food and Beverage
- Manufacturing
- Retail (non-e-commerce)
- Pharmaceuticals
- By Capacity Range
- Below 5,000 lbs
- 5,000 - 10,000 lbs
- 10,001 - 20,000 lbs
- Above 20,000 lbs
- By Financing Type
- Operating Lease
- Capital Lease
- Loan / Hire-Purchase
- Sale and Lease-Back
Data Sources, Market Sizing, and Validation
Desk Research
Desk work starts by collecting basic signals that explain why leasing and financing volumes move year to year. We rely on public data such as US Census Bureau construction and business activity tables, Bureau of Labor Statistics employment and productivity series tied to warehousing and manufacturing, and Federal Reserve interest rate and credit condition indicators.
To connect demand to equipment usage, we also refer to sources such as US International Trade Commission trade statistics, the US Patent and Trademark Office filings that hint at automation intensity, and materials from industry associations focused on industrial trucks, warehousing, and logistics. On the company side, we review filings, investor presentations, and press releases that describe portfolio mix and financing programs, and we also use paid subscriptions for company financials and news screening to keep timelines consistent. These sources are not exhaustive, and many other public documents were reviewed to collect, cross-check, and clarify data points.
Primary Interviews and Surveys
Primary discussions are used to confirm what is actually financed versus purchased outright, and to align assumptions on average ticket sizes, typical contract lengths, and renewal behavior. We speak with a mix of lessors, financing arms, dealers, and large end users across the United States, and then we recheck differences by equipment class (for example, lift trucks versus conveyors) before finalizing the model.
Distribution of primary research fieldwork respondents
| Company type | Respondent position |
|---|---|
| Top tier: 33% | CXOs: 13% |
| Mid tier: 46% | Functional/Unit leaders: 28% |
| Smaller Players: 21% | Managers: 59% |
Market-Sizing & Forecasting
Market sizing is built using a top-down and bottom-up approach, where the top-down side reconstructs a financed equipment pool from US material handling activity and credit conditions, and then allocates that pool to leasing and financing revenue using observed contract structures. To keep the math realistic, we corroborate totals using selective bottom-up checks such as sampled monthly payments and implied financed values from dealer and lessor conversations, followed by a sanity check on revenue per active contract.
Key model inputs include warehouse construction and expansion activity, industrial production and manufacturing utilization, borrowing cost trends that shift lease versus loan choices, replacement cycles for core equipment (such as lift trucks), and the adoption rate of automation that changes average deal sizes. For forecasting, scenario analysis is used because rate movements and capex cycles can swing quickly, and the scenarios are anchored to how interviewees expect pricing, utilization, and approval strictness to move. Where bottom-up signals are missing for smaller equipment categories, we estimate using shared contract patterns and scale the results using industry mix indicators, and then we adjust only after the validation checks agree.
Data Validation & Update Cycle
Validation is handled through cross-checks between the model output and independent signals such as equipment deployment trends, credit spreads, and visible warehouse buildout momentum. When unusual jumps show up, the assumptions are reviewed again, and follow-up calls are triggered to confirm whether the change is real or caused by a definition mismatch.
Before sign-off, the numbers go through a multi-step analyst review that tests year-on-year movement, implied pricing, and sensitivity to the main drivers. The report is refreshed annually, and interim updates are made when material events occur such as sharp rate changes or major policy shifts that impact equipment expensing. Right before delivery, a final review pass is completed so clients receive an up-to-date view.
Mordor Intelligence's United States Material Handling Leasing and Financing Market Size Versus Other Published Estimates
Published numbers for this market often do not match, even when they describe the same country and the same broad equipment universe. The differences usually come from how each publisher treats financing types, what revenue line is counted, and which year and currency timing is used.
The table shows a spread that is mainly explained by scope and measurement choices, where some estimates appear to fold in adjacent equipment purchasing activity or count the financed asset value instead of the leasing and financing revenue stream. Another common gap is how refinancing, sale and lease-back, and bundled maintenance are treated, because the same contract can be recorded as services in one view and as financing revenue in another, which then changes the market size.
Benchmark comparison
| Source | Market Size | Gaps in Research Methodology |
|---|---|---|
| Mordor Intelligence | USD 1.54 B (2025) | |
| Global Consultancy A | USD 1.32 B (2025) | Uses a narrower equipment mapping and regional roll-ups that can undercount large automated system financing, and it likely applies more conservative assumptions for renewal and refinancing activity. |
| Industry Publisher B | USD 1.15 B (2024) | Reports an earlier base year and may mix lending volume signals with revenue, and it provides fewer checks on interest rate timing and contract structure differences across customer groups. |
The table points to a scope-driven spread, and in Mordor Intelligence's model the number represents leasing and financing revenues tied to material handling equipment, rather than the full financed asset value or unrelated service lines. With the same drivers carried consistently from year to year, the resulting market size stays traceable to clear inputs like credit conditions, warehouse activity, and replacement behavior, which makes the final output easier to reproduce and update.


Key Questions Answered in the Report
What is the projected 2031 value of United States material handling leasing and financing?
The market is forecast to reach USD 3.63 billion by 2031, reflecting a 15.39% CAGR over 2026-2031.
Which equipment category is growing fastest in U.S. warehouse financing?
Automated guided vehicles lead with a 16.03% CAGR forecast through 2031 as firms accelerate automation.
How do Section 179 deductions influence equipment leasing decisions?
Lessees can expense up to USD 1.22 million immediately, making operating leases the preferred structure for fast-turnover fleets.
Why are sale-and-leaseback deals becoming popular among warehouse operators?
They unlock trapped equity from existing fleets, funding automation upgrades without increasing balance-sheet debt, and are projected to grow at 16.95% CAGR.
Which regions are hotspots for new leasing activity?
California's Inland Empire, Texas distribution corridors, and the Southeast logistics belt exhibit the highest growth due to port modernization and e-commerce fulfillment expansion.
Page last updated on:





