
Contact Lenses Market Size and Share
Market Overview
| Study Period | 2022 - 2031 |
|---|---|
| Market Size (2026) | USD 10.98 Billion |
| Market Size (2031) | USD 13.12 Billion |
| Growth Rate (2026 - 2031) | 3.62 % |
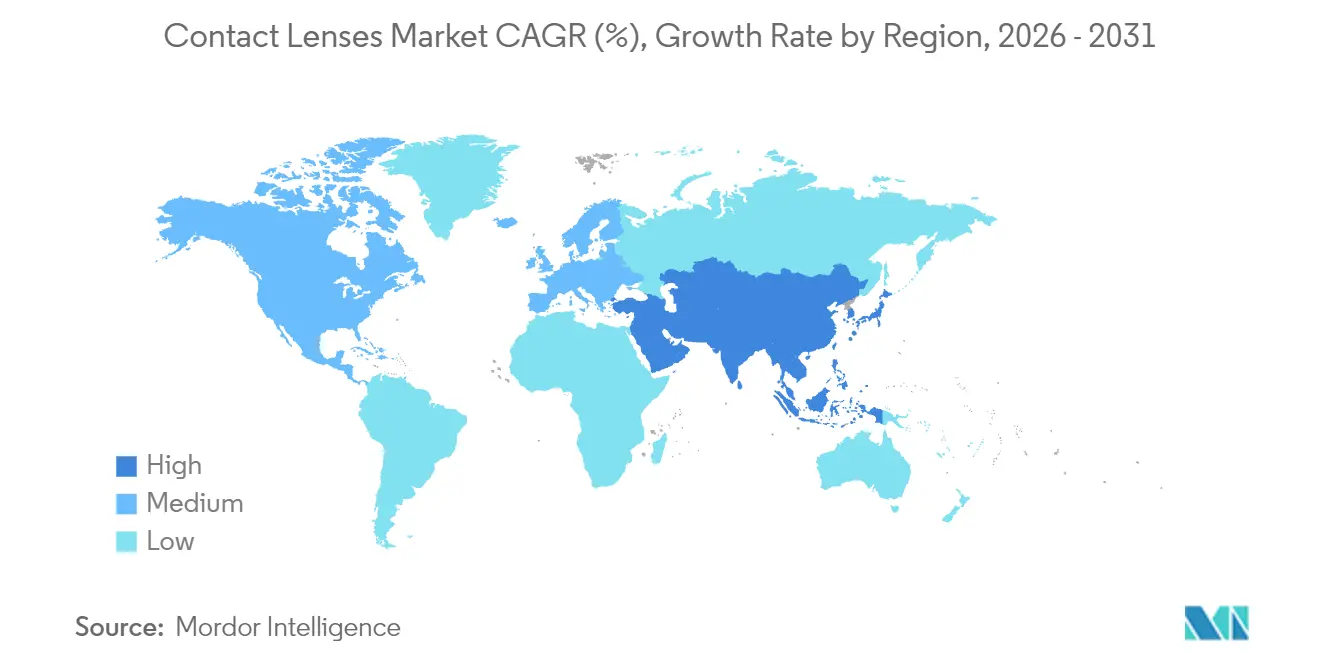
| Fastest Growing Market | Asia-Pacific |
| Largest Market | North America |
| Market Concentration | Medium |
Major Players *Disclaimer: Major Players sorted in no particular order Image © Mordor Intelligence. Reuse requires attribution under CC BY 4.0. | |
Contact Lenses Market Analysis by Mordor Intelligence
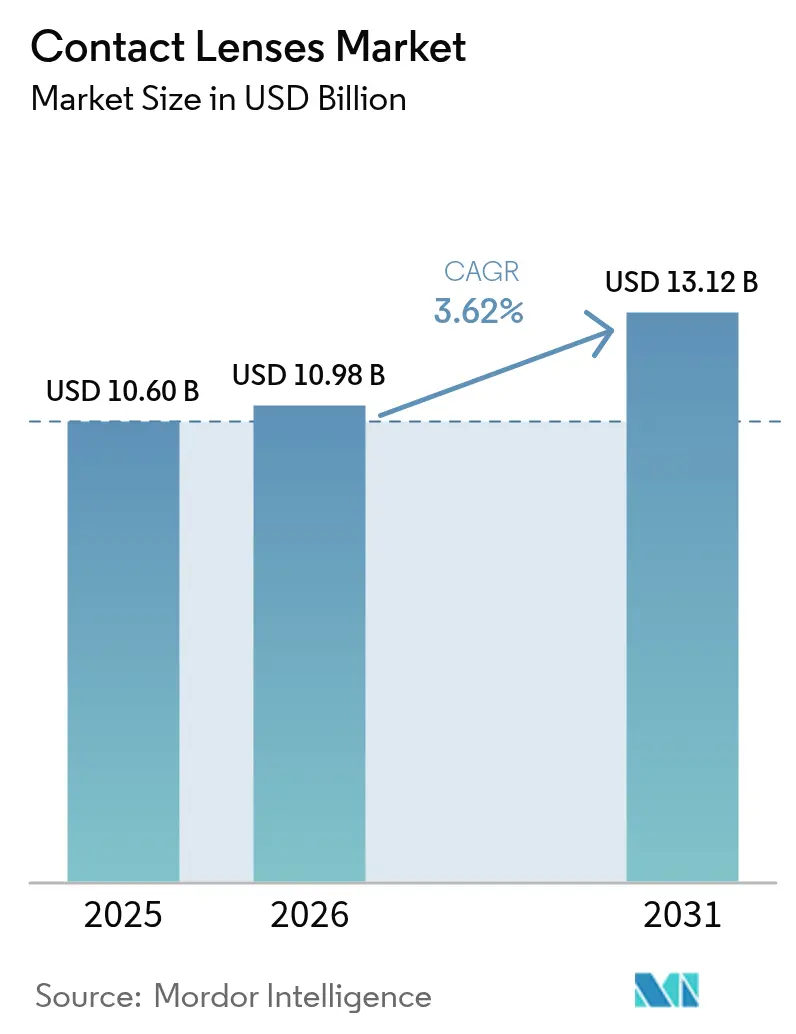
The Contact Lenses market size is expected to grow from USD 10.60 billion in 2025 to USD 10.98 billion in 2026 and is forecast to reach USD 13.12 billion by 2031 at 3.62% CAGR over 2026-2031.
This steady expansion springs from premium material adoption, therapeutic lens launches, and the ongoing pivot to e-commerce rather than from a rising wearer base. Myopia’s rapid spread, especially among urban Asian youth, keeps demand resilient, while convenient daily disposables reinforce recurring revenue. Silicone-hydrogel remains the cornerstone material because it cuts hypoxia risk and underpins advanced designs such as smart sensors and drug-eluting lenses. On the commercial side, omnichannel strategies protect incumbents as online specialists chip away at brick-and-mortar traffic, and sustainability mandates spur R&D aimed at recyclable blisters and PFAS-free chemistries.
Key Report Takeaways
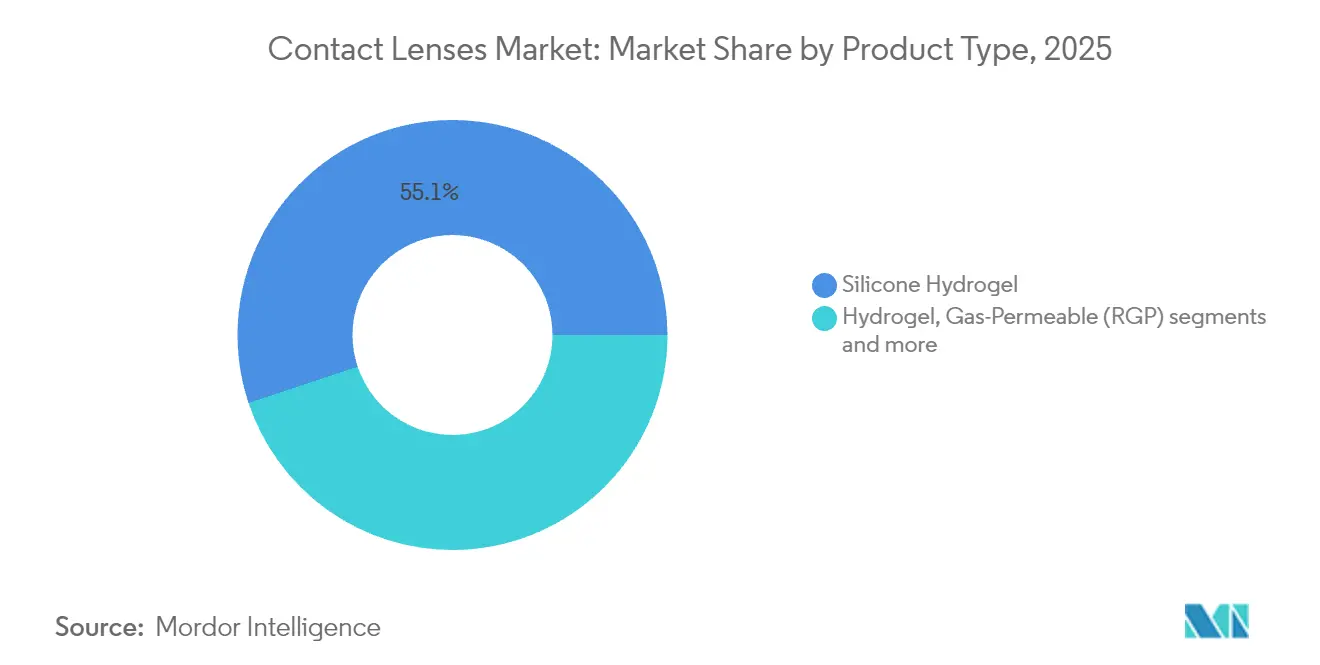
- By material, silicone-hydrogel lenses commanded 55.12% of the contact lens market share in 2025; the same segment is projected to post a 4.18% CAGR through 2031.
- By design, spherical lenses led with 41.92% revenue share in 2025, whereas toric lenses are forecast to clock the fastest 4.48% CAGR over 2026-2031.
- By usability, daily disposables accounted for 49.05% of the contact lens market size in 2025 and are advancing at a 4.84% CAGR during the outlook period.
- By application, vision-correction lenses retained 59.02% share of the 2025 base, while myopia-control products are expanding at a 5.16% CAGR to 2031.
- By distribution channel, retail optical stores held 45.98% of the contact lens market revenues in 2025, although online and e-commerce outlets are growing faster at a 5.55% CAGR.
Note: Market size and forecast figures in this report are generated using Mordor Intelligence’s proprietary estimation framework, updated with the latest available data and insights as of 2026.
Market Trends and Insights
Drivers Impact Analysis of Contact Lenses Market*
| Driver | (~) % Impact on CAGR Forecast | Geographic Relevance | Impact Timeline |
|---|---|---|---|
| Rising prevalence of myopia among youth | +1.8% | Global, with highest impact in Asia-Pacific | Long term (≥ 4 years) |
| Rapid adoption of daily disposable soft lenses | +0.9% | North America & Europe leading, expanding to APAC | Medium term (2-4 years) |
| Technological breakthroughs in silicone-hydrogel & smart lenses | +0.6% | Global, with innovation centers in US, Europe, Japan | Long term (≥ 4 years) |
| Expansion of e-commerce & D2C distribution | +0.4% | Global, accelerated in post-pandemic markets | Short term (≤ 2 years) |
| Surge in cosmetic & colored lens demand among Gen-Z in Asia | +0.3% | Asia-Pacific core, spill-over to other regions | Medium term (2-4 years) |
| Source: Mordor Intelligence | |||


Rising Prevalence of Myopia Among Youth
Global myopia prevalence among children and adolescents is forecast to reach 39.80% by 2050, translating into more than 740 million affected individuals[1]Source: British Journal of Ophthalmology, “Global Prevalence of Myopia,” bjo.bmj.com. East Asian cities record the sharpest increments, with screen-time escalation during COVID-19 restrictions accelerating axial length growth. As myopia commonly begins in childhood and progresses through teenage years, demand stabilizes for corrective wear across the contact lens market, while dual-focus and peripheral defocus lenses emerge to slow progression. One Chinese trial showed dual-focus soft lenses limiting axial elongation by 0.10 mm versus spectacles over one year[2]Source: BMC Ophthalmology, “Dual-Focus Soft Lenses Slow Axial Length Growth,” bmcophthalmol.biomedcentral.com. This therapeutic edge shifts procurement from commodity correction toward premium prophylactic devices.
Rapid Adoption of Daily Disposable Soft Lenses
Daily disposables jumped from 17.1% of soft lens fits in 2000 to 46.7% in 2023, mirroring heightened hygiene awareness and convenience priorities. Uptake correlates with GDP per-capita, so penetration is deepest in the United States, Canada, and Western Europe. Younger adults prefer single-use wear that removes cleaning chores, while practitioners welcome the lower infection profile. Silicone-hydrogel disposables blend high oxygen flux with single-use packaging, although price sensitivity restrains emerging-market adoption, especially in cost-pressured segments of the contact lenses market.
Technological Breakthroughs in Silicone-Hydrogel & Smart Lenses
Silicone-hydrogel represents 76% of global soft lens fits [coopervision.com], owing to breathable matrices that combat corneal hypoxia. Research extends well beyond optics: Nanyang Technological University engineers devised tear-powered micro-batteries thin enough for in-lens integration; other teams print polyvinyl-alcohol releasing scaffolds for dry-eye relief. These advances recast lenses as diagnostic and drug-delivery platforms, raising entry thresholds for firms lacking deep materials science benches.
Expansion of E-commerce & D2C Distribution
Lens e-tailers scale fast as prescription verification systems mature and subscription deliveries amplify repeat sales. COVID-19 lockdowns nudged digital adoption, and daily disposables align naturally with automated replenishment. Still, regulatory checks—especially in the United States, where the Contact Lens Rule mandates valid scripts—temper unfettered growth, fortifying omnichannel incumbents that pair online portals with practitioner network. The digital shift is now a defining structural change within the modern contact lenses market.
Restraints Impact Analysis of Contact Lenses Market*
| Driver | (~) % Impact on CAGR Forecast | Geographic Relevance | Impact Timeline |
|---|---|---|---|
| Contact-lens related dry-eye & wearer drop-outs | -0.6% | Global, with higher impact in dry climates | Medium term (2-4 years) |
| Stringent FDA / CE regulatory approvals | -0.5% | North America & Europe primarily | Long term (≥ 4 years) |
| Sustainability backlash against single-use plastics | -0.4% | Europe & North America leading, expanding globally | Medium term (2-4 years) |
| Growing uptake of low-cost refractive surgeries (SMILE) in Asia | -0.3% | Asia-Pacific core, particularly China, South Korea | Short term (≤ 2 years) |
| Source: Mordor Intelligence | |||
Contact-Lens Related Dry-Eye & Wearer Drop-Outs
An estimated 30%–50% of the world’s 140 million lens wearers experience dry-eye symptoms that often culminate in discontinuation. Tear instability and surface desiccation degrade comfort, especially in extended-wear and monthly modalities. Manufacturers respond with water-gradient surfaces and self-lubricating coatings; Delefilcon A dailies significantly eased symptoms in one multi-center study. Microfluidic channels that pump tears across the cornea remain experimental but illustrate the race toward physiological compatibility.
Stringent FDA / CE Regulatory Approvals
As lenses morph into drug reservoirs and electronic sensors, they enter uncharted regulatory categories. The United States Food & Drug Administration recently issued Complete Response Letters for several ocular therapeutics, signaling intensified evidence demands. In Europe, MDR rules toughen biocompatibility dossiers and post-market surveillance obligations, elongating launch timetables and inflating compliance budgets. Smaller innovators face capital hurdles unless they partner with seasoned market holders.
*Our forecasts treat driver/restraint impacts as directional, not additive. The impact forecasts reflect baseline growth, mix effects, and variable interactions.
Contact Lenses Market Segment Analysis
Soft Contact Lenses Segment in Contact Lenses Market
The soft contact lenses segment continues to dominate the global contact lenses market, commanding approximately 63.40% of the contact lenses market share in 2025. This significant market position is attributed to the numerous advantages these lenses offer over other product types, including superior comfort, easier adaptation for new users, and better oxygen permeability to the cornea. The segment's growth is further bolstered by technological advancements in silicone hydrogel materials, which provide enhanced breathability and moisture retention. Major market players like Johnson & Johnson Vision and Alcon have strengthened this segment through their innovative product offerings, particularly in daily disposable and monthly replacement categories. The segment is also experiencing the fastest growth rate in the market, driven by increasing consumer preference for comfortable vision correction solutions and the rising adoption of contact lenses for both medical and cosmetic purposes.


By Design:
Spherical Lenses Lead Amid Toric AccelerationSpherical products retained 41.92% of the contact lenses market share of 2025 sales, buoyed by straightforward fits for myopia and hyperopia. Toric lenses, however, will post the segment’s strongest 4.48% CAGR as diagnostics identify latent astigmatism and stabilizing geometries improve rotational consistency. Multifocal formats aim at presbyopic boomers but still encounter adaptation resistance.
Advanced lathe-cutting and wavefront-guided molds now deliver bespoke optics, reducing higher-order aberrations and nurturing loyalty. Meanwhile, cosmetic overlays flourish in Asia’s social-media ecosystems. The contact lens market continues diversifying design SKUs, pressing manufacturers to automate small-batch production while maintaining price competitiveness.
By Usability:
Daily Disposables Capture Convenience PremiumDaily disposables represented 49.05% revenue in 2025 and will grow fastest at a 4.84% CAGR. Unit pricing exceeds monthly lenses, but elimination of cleaning solutions plus infection-risk reduction rationalizes the spend for affluent users. The contact lens market share leadership of this modality benefits from consumer subscription models that secure predictable cash flows for sellers.
Weekly and bi-weekly formats address mid-tier budgets, yet the rise of high-oxygen daily materials may squeeze these schedules. Monthly lenses endure in emerging economies where cost per day remains decisive. Manufacturers use digitally printed packaging and QR-based reordering to cement habitual purchasing, deepening daily disposables’ moat.
By Application:
Vision Correction Holds, Therapeutics SurgeVision correction continued to supply 59.02% of turnover in 2025. However, myopia-control lenses, expanding at 5.16% CAGR, illustrate the swing toward preventive ophthalmology. Drug-eluting designs treat glaucoma, allergy, and post-surgical inflammation, with sustained delivery improving adherence. The contact lens market size for therapeutic indications is still modest but carries higher average selling prices and thicker regulatory files.
Cosmetic use aligns with fashion cycles; hence demand spikes during cultural events and social-media campaigns. Orthokeratology lenses worn overnight reshape corneal curvature, appealing to adolescents seeking daytime freedom from aids. Such specialty niches require practitioner-led fitting, embedding professional services into the product value chain.

By Distribution Channel:
Digital Transformation Challenges RetailOptical stores maintained 45.98% of 2025 receipts because complex fits and follow-up exams need chair time. Yet online channels, expanding 5.55% annually, win replenishment orders from seasoned wearers. The contact lens market size captured by pure-play e-commerce firms is rising quickly in the United States, Japan, and parts of Europe where electronic prescription validation is streamlined.
Hospital clinics dominate therapeutic and specialty dispensing, given regulatory guardrails. Hybrid retail models surface, with practitioners offering app-based subscription refills plus in-office aftercare. Traditional chains retrofit stores into experience centers showcasing diagnostic tech, while click-and-collect counters limit shipping costs for single-day lenses.
Geography Analysis
North America Contact Lenses Market
North America remains the largest region by value, supported by insurance coverage and practitioner density. The United States contributes the bulk of turnover, buoyed by premium daily disposables and early adoption of myopia-control designs. Canada mirrors these trends at smaller scale, whereas Mexico’s youthful demographics create fresh penetration opportunities despite price constraints. Regulatory clarity under the FDA accelerates innovation, but heightened scrutiny adds cost layers that smaller entrants must navigate.
APAC Contact Lenses Market
Asia-Pacific delivers the fastest growth as myopia rates soar across China, Japan, South Korea, and Singapore. China exhibits explosive e-commerce lens sales, though cross-border gray markets muddy compliance. Japan pioneers smart lens R&D, while South Korea anchors fashion-led cosmetic demand. India’s urban middle class increasingly embraces silicone-hydrogel dailies, yet broad affordability hurdles persist. Regional heterogeneity obliges tailored go-to-market tactics ranging from key-opinion-leader engagement to WeChat mini-store activations.
Europe Contact Lenses Market
Europe logs steady but moderate expansion. Germany and France favor premium multifocals for presbyopia, whereas the United Kingdom’s online retailers shape price transparency post-Brexit. Sustainable packaging and PFAS-free chemistry resonate with EU Green Deal priorities, prompting lifecycle assessments across the supply chain. Southern markets like Spain and Italy lean on family-run opticians, making relationship selling crucial. Harmonized MDR requirements reinforce patient safety yet extend time-to-launch for complex therapeutics.

Regulatory Landscape
Contact lenses are regulated as medical devices in major markets, and prescription-handling and sales rules shape distribution. In the United States, the FDA regulates contact lenses as medical devices, while the Federal Trade Commission enforces the Contact Lens Rule (16 CFR Part 315) under the Fairness to Contact Lens Consumers Act, including prescription release and seller verification requirements that directly affect online and subscription models.
In Europe, EU MDR (Regulation (EU) 2017/745) increases documentation and post-market expectations, and traceability requirements tighten through UDI implementation. The Medical Device Coordination Group (MDCG) has issued guidance supporting a Master UDI-DI approach for contact lenses, and the EU UDI/device registration module of Eudamed becomes mandatory on 28 May 2026. Manufacturers must implement the Master UDI-DI assignment system by 9 November 2026, with products made before that date exempt from the Master UDI-DI labeling requirement, making 2026 a key operational milestone for labeling, data governance, and EU market access readiness.
Value Chain Analysis
The contact lenses value chain starts with upstream chemical inputs (monomers, additives, and packaging components), then moves into lens manufacturing (high-volume molding and curing for soft lenses, plus lathing for custom and durable designs). After quality and regulatory release, products reach distribution through practitioner-led channels and retail and e-commerce. Scale leaders such as EssilorLuxottica use vertical integration across manufacturing, distribution, and retail to improve demand capture and pricing control, while global brand owners rely on automated production, packaging, and logistics networks to support high-frequency modalities such as daily disposables.
Downstream, optical stores and eye clinics are central for initial fitting, higher-acuity users (toric, multifocal, ortho-k), and follow-up care, while online sellers concentrate on replenishment supported by prescription verification requirements, notably under the FTC Contact Lens Rule in the United States. Compliance is embedded across the chain, including biocompatibility documentation, sterility and process validation, clinical evaluation, and post-market surveillance. EU traceability updates, including the shift to a Master UDI-DI with a 9 November 2026 implementation date and mandatory Eudamed UDI/device registration from 28 May 2026, also increase the importance of digital product-master data, labeling change control, and compliant cross-border distribution.
Competitive Landscape
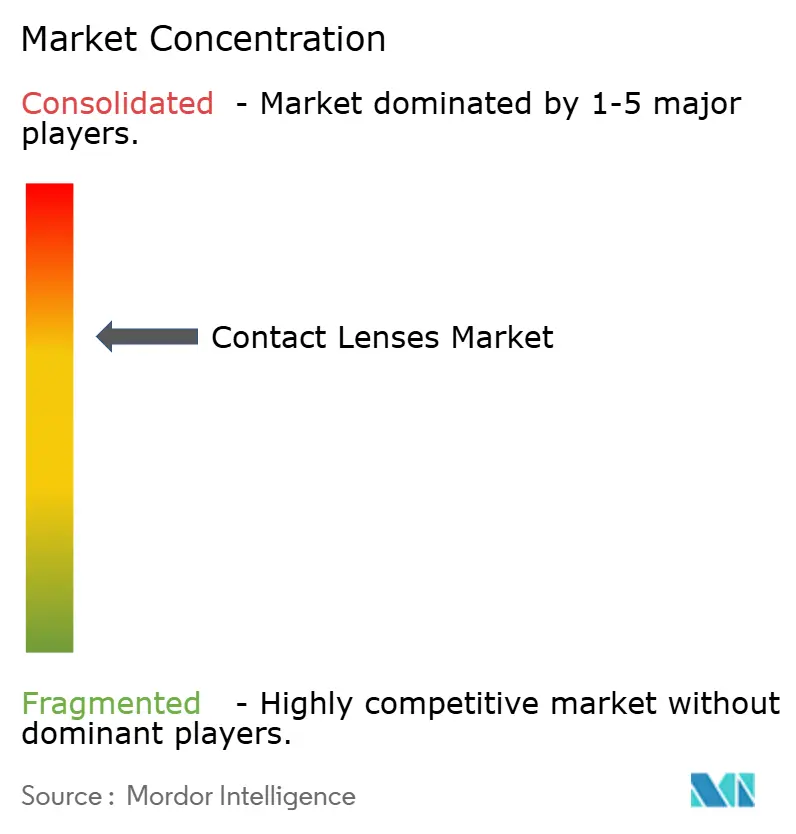
The contact lens market tilts toward moderate concentration. Johnson & Johnson Vision Care, Alcon, CooperVision, and Bausch + Lomb collectively hold a commanding share through diversified portfolios and global logistics. These firms funnel cash into silicone-hydrogel process optimization and companion digital platforms that streamline script capture and auto-shipping. Sustainability commitments, such as CooperCompanies’ 2023 ESG roadmap, further differentiate leadership brands.
Second-tier manufacturers—Menicon, HOYA Vision Care, and specialized Asia-Pacific producers—compete via niche lenses like hyper-DK gas-permeables or vivid cosmetic series. Many license material patents or co-develop with academia to bridge R&D gaps. Consolidation persists: Alcon’s USD 81 million Belkin Vision buy fortified its glaucoma toolkit; Bausch + Lomb spent USD 106.5 million on Blink eye drops to cross-sell comfort solutions. Such deals reflect vertical integration plays that bundle lens hardware with ocular-health adjuncts.
Smart contact-lens pioneers partner with electronics and pharma giants to shoulder regulatory heft. Firmware-laden prototypes target intraocular pressure monitoring and glucose sensing but must balance miniaturized power supplies with corneal biocompatibility. Success hinges on co-creating with ophthalmologists to embed devices into routine care pathways rather than framing them as consumer gadgets.
Contact Lenses Industry Leaders
Essilor International SA
Bausch Health
The Cooper Companies Inc
Hoya Corporation
Alcon
- *Disclaimer: Major Players sorted in no particular order
Contact Lenses Market Companies Covered in this Report
- Johnson & Johnson Vision Care (Acuvue)
- Alcon
- The Cooper Companies
- Bausch + Lomb
- Menicon
- HOYA Vision Care
- Carl Zeiss
- EssilorLuxottica
- Seed Co.
- Contamac
- SynergEyes
- STAAR Surgical (EVO ICL contact-lens alternatives)
- Ginko International (Hydron)
- BenQ Materials (Miacare)
- Clearlab
- Optical 88
- Oculus Private Limited (India)
- Interojo
- Shanghai Weicon Optics
- Brighten Optix

Market Opportunities and Future Outlook
Capacity and supply-chain localization is an identifiable whitespace as daily disposables expand and manufacturers aim to secure resilient, high-volume output close to major end markets. Menicon started commercial production at its new Kulim, Kedah, Malaysia facility on 5 February 2026 for silicone hydrogel lenses (Phase 1 capacity of 500 million lenses per year, with a longer-term target of 2 billion), adding large-scale manufacturing capability aligned to the one-day lens mix shift. Johnson & Johnson also announced an investment of more than USD 1 billion (June 2026) to expand Vision manufacturing operations in Jacksonville, Florida, including a new distribution facility and advanced manufacturing and packaging technologies for ACUVUE, reinforcing how manufacturing automation and domestic logistics footprints support competition in high-frequency modalities.
Regulatory traceability and labeling infrastructure is another practical opportunity, especially in Europe where manufacturers must align product identification systems with the Master UDI-DI framework by 9 November 2026 and prepare for mandatory use of Eudamed UDI/device registration from 28 May 2026. Standardizing product master data across large SKU families (base curve, diameter, power, cylinder variants) and integrating UDI and registration workflows into packaging and fulfillment can reduce variant-level administrative friction, support faster EU submissions and updates, and improve recall-readiness as portfolios broaden across toric, multifocal, myopia-control, and therapeutic designs.
Recent Industry Developments in Contact Lenses Market
- June 2026: Johnson & Johnson announced an investment of more than USD 1 billion to expand Vision manufacturing operations in Jacksonville, Florida, including construction of a new distribution facility and installation of advanced manufacturing and packaging technologies for ACUVUE contact lenses. The move strengthens domestic supply and logistics capacity for high-volume soft lenses and supports faster replenishment models across channels. By pairing distribution expansion with manufacturing technology upgrades, it also raises the operational bar for competitors in premium daily disposable segments.
- April 2025: The FDA cleared Bruno Vision’s FusionTechnology lens platform, opening a new manufacturing approach for contact lenses. Clearance supports broader commercialization pathways in the United States and can accelerate adoption by lowering manufacturing friction for advanced designs. It also reinforces the regulatory premium placed on validated process control as lenses evolve toward more complex materials and formats.
- December 2024: Johnson & Johnson invested in TECLens to advance non-incisional corneal-cross-linking solutions aimed at refractive improvement. The investment connects contact lens incumbents with adjacent, lens-enabled refractive and corneal-shaping technologies that can complement myopia management and specialty care pathways. It highlights continued strategic interest in technologies that expand beyond commodity vision correction into higher-value ocular health solutions.


Contact Lenses Market Report Scope and Research Methodology
Market Definition and Coverage
For this methodology, the contact lenses market covers the sales value of lenses used on the eye surface for vision correction and related clinical or aesthetic use, counted across the main purchasing channels and major geographies.
Scope exclusions: We exclude contact lens care solutions and accessories, as well as refractive surgery procedures and eyeglasses.
Segments Covered in This Report
- By Material
- Silicone Hydrogel
- Hydrogel
- Gas-Permeable (RGP)
- Hybrid
- By Design
- Spherical
- Toric
- Multifocal / Progressive
- Cosmetic & Colored
- By Usability / Replacement Modality
- Daily Disposable
- Weekly / Bi-Weekly
- Monthly / Quarterly
- Extended-Wear (≥7 days)
- By Application
- Vision Correction
- Therapeutic (Drug Delivery, Bandage)
- Cosmetic Enhancement
- Prosthetic / Speciality (Ortho-k, Myopia Control)
- By Distribution Channel
- Retail Optical Stores
- Hospitals & Eye Clinics
- Online / E-commerce Platforms
- Geography
- North America
- United States
- Canada
- Mexico
- Europe
- Germany
- United Kingdom
- France
- Italy
- Spain
- Rest of Europe
- Asia-Pacific
- China
- India
- Japan
- South Korea
- Australia
- Rest of Asia-Pacific
- South America
- Brazil
- Argentina
- Rest of South America
- Middle East and Africa
- GCC
- South Africa
- Rest of Middle East and Africa
- North America
Data Sources, Market Sizing, and Validation
Desk Research
Desk research was used to build a clean fact base on vision impairment prevalence, contact lens adoption patterns, and cross-border flows that affect availability and pricing. We relied on public sources such as the World Health Organization, the US CDC, the US FDA, and national statistics and customs portals (to source trade and currency series), and then cross-checked the story with peer-reviewed ophthalmology journals.
To ground the market structure, we also reviewed company annual reports, investor presentations, and announcements from optometry and ophthalmology associations, plus reputable press coverage on new product launches and regulatory changes. Where needed, paid subscriptions were used only for company financial intelligence and patent lookups to confirm product pipelines and ownership changes. The desk sources listed above are illustrative only, and many other public and proprietary references were also used for data collection, validation, and clarification.
Primary Interviews and Surveys
Primary work focused on validating how demand converts from eye exams to active lens wear, and how pricing varies by modality, material, and channel. We spoke with eye care professionals, distributors, and manufacturing-side experts across APAC, EMEA, and the Americas so the regional mix and reimbursement realities could be reflected in the model. These discussions were also used to test assumptions on replacement frequency, drop-out rates, and the speed of the mix shift toward daily disposables.
Distribution of primary research fieldwork respondents
| Company type | Respondent position | Region |
|---|---|---|
| Top tier: 33% | CXOs: 14% | APAC: 38% |
| Mid tier: 50% | Functional/Unit leaders: 33% | EMEA: 37% |
| Smaller Players: 17% | Managers: 53% | Americas: 25% |
Market-Sizing & Forecasting
Sizing started from a top-down reconstruction of the addressable wearer pool by country, where population and vision impairment prevalence are translated into contact lens users using penetration and fitting rates discussed in interviews. That demand pool was then converted into value by applying replacement frequency (pairs per wearer per year) and an average selling price ladder by modality and design, which was further adjusted for channel mix and local currency timing.
To keep totals realistic, the output was corroborated with selective bottom-up approximations such as supplier revenue sanity checks, distributor channel checks, and sampled ASP times volume tests in a few large countries. Key inputs used in the model included daily disposable share shifts, silicone hydrogel adoption, toric and multifocal mix, online share movement, and trade signals for major producing and importing regions. Forecasts were built using scenario analysis supported by a light multivariate regression, where drivers such as aging mix, myopia incidence trends, and premiumization were stress-tested with experts before finalizing the base case. Where gaps appeared in country-level pricing or replacement behavior, conservative mid-points from interview ranges were used and then revalidated against the full regional total.
Data Validation & Update Cycle
Validation was done through several passes, starting with internal consistency checks so volumes, prices, and user counts reconcile cleanly at country, regional, and global levels. We then compared results with independent signals such as import trends, reported category performance in company disclosures, and channel feedback on sell-through versus stock build.
Outliers were flagged when growth or pricing moved outside plausible ranges, and those cases triggered re-checks of assumptions. When required, we arranged a follow-up expert touchpoint to close the gap. Each report goes through a multi-step review before sign-off, followed by an annual refresh cycle with interim updates when a material event changes demand, supply, or regulation. Right before delivery, a final update pass is completed so clients receive the latest view based on the most recent public information.
Mordor Intelligence's Contact Lenses Market Size Versus Other Published Estimates
Published market sizes for contact lenses can look far apart because each estimate is built on a different pricing point in the value chain, a different year for currency conversion, and sometimes a different inclusion of adjacent categories. Even when the product sounds the same, the number can shift once retail margins, professional fitting revenues, or lens care items are added or removed.
A common gap is that some sources present a broad wholesale value that reflects producer and importer revenues and excludes retail margins and service markups. In Mordor Intelligence modeling, only contact lenses are counted, and the value is kept tied to lens revenues across the covered countries without blending in lens care solutions or unrelated vision care services.
Benchmark comparison
| Source | Market Size | Gaps in Research Methodology |
|---|---|---|
| Mordor Intelligence | USD 10.98 B (2026) | |
| Industry Data Publisher A | USD 29.50 B (2024) | Uses a wholesale revenue lens (producer and importer revenues) with stated exclusions for retail margins and retail marketing costs, and it also reflects a different base year and pricing level than a lens-only market value model. |
| Global Research Publisher B | USD 17.34 B (2024) | Carries an earlier base year and a higher growth path, and the page-level scope language is broad, which can lead to wider inclusion choices and less transparent handling of ASP progression and replacement frequency assumptions. |
The comparison shows that the spread is mainly explained by price level (wholesale versus market value), base year timing, and what is included next to the lenses themselves. By keeping the calculation anchored to wearer counts, replacement behavior, and a clear ASP ladder that can be checked back to channel feedback, the estimate stays traceable and repeatable for planning.


Key Questions Answered in the Report
What is the current size of the contact lens market?
The contact lens market size stands at USD 10.98 billion in 2026 and is projected to reach USD 13.12 billion by 2031.
Which material dominates global sales?
Silicone-hydrogel lenses lead the market with 55.12% revenue share because their high oxygen permeability reduces hypoxia-related complications.
Why are daily disposable lenses growing so quickly?
Consumers favor the convenience and hygiene benefits of single-use products, pushing daily disposables to a 4.84% CAGR between 2026 and 2031.
How is myopia prevalence influencing demand?
Rising childhood myopia, especially in Asia, ensures steady demand for corrective and myopia-control lenses, contributing an estimated +1.8% to forecast CAGR.
What role does e-commerce play in lens distribution?
Online and D2C channels are expanding at a 5.55% CAGR as script verification systems mature and subscription deliveries simplify replenishment for habitual wearers.
Page last updated on:




