
India Fleet Management Software Market Size and Share
Market Overview
| Study Period | 2020 - 2031 |
|---|---|
| Forecast Data Period | 2026 - 2031 |
| Base Year Market Size (2025) | USD 1.69 Billion |
| Market Size (2026) | USD 1.91 Billion |
| Market Size (2031) | USD 3.51 Billion |
| Growth Rate (2026 - 2031) | 12.96 % |
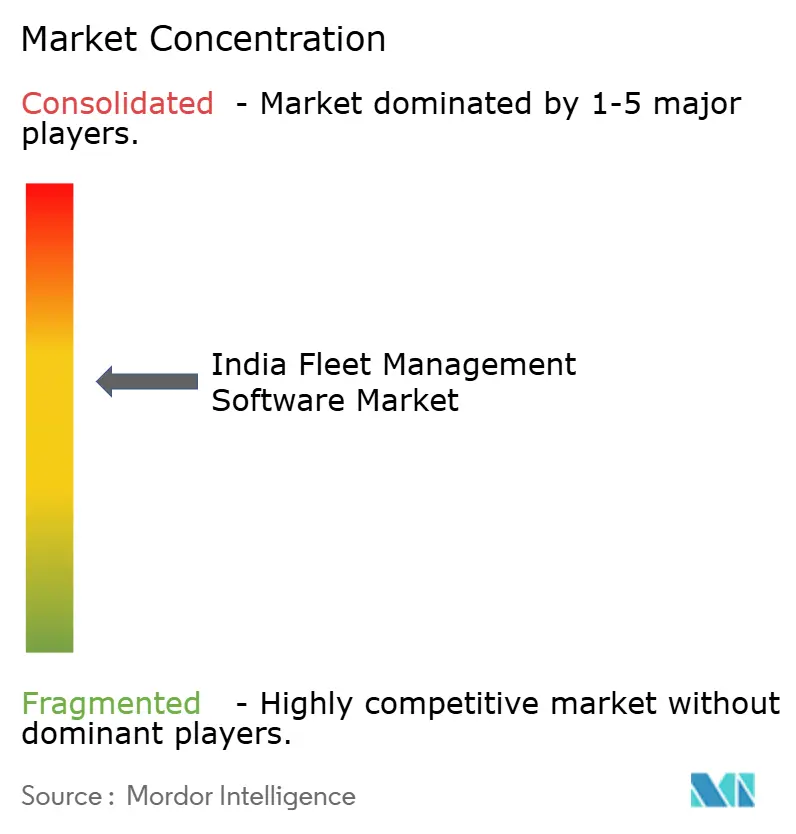
| Market Concentration | Medium |
Major Players *Disclaimer: Major Players sorted in no particular order Image © Mordor Intelligence. Reuse requires attribution under CC BY 4.0. | |
India Fleet Management Software Market Analysis by Mordor Intelligence
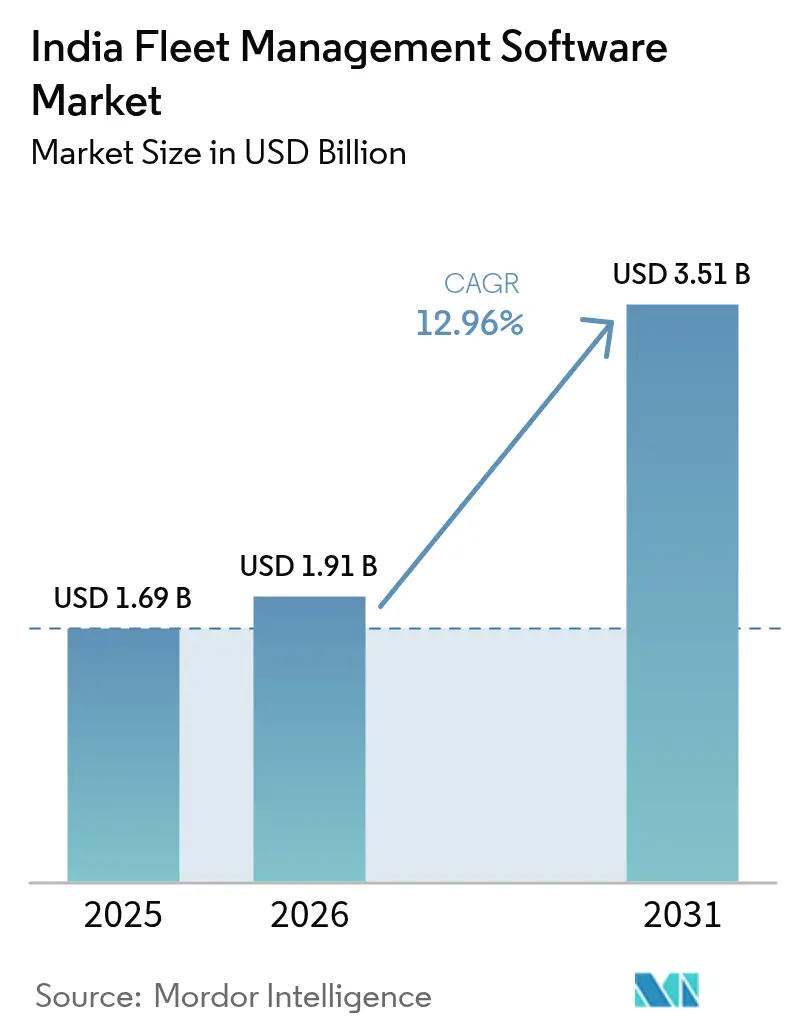
The India fleet management software market size in 2026 is estimated at USD 1.91 billion, growing from 2025 value of USD 1.69 billion with 2031 projections showing USD 3.51 billion, growing at 12.96% CAGR over 2026-2031. Robust expansion is underpinned by mandatory AIS-140 and IS-16833 compliance, volatile fuel economics that elevate total-cost-of-ownership pressure, and the digital push embedded in the National Logistics Policy 2022.[1]MarkLines Co., Ltd., “Government of India BS-VII, ADAS, and Safety Roadmap 2025,” marklines.com Cloud deployment dominates because pay-as-you-go pricing suits highly fragmented trucking ownership, while medium fleets anchor current volume even as large enterprise fleets log the fastest growth. Light commercial vehicles remain the backbone of goods movement, yet two-wheelers are reshaping last-mile economics amid India’s gig-economy surge. Competitive intensity is moderate, with roughly 250 connected-vehicle start-ups complementing global telematics leaders and legacy Indian providers.
Key Report Takeaways
- By deployment, cloud/SaaS captured 69.10% of the India fleet management software market share in 2025 and is expanding at a 13.55% CAGR to 2031.
- By fleet size, medium fleets held 51.10% share of the India fleet management software market size in 2025, while large fleets are projected to grow at 13.78% CAGR through 2031.
- By vehicle type, light commercial vehicles led with 46.20% share of the India fleet management software market in 2025, and two-wheelers are advancing at a 13.92% CAGR to 2031.
- By end-user industry, logistics and transportation accounted for 41.85% of the 2025 revenue of the India fleet management software market; passenger transport is registering the highest 13.84% CAGR to 2031.
- By functionality, tracking and telematics retained 34.35% share of the India fleet management software market in 2025; analytics and reporting is forecast to rise at 14.12% CAGR through 2031.
- By region, South India commanded 36.05% of the 2025 revenue of the India fleet management software market, while West India is on track to post a 14.02% CAGR to 2031.
Note: Market size and forecast figures in this report are generated using Mordor Intelligence’s proprietary estimation framework, updated with the latest available data and insights as of 2026.
India Fleet Management Software Market Trends and Insights
Drivers Impact Analysis*
| Driver | (~) % Impact on CAGR Forecast | Geographic Relevance | Impact Timeline |
|---|---|---|---|
| AIS-140 and IS-16833 compliance mandates | +2.8% | National, with early gains in Delhi, Mumbai, Bangalore | Short term (≤ 2 years) |
| Volatile fuel prices driving Total-Cost-of-Ownership (TCO) reduction | +2.2% | Global, spill-over to rural transport corridors | Medium term (2-4 years) |
| E-commerce and on-demand logistics boom | +2.5% | Urban centers, expanding to Tier-2/3 cities | Medium term (2-4 years) |
| Declining IoT hardware costs and GNSS accuracy gains | +1.8% | National, with stronger adoption in tech-forward regions | Long term (≥ 4 years) |
| OEM data-monetization partnerships with FMS vendors | +1.4% | Manufacturing hubs in Tamil Nadu, Maharashtra, Gujarat | Long term (≥ 4 years) |
| EV fleet electrification and energy-aware routing demand | +1.9% | Metro cities, government fleet corridors | Long term (≥ 4 years) |
| Source: Mordor Intelligence | |||
AIS-140 and IS-16833 Compliance Mandates Drive Market Acceleration
Government directives compel every commercial vehicle to install GPS-enabled tracking devices that transmit real-time data to state transport servers. The mandates extend to panic buttons and driver-behavior monitoring, transforming fleet software from optional optimization to compulsory safety infrastructure. Small and medium operators that historically deferred tech spending now face time-bound compliance, triggering rapid adoption across the India fleet management software market. Vendors that embed over-the-air rule updates gain an edge because regulatory specifications evolve quickly. The compliance surge is also generating retrofit demand among used-truck dealers, broadening the addressable base beyond new-vehicle sales.
Volatile Fuel Prices Catalyze TCO-Focused Digitization
Fuel accounts for 40%–50% of trucking operating costs; recent price swings have eroded razor-thin margins and hastened technology uptake to rein in idling, speeding, and route detours.[2]Eicher Trucks & Buses, “AC Cabins Mandatory for Indian Trucks by 2025,” eichertrucksandbuses.com Fleet software now couples fuel sensors with predictive analytics that benchmark consumption across similar duty cycles, empowering operators to negotiate with drivers and shippers using objective data. Cloud dashboards that aggregate diesel invoices, driver scorecards, and route heatmaps deliver quick ROI, a persuasive narrative for cost-sensitive fleets evaluating subscription outlays.
E-Commerce and On-Demand Logistics Boom Reshapes Fleet Requirements
Same-day delivery expectations oblige fleets to manage unpredictable volumes, multivehicle mixes, and late-night dispatches. Modern platforms, therefore, integrate routing engines that recalculate ETAs every few seconds, chatbots that update customers, and APIs that feed delivery status to e-commerce storefronts.[3]CarDekho, “Charging Infrastructure in India,” cardekho.com Tier-2 and Tier-3 city penetration of online retail magnifies demand for hyperlocal route optimization and two-wheeler fleet orchestration. Driver performance analytics gain prominence because consumer-facing delivery times directly influence seller ratings and repeat sales. Platform scalability becomes a non-negotiable checklist item for procurement heads at large marketplaces.
Declining IoT Hardware Costs Democratize Advanced Telematics
Telematics unit prices have fallen even as sensor payloads expand to include accelerometers, engine diagnostics, and video feeds. Entry-level GPS devices now retail at about INR 175 per month, placing digital tracking within reach of fleets with fewer than five vehicles. The cost curve also unlocks large-scale pilot programs for camera-based driver monitoring that were financially prohibitive two years ago. As IoT affordability converges with rising cellular coverage, software vendors package predictive maintenance alerts and vehicle-health dashboards as standard features, quickening penetration into rural transport corridors and specialized haulage segments such as reefer or tanker fleets.
Restraints Impact Analysis*
| Restraint | (~) % Impact on CAGR Forecast | Geographic Relevance | Impact Timeline |
|---|---|---|---|
| Traditional fleet-operator and driver-union technology resistance | -1.8% | National, stronger in traditional transport hubs | Short term (≤ 2 years) |
| High capex for multi-sensor telematics in SME fleets | -2.1% | Rural and semi-urban fleet operators | Medium term (2-4 years) |
| Rural data-connectivity gaps hindering always-on tracking | -1.4% | Rural transport corridors, North-East regions | Medium term (2-4 years) |
| 2G/3G sunset forcing legacy-device retrofit costs | -0.9% | Pan-India, gradual phase-out timeline | Long term (≥ 4 years) |
| Source: Mordor Intelligence | |||
Traditional Operator and Union Resistance Limits Early Uptake
Long-haul drivers often equate telematics with surveillance, and small-fleet owners view app-based freight platforms as threats to decades-old broker ties.[4]Intugine Technologies, “Leveraging Tracking Data in Supply Chain,” intugine.com The skepticism is amplified by an acute driver shortage that pushes employers to prioritize retention over strict monitoring. Successful vendors reframe software as a welfare enabler offering SOS alerts, salary advances, and in-cab infotainment to shift the narrative from control to empowerment. State-level awareness campaigns by transport departments are gradually softening resistance, but cultural change remains a multi-year journey.
High Capex for Multi-Sensor Telematics Constrains SMEs
While basic tracking is affordable, full-stack telematics covering video, tire pressure, and ADAS can cost upwards of INR 12,000 per vehicle, a hurdle for fleets running fewer than twenty trucks. Financing schemes tied to OEMs and non-bank lenders have begun to gain traction, yet penetration remains uneven. Temperature-controlled trucking and hazardous goods transport suffer the most because regulations mandate extra sensors, inflating capital outlays further. Vendor innovation in plug-and-play hardware and per-trip billing models is critical to closing the affordability gap.
*Our forecasts treat driver/restraint impacts as directional, not additive. The impact forecasts reflect baseline growth, mix effects, and variable interactions.
Segment Analysis
By Deployment: Cloud Dominance Accelerates Digital Adoption
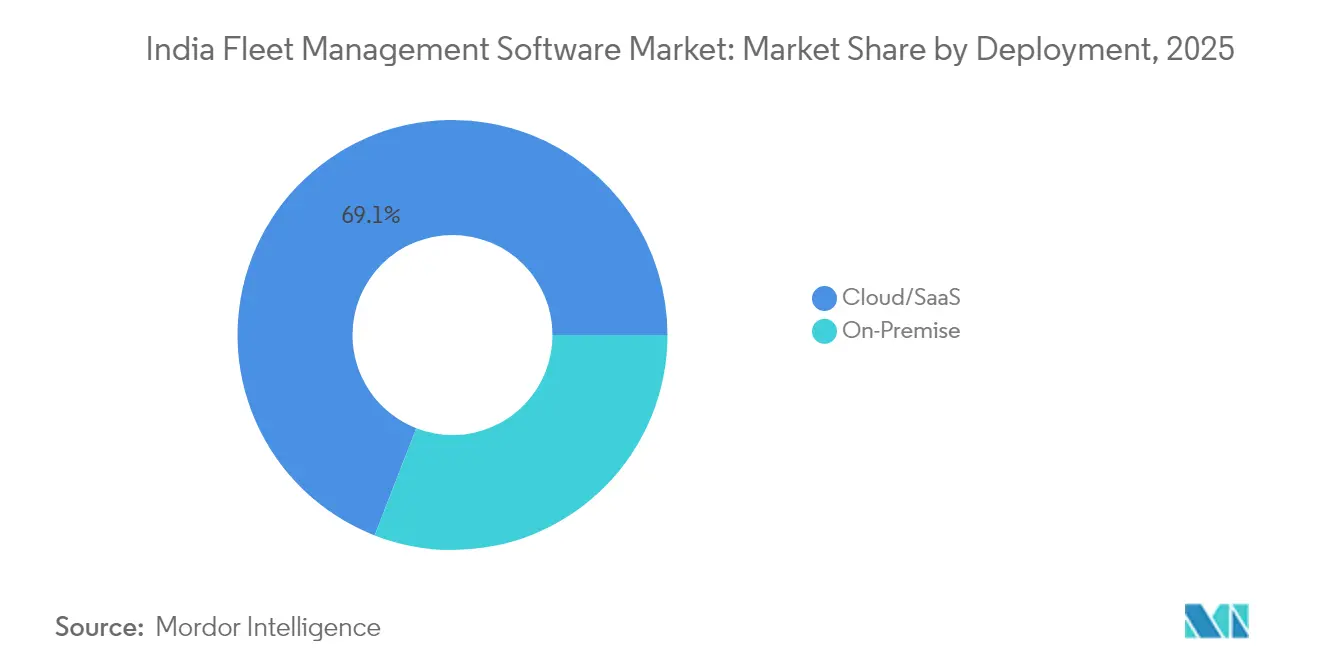
Cloud solutions claimed 69.10% of 2025 revenue, translating to the largest India fleet management software market share within the deployment spectrum. Cloud platforms minimize upfront investment, a decisive factor for India’s 80% small-operator landscape. Pay-per-vehicle subscriptions, automatic over-the-air updates, and API-based integrations allow fleets to scale features without new servers. Over the next five years, this flexibility fuels a 13.55% CAGR, the fastest of any deployment mode.
On-premise installations remain relevant for large enterprises and public agencies requiring data residency or custom workflow logic. However, they lag in innovation velocity because each regulatory or feature update demands on-site patches. Amid the surge in electric vehicles and driver-scorecard analytics, cloud vendors push weekly releases, widening the functionality gap. Combined with India’s improving 4G and 5G coverage, cloud subscription is expected to maintain its commanding India fleet management software market size leadership.



By Fleet Size: Medium Fleets Lead While Large Enterprises Drive Growth
Medium fleets accounted for 51.10% of 2025 spending, reflecting the abundance of carriers that own 20–100 vehicles. Their operational complexity is high enough to warrant digitization but still agile enough to experiment with new vendors. These operators typically begin with tracking and upgrade to route optimization and maintenance modules within twelve months, driving sticky monthly recurring revenue.
Large fleets above 100 vehicles posted the highest 13.78% CAGR and are pivotal to forecasts of the India fleet management software market. Consolidation in e-commerce logistics and organized 3PLs produces mega-fleets that require real-time dashboards, driver engagement apps, and enterprise resource planning integration. Small fleets under twenty vehicles trail in adoption because owners tend to calculate payback in weeks, not months. Freemium mobile-first offerings remain the entry gateway for this cohort.
By Vehicle Type: LCV Dominance Meets Two-Wheeler Disruption
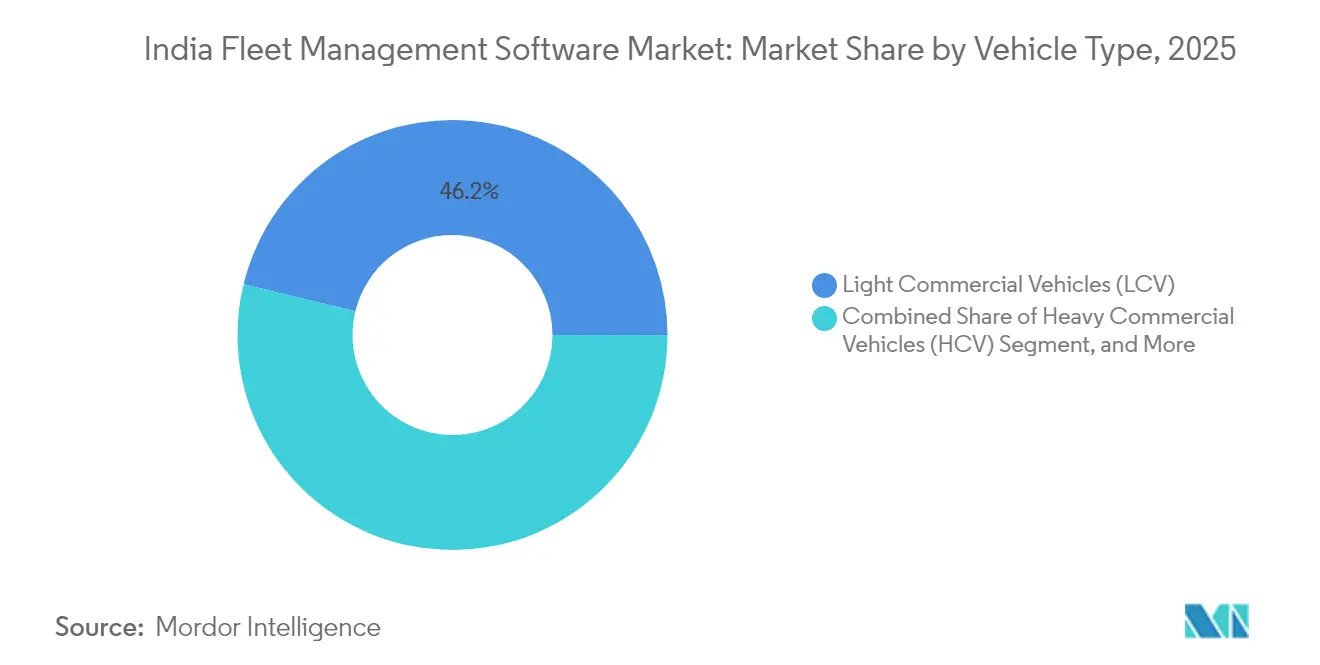
Light commercial vehicles held 46.20% revenue in 2025, reinforcing their centrality to intercity and regional freight movement. Aggregators favor LCVs because they balance payload and maneuverability along India’s diverse road network. Heavy commercial vehicles dominate long haul, but upgrade cycles are slower, dampening software wallet share.
Two-wheelers achieved the fastest 13.92% CAGR thanks to food delivery, quick commerce, and hyperlocal courier services that thrive on motorcycles and e-scooters. Telematics hardware for motorcycles is inexpensive, and installation takes minutes, enabling fleet roll-outs of thousands of riders in a single week. Electric variants further boost telematics demand because operators crave battery state-of-charge and swap-station location intelligence.
By End-User Industry: Logistics Leadership with Passenger Transport Acceleration
Logistics and transportation companies generated 41.85% of 2025 revenue, cementing their status as the anchor vertical within the India fleet management software industry. Route density, stringent service-level agreements, and fuel cost volatility force continuous optimization, sustaining software investment pipelines.
Passenger transport covering school buses, state road transport corporations, and ride-hailing fleets is growing at a 13.84% CAGR. AIS-140 mandates and rising consumer safety expectations propel real-time monitoring, panic-button integration, and driver-attendance logging. Manufacturing, utilities, and waste management collectively form a steady mid-tier that values compliance reporting and uptime analytics for specialized equipment.
By Functionality: Tracking Foundation Enables Analytics Innovation
Tracking and telematics occupied 34.35% of 2025 spend, reaffirming that “know-where-my-vehicle-is” remains the baseline pain point in the India fleet management software market. Once tracking is installed, fleets typically add maintenance, compliance, and fuel modules within a year, but analytics and reporting already show a brisk 14.12% CAGR.
Analytics dashboards mine historical trip data to forecast part failures, benchmark driver behavior, and optimize load scheduling. A surge in EV adoption further inflates demand for energy-management layers that harmonize battery usage with route length and charger availability. As enterprise customers demand single-pane-of-glass visibility, vendors bundle business-intelligence widgets and no-code report builders to outflank rivals.
Geography Analysis
South India contributed 36.05% of 2025 revenue, reflecting its dense concentration of technology adopters in Bengaluru, Chennai, and Hyderabad. Automotive OEM plants and supply clusters in Tamil Nadu and Karnataka amplify demand for real-time transport visibility, making the region an early test bed for ADAS-ready telematics.
West India, anchored by Mumbai’s finance hub and Gujarat’s industrial corridors, is projected to record the highest 14.02% CAGR through 2031. State EV incentives and the Western Dedicated Freight Corridor strengthen the business case for cloud-connected fleets equipped with energy-aware routing. Tier-2 cities such as Pune and Surat are emerging pockets of software pilots aimed at factory-to-port logistics. North India, led by Delhi NCR, sustains sizable procurement volumes driven by government fleet upgrades and interstate warehousing networks. Central India benefits from its crossroads geography and mining activity, adopting telematics for asset security along remote haul roads. East and North-East India remain nascent but receive a tailwind from the BharatNet broadband rollout and public-sector bus modernizations. Gradual 5G expansion is expected to narrow regional penetration gaps across the India fleet management software market.
Regulatory Landscape
India's fleet management software demand is closely linked to MoRTH-led safety and tracking compliance. AIS-140 for Vehicle Location Tracking Devices (VLTDs) and associated backend systems sit within the Motor Vehicles Act, 1988 framework. In practice, compliance is increasingly operationalized through digital workflows connected to Parivahan platforms such as Vahan, where AIS-140 compliant tracking devices and emergency buttons become prerequisites in processes including fitness certification, keeping tracking, safety, and audit-trail modules central to procurement.
The regulatory perimeter extends beyond location tracking into licensing, telecom requirements, and data governance. The Motor Vehicle Aggregator Guidelines 2025 introduce new obligations on aggregators under state licensing (Section 93), including fleet management-related provisions. The Telecommunication Engineering Centre (TEC) also issued a draft revision of Essential Requirements for Tracking Devices on 17 October 2025, pushing vendors and device ecosystems toward updated conformance. On the data side, MoRTH's National Transport Repository data-sharing policy ties access and use of transport data to compliance with the Digital Personal Data Protection Act, 2023, and ARAI continues to publish updated AIS-140 approval lists (updated as of 29 January 2026), supporting interoperability and approved-system selection in tenders.
Value Chain Analysis
The value chain covers telematics and sensor hardware (AIS-140/ITS-compliant VLTDs, cameras, fuel sensors), connectivity (cellular IoT and SIM provisioning), mapping and routing data, and fleet management software delivered mainly as cloud/SaaS with mobile apps and APIs. Providers range from global telematics and fleet software players (Trimble, Samsara, Geotab) to Indian vendors such as LocoNav, fleetx, TrackoBit, Uffizio, Axestrack, and Mappls (MapmyIndia). Systems are typically bundled through OEM or aftermarket installers, channel partners, and fleet aggregators that manage device fitment and support on the ground.
Downstream, fleet operators (logistics and transportation, passenger transport, manufacturing and industrial, and other corporate fleets) purchase solutions via subscriptions, device-plus-software bundles, or multi-year contracts that include compliance reporting and integration into enterprise systems. National digitization programs shape integration layers and data flows, with the National Logistics Policy's ULIP encouraging standardized, API-led interoperability across logistics stakeholders. Electrification and retrofit cycles also pull in adjacent participants, including charging and energy-management software, while PM E-DRIVE (01 Oct 2024 to 31 Mar 2026) incentives for e-trucks increase demand for software to manage mixed fleets and track incentive-linked compliance artifacts such as scrappage requirements.
Competitive Landscape
The India fleet management software market features a moderately concentrated field where the top five providers account for roughly 45% of 2024 revenue. Global brands such as Trimble, Samsara, and Geotab leverage enterprise relationships and hardware ecosystems to win large multi-state contracts. Indigenous players LocoNav, FleetX, TrackoBit, Uffizio, and Axestrack compete aggressively on localization, vernacular mobile-app interfaces, and sub-USD 3 per-vehicle monthly pricing tiers.
Differentiation is increasingly vertical. FleetX offers cold-chain compliance dashboards, whereas TrackoBit caters to on-demand delivery fleets with two-wheeler-specific telematics devices. Hardware-agnostic SaaS models coexist with end-to-end packages bundling sensors and SIMs, enabling customers to mix and match based on capex appetite. OEM tie-ups are pivotal: Tata Motors’ Fleet Edge now connects half a million vehicles, and VE Commercial Vehicles embeds IoT gateways on AC-ready truck cabins scheduled for production in late 2025.
Pricing flexibility and rapid regulatory updates decide tender outcomes in government bus, school transport, and mining concessions, where AIS-140 audit trails are scrutinized monthly. As fleets electrify, vendors scramble to add charger-management APIs and battery-health analytics, opening a white-space arena where start-ups like Griden Technologies integrate chargers, telematics, and payment gateways.
India Fleet Management Software Industry Leaders
Trimble Mobility Solutions India Private Limited
BT TechLabs Private Limited (LocoNav)
fleetx Technologies Private Limited
Uffizio India Software Consultants Private Limited
Web World Digital Solutions Private Limited (TrackoBit)
- *Disclaimer: Major Players sorted in no particular order

Market Opportunities and Future Outlook
Platform interoperability and API-first data exchange are emerging as a differentiator as government and infrastructure platforms scale digital transaction volumes. ULIP's reported 100 crore API transactions (March 2025) supports workflows where fleet management software connects with shippers, warehousing, and public digital rails, which creates room for vendors to provide pre-built connectors, unified exception management, and audit-ready reporting across multi-party logistics.
Road-tolling and fleet renewal programs are also expanding software needs beyond basic tracking. NHAI's barrier-less Multi-Lane Free Flow (MLFF) tolling pilots (May 2026, including Manoharpur and Hyderabad) introduce operating patterns that place value on accurate vehicle identity, trip attribution, and reconciliation with toll and route data. This supports opportunities in FASTag/ANPR-linked analytics, dispute management, and cost allocation by route and customer. At the same time, policy programs including DPIIT's BHAVYA guidelines (May 2026) for plug-and-play industrial parks and MoHUA's Parivartan operational guidelines for NCR vehicle replacement (July 2026) broaden demand for compliance-led fleet modernization toolkits. These toolkits include EV energy routing, utilization reporting, and standardized safety workflows aligned to mandated tracking requirements.
Recent Industry Developments
- March 2026: fleetx partnered with AbhiBus (ixigo) to deploy video telematics and driver safety capabilities across AbhiBus's bus operator network. The move deepens fleetx's presence in passenger transport use cases where safety, monitoring, and compliance reporting are core buying criteria. It also increases competitive pressure on vendors that focus mainly on basic GPS tracking by elevating video and analytics as baseline requirements for large networks.
- October 2025: Sensorise acquired LocoNav's India fleet management business, including its customer base and active device subscriptions, and announced the Eagle AI positioning around smarter and safer fleets. The transaction points to consolidation among Indian fleet-tech providers as scale, device footprint, and data volumes become central to product velocity and enterprise sales. It also shifts competitive dynamics for mid-market fleets that historically adopted LocoNav through bundled hardware and subscription plans.
- May 2025: fleetx raised INR 113 crore in a Series C round led by IndiaMART Intermesh Ltd and BEENEXT's Accelerate Fund. The funding supported product capability expansion and enterprise go-to-market efforts, reinforcing the shift toward higher-value modules such as automation, analytics, and safety tooling. It also raised intensity in the mid-to-large fleet segment, where vendors compete on breadth of platform and integration depth.


Research Methodology Framework and Report Scope
Market Definition and Coverage
For this methodology, the market counts software used by fleet operators in India to monitor, manage, and optimize vehicles and drivers, including core modules such as tracking, routing, maintenance, compliance, and analytics, across commercial and passenger fleets.
Scope exclusions: We exclude pure hardware-only sales (devices and sensors), telecom connectivity charges, and standalone maintenance service labor that is not packaged as software revenue.
Segmentation Overview
- By Deployment
- On-Premise
- Cloud/SaaS
- By Fleet Size
- Small (<20 vehicles)
- Medium (20–100)
- Large (>100)
- By Vehicle Type
- Light Commercial Vehicles (LCV)
- Heavy Commercial Vehicles (HCV)
- Passenger Cars
- Two-Wheelers
- By End-User Industry
- Logistics and Transportation
- Manufacturing and Industrial
- Passenger Transport (Bus, Taxi, School)
- Other End-User Industries (Corporate, Utilities, Waste Management)
- By Functionality / Module
- Tracking and Telematics
- Route Optimisation and Navigation
- Maintenance and Diagnostics
- Compliance and Safety
- Fuel and Energy Management
- Analytics and Reporting
- By Region
- North India
- West India
- South India
- East and North-East India
- Central India
Data Sources, Market Sizing, and Validation
Desk Research
Desk work started with mapping the demand pool in India and the rules that shape adoption, then aligning it with what suppliers can realistically sell. We leaned on public sources such as the Ministry of Road Transport and Highways for transport indicators, National Logistics Policy documents, the Bureau of Indian Standards and related notifications tied to AIS-140 and IS-16833, and national statistics releases (for example, from the Ministry of Statistics and Programme Implementation) that help frame fleet activity.
To keep assumptions grounded, we also used supporting sources such as trade bodies covering road transport and logistics, peer-reviewed journals and conference papers on telematics and fleet digitization, and reputable press and company investor materials to understand pricing models and module adoption. Where supplier revenue splits were not fully visible, our team used paid subscriptions for company financials and news screening, and selectively checked patent databases to see where product investment was moving. The desk sources listed above are illustrative, and many other public references were also used for data collection, cross-checks, and clarification.
Primary Interviews and Surveys
Primary inputs came from interviews and structured surveys with software providers, channel partners, and fleet operators across logistics, manufacturing-linked fleets, and passenger transport, so assumptions could be checked against how buying and renewal actually happen. We also discussed differences by fleet size and vehicle category, because pricing, feature bundles, and rollout speeds tend to change as fleets move from small to medium and large deployments.
Distribution of primary research fieldwork respondents
| Company type | Respondent position |
|---|---|
| Top tier: 36% | CXOs: 13% |
| Mid tier: 44% | Functional/Unit leaders: 43% |
| Smaller Players: 20% | Managers: 44% |
Market-Sizing & Forecasting
The sizing starts with a top-down demand pool build using India fleet digitization signals, then translates that into software spend using adoption and pricing logic by fleet type. We anchored the model on indicators such as the active commercial vehicle base, freight activity direction, compliance-led telematics rollout, cloud versus on-premise preference, and typical module attach rates for tracking, route optimization, maintenance, and safety.
Results were then corroborated with selective bottom-up approximations, such as sampling average subscription pricing by fleet size and module bundle, and cross-checking supplier disclosures on India exposure where available. When bottom-up detail was missing for smaller suppliers, gaps were handled by using ranges from channel checks, then tightening those ranges through interview feedback on win rates and typical contract sizes.
For forecasting, we relied mainly on scenario analysis with a base case that links growth to logistics expansion, compliance timelines, and SaaS penetration, then stress-tested it with slower and faster adoption paths. Assumptions for price progression were kept practical by using renewal behavior, discounting patterns, and module upsell rates discussed by operators and implementation teams.
Data Validation & Update Cycle
Model outputs were checked against independent signals, including implied software spend per connected vehicle and the realism of adoption curves across small, medium, and large fleets. Outliers were investigated through variance checks by module and by end-user group, and any large step-changes triggered a re-check of inputs and, where needed, a follow-up discussion with a relevant respondent.
Before sign-off, the work goes through multi-step analyst review so assumptions, math, and narrative stay consistent. The report is refreshed annually, and interim updates are made when material events occur, such as a meaningful regulation shift, pricing changes in common SaaS plans, or a clear demand shock. Right before delivery, a final pass is completed so clients receive the latest updated view.
Mordor Intelligence's India Fleet Management Software Market Estimate Compared With Other Published Estimates
Published market sizes for India fleet management software can differ because each publisher chooses its own scope for what counts as software revenue, then applies different assumptions for adoption speed and subscription pricing. Timing also matters, since exchange rates, base-year selection, and whether renewals are treated like expansion can shift the reported value.
The biggest gap drivers in this market usually come from whether telematics device revenue and connectivity fees are blended into the total, and whether passenger mobility fleets and two-wheelers are included at the same depth as commercial logistics fleets. Differences also show up when one estimate assumes a faster shift to cloud subscriptions with higher module bundling, and another holds pricing flatter and uses conservative penetration for medium fleets.
Benchmark comparison
| Source | Market Size | Gaps in Research Methodology |
|---|---|---|
| Mordor Intelligence | USD 1.69 B (2025) | |
| Regional Consultancy A | USD 1.50 B (2024) | Uses an earlier base year and keeps SaaS price progression flatter, and it also appears to undercount analytics and compliance modules sold as add-ons. |
| Industry Portal B | USD 2.30 B (2024) | Likely blends software with adjacent telematics hardware and tracking device revenue, and it applies higher implied spend per vehicle without clear checks on renewals and discounting. |
The spread in the table is mainly explained by what gets counted as software versus bundled device and connectivity revenues, and by how quickly cloud subscriptions are assumed to expand across medium fleets. By keeping the total tied to module-level adoption, compliance-led rollout timing, and realistic renewal behavior for India fleets, the number stays traceable to repeatable inputs, which is how it is handled at Mordor Intelligence.


Key Questions Answered in the Report
What is the 2026 value of the India fleet management software market?
It stands at USD 1.91 billion, with a forecast to reach USD 3.51 billion by 2031.
Which deployment mode shows the strongest growth?
Cloud/SaaS, expanding at a 13.55% CAGR as fleets favor low-capex, scalable solutions.
How fast is the two-wheeler telematics segment expanding?
It is registering a 13.92% CAGR through 2031, the fastest among all vehicle categories.
Which region outpaces others in growth?
West India leads with a projected 14.02% CAGR thanks to industrialization and EV incentives.
Why are compliance mandates crucial for adoption?
AIS-140 and IS-16833 make GPS tracking and safety features compulsory, accelerating technology uptake across all fleet sizes.
What functionality is growing quickest beyond basic tracking?
Analytics and reporting, forecast to rise at 14.12% CAGR as fleets seek data-driven optimization.
Page last updated on:


 Your data is secure and never sold or shared.


