
Compound Management Market Size and Share
Market Overview
| Study Period | 2020 - 2031 |
|---|---|
| Market Size (2026) | USD 0.54 Billion |
| Market Size (2031) | USD 1.08 Billion |
| Growth Rate (2026 - 2031) | 14.87 % |
| Fastest Growing Market | Asia Pacific |
| Largest Market | North America |
| Market Concentration | Medium |
Major Players *Disclaimer: Major Players sorted in no particular order Image © Mordor Intelligence. Reuse requires attribution under CC BY 4.0. | |
Compound Management Market Analysis by Mordor Intelligence
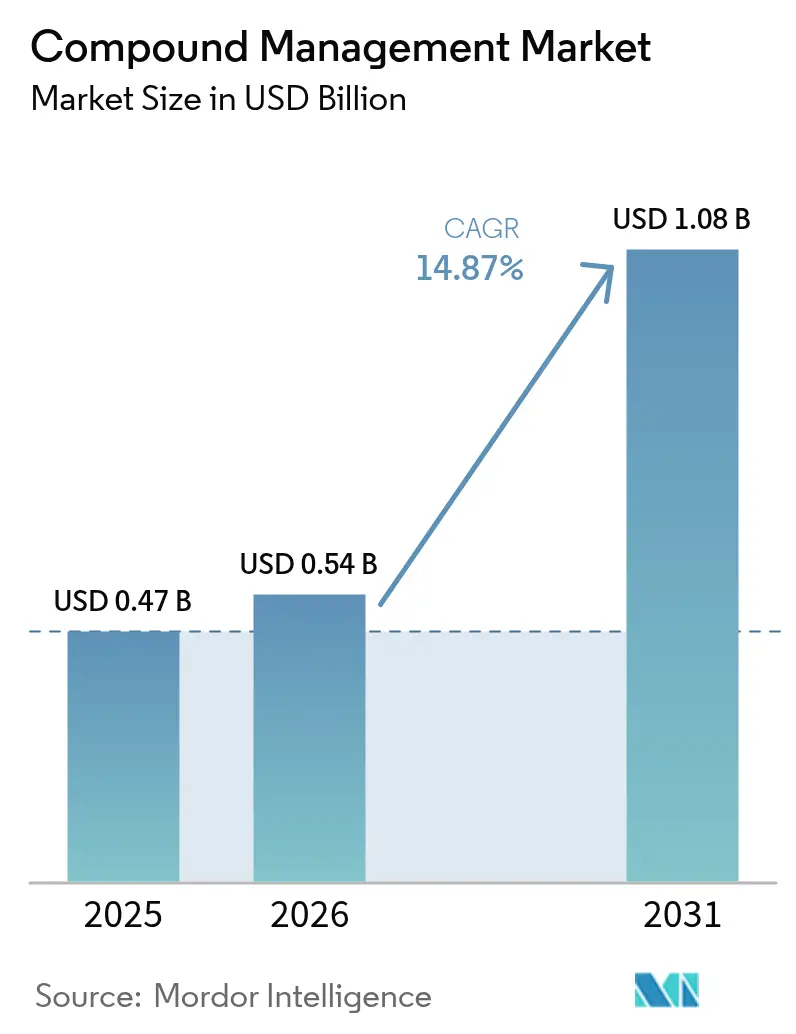
The compound management market size is projected to be USD 0.47 billion in 2025, USD 0.54 billion in 2026, and reach USD 1.08 billion by 2031, growing at a CAGR of 14.87% from 2026 to 2031. Robust expansion reflects pharmaceutical and biotech companies’ push to shorten discovery cycles by outsourcing physical libraries, adopting AI-enabled high-content screening, and automating cold-chain logistics. Suppliers that combine robotic freezers with imaging analytics are securing long-term framework agreements, while venture investors channel more than USD 150 million into start-ups that promise modular, software-defined infrastructure. Regulatory updates—such as the FDA’s tighter temperature-excursion guidance and the European Union’s revised data requirements—are turning compliance into a buying trigger, accelerating the replacement of manual systems with audit-ready platforms. At the same time, ESG commitments are steering buyers toward energy-efficient freezers and pay-per-vial storage models that lower Scope 1 and 2 emissions. Moderate concentration among the top five vendors leaves space for niche players in enzymatic DNA synthesis, microfluidics, and low-carbon storage.
Key Report Takeaways
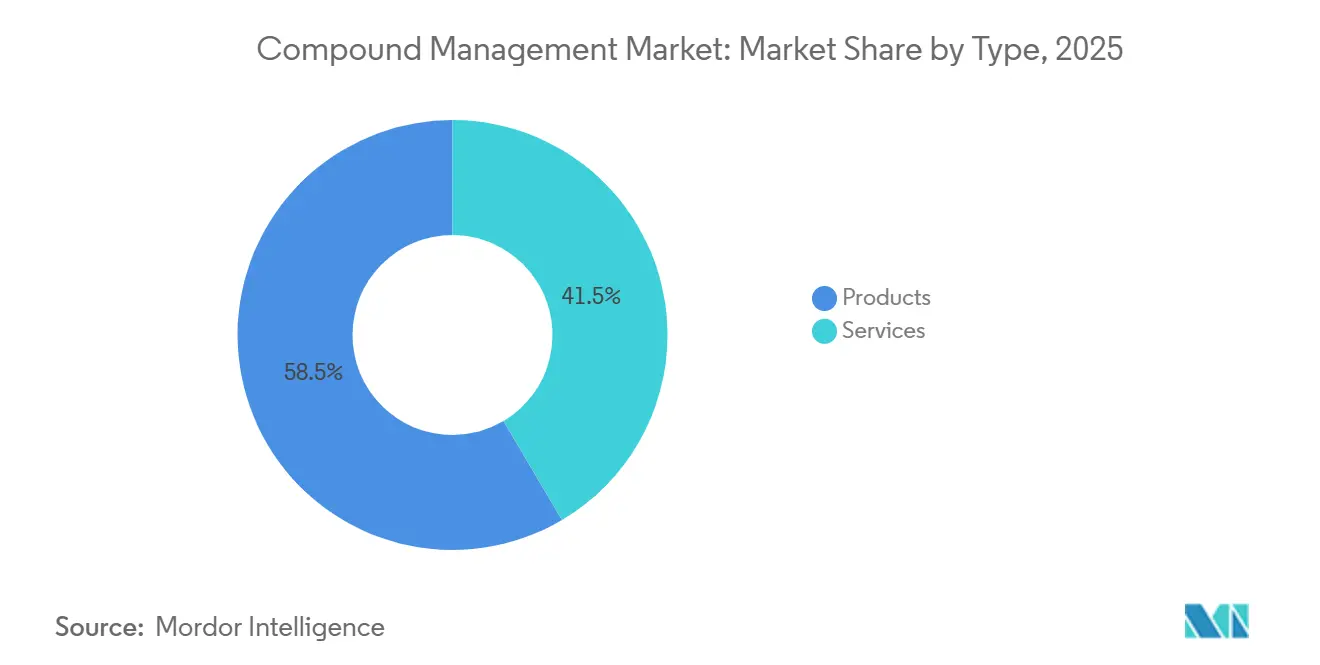
- By type, products led with 58.55% revenue share in 2025; services are forecast to advance at a 16.25% CAGR through 2031.
- By sample type, chemical compounds accounted for 52.53% of the compound management market share in 2025, while biosamples are set to expand at a 17.75% CAGR to 2031.
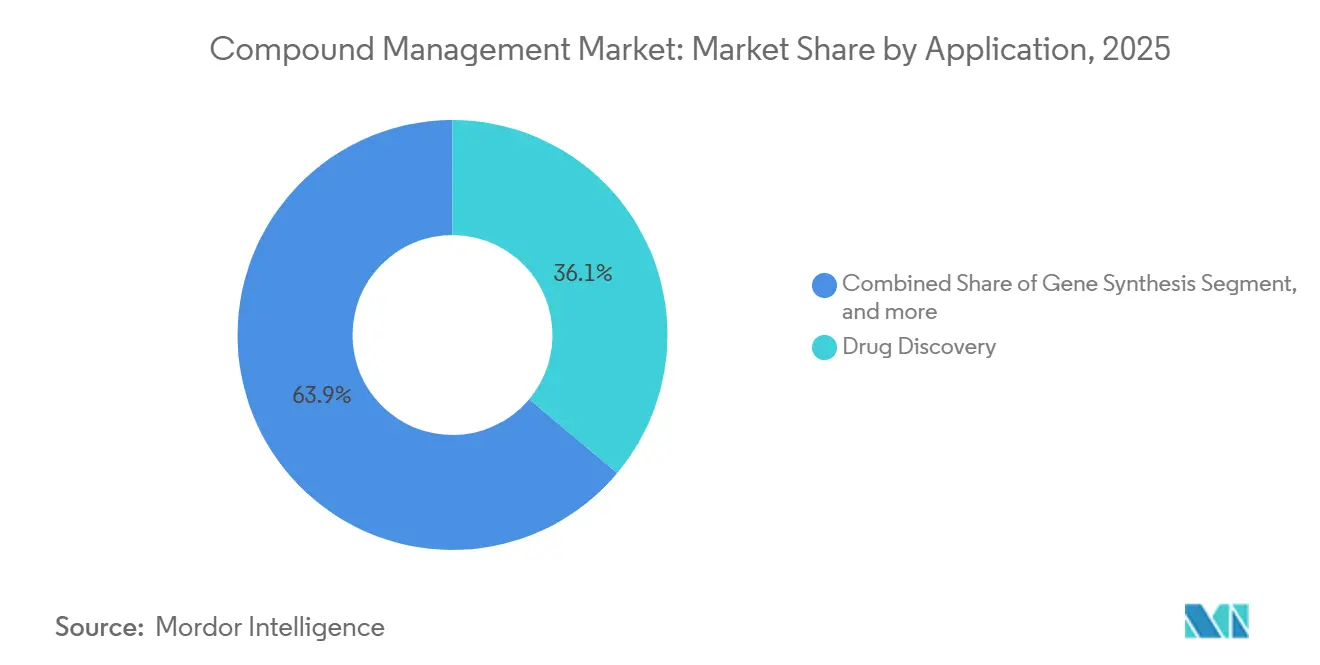
- By application, drug discovery captured 36.15% of 2025 revenue; biobanking is projected to grow at a 17.82% CAGR through 2031.
- By end user, pharmaceutical companies contributed 35.65% of 2025 sales, whereas contract research organizations are poised for a 15.32% CAGR by 2031.
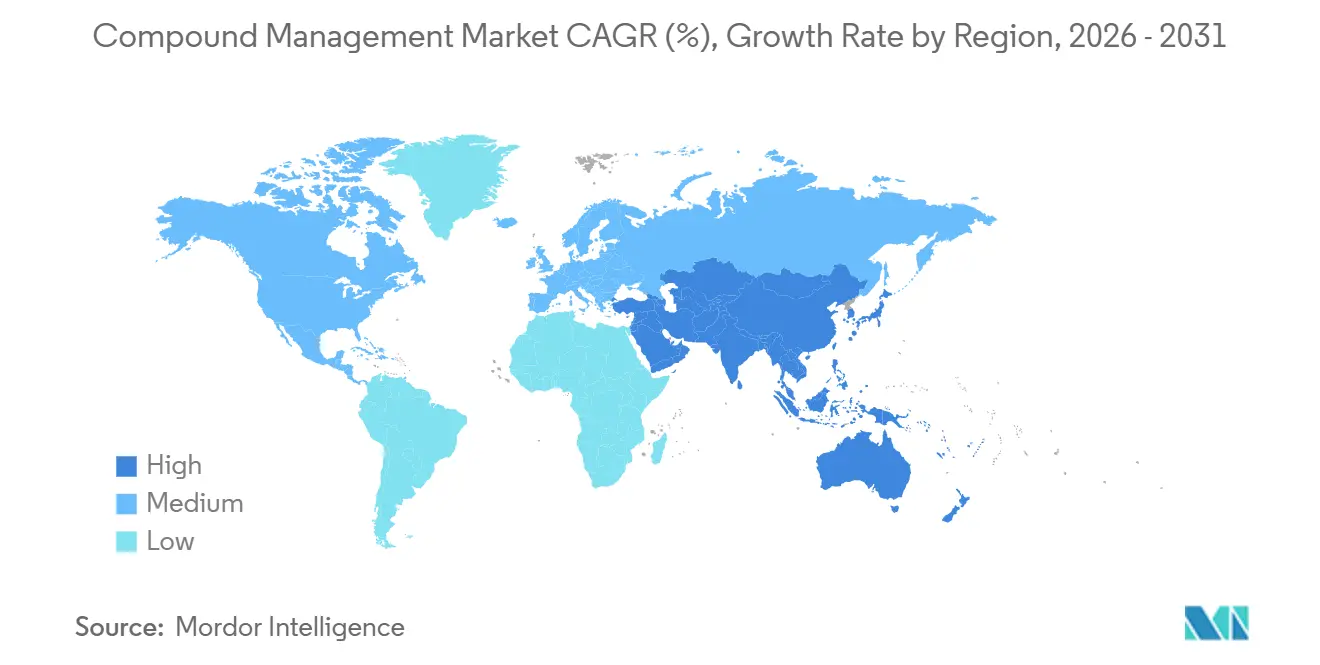
- By geography, North America held 38.23% in 2025, and Asia-Pacific is expected to post the fastest 16.42% CAGR during 2026-2031.
Note: Market size and forecast figures in this report are generated using Mordor Intelligence’s proprietary estimation framework, updated with the latest available data and insights as of 2026.
Market Trends and Insights
Drivers Impact Analysis of Compound Management Market*
| Driver | (~) % Impact on CAGR Forecast | Geographic Relevance | Impact Timeline |
|---|---|---|---|
| Expanding AI-enabled high-content screening platforms | +3.2% | Global, North America & Europe | Medium term (2-4 years) |
| Surging biologics & cell-/gene-therapy pipelines | +4.1% | Global, led by North America, rising in Asia-Pacific | Long term (≥ 4 years) |
| Outsourcing of sample libraries to specialized biorepositories | +2.8% | North America & Europe core, Asia-Pacific emerging | Medium term (2-4 years) |
| Cold-chain automation mandates in regulated markets | +2.3% | North America & EU, spillover to Asia-Pacific | Short term (≤ 2 years) |
| Venture-capital inflows into robotic infrastructure | +1.9% | North America primary, Europe secondary | Short term (≤ 2 years) |
| ESG-driven decarbonized laboratory operations | +1.4% | Europe & North America, early in Asia-Pacific | Long term (≥ 4 years) |
| Source: Mordor Intelligence | |||
Expanding AI-Enabled High-Content Screening Platforms
Advanced imaging systems that embed machine-learning models now cut hit-to-lead timelines by up to 40%, fueling demand for robotic freezers that can deliver 384-well plates within minutes. Molecular Devices’ ImageXpress HCS.ai, introduced in 2024, enabled an oncology screen of 1.2 million compounds in six weeks. ZEISS followed with the arivis Cloud in 2025, linking 3-D analytics to compound databases via RESTful APIs for real-time structure-activity insights[1]ZEISS, “arivis Cloud Announcement,” zeiss.com. Open-source pipelines such as PhenoProfiler validate AI triage by predicting bioactivity with 82% accuracy, halving reagent consumption. Start-ups like Automata integrate schedulers that reduce manual transfers by 70%. Together these advances redirect spending from static storage toward integrated discovery suites.
Surging Biologics & Cell-/Gene-Therapy Pipelines
The American Society of Gene and Cell Therapy counted 4,418 active programs in Q1 2025, up 12% year on year[2]American Society of Gene and Cell Therapy, “Q1 2025 Landscape,” asgct.org. Cryogenic precision is critical: WuXi Biologics added three automated vial-thaw suites in 2024 to curb contamination during master-cell-bank expansion. Evotec’s EUR 15 million partnership with Halozyme targets high-concentration biologics that demand inert storage conditions. Novartis collaborates with Isomorphic Labs to rapidly archive thousands of AI-designed antibody sequences. Rising construct volumes therefore elevate the need for scalable, barcode-driven compound management market solutions.
Outsourcing of Sample Libraries to Specialized Biorepositories
Sponsors increasingly transfer stewardship to third-party facilities to convert capex into service fees. BioAscent invested EUR 20 million in its Edinburgh hub in 2024, adding 12 million vial positions and four-hour turnaround. Charles River manages 1.4 million unique compounds across three continents with FDA-compliant chain-of-custody. Syngene’s Bangalore biorepository provides 40% cheaper storage than North American peers. Azenta secured contracts from four top-20 pharma companies using its BioStore III automated freezers. This bifurcation lets sponsors retain core chemistry while outsourcing archiving and plate reformatting.
Cold-Chain Automation Mandates in Regulated Markets
Regulators now insist on continuous monitoring and electronic audit trails. The FDA’s January 2025 guidance fixes deviation thresholds at ±2°C, beyond manual log capabilities. The EU’s Annex 11 revision, effective June 2025, extends similar controls to computerized systems. Vendors respond with sensor-rich incubators like LiCONiC’s STX series that stream data every 30 seconds. SPT Labtech’s RFID-enabled arktic units cut temperature spikes 85%. Mandatory validation is therefore accelerating upgrades across the compound management market.
Restraints Impact Analysis of Compound Management Market*
| Restraint | (~) % Impact on CAGR Forecast | Geographic Relevance | Impact Timeline |
|---|---|---|---|
| High CapEx for −80°C & LN₂ automated stores | −1.8% | Global, acute in emerging markets | Short term (≤ 2 years) |
| Data-integrity & cybersecurity exposure of cloud LIMS | −1.3% | North America & Europe primary, Asia-Pacific secondary | Medium term (2-4 years) |
| Shortage of compound-management skillsets | −0.9% | Asia-Pacific, Middle East, South America | Long term (≥ 4 years) |
| Volatile supply of lab-grade CO₂/N₂ | −0.7% | Global, episodic regional shortages | Short term (≤ 2 years) |
| Source: Mordor Intelligence | |||
High CapEx for −80°C & LN₂ Automated Stores
Fully robotic cryogenic systems cost USD 1.5–3 million each, a hurdle for CROs with revenue below USD 50 million. Azenta’s BioStore III lists near USD 2.5 million before validation, while Brooks’ legacy SampleStore demands clean-room retrofits adding 30–40% to project totals. Six-tank LN₂ arrays can push redundancy budgets beyond USD 2 million[3]Nexus Cryogenic Solutions, “Pricing Guide 2024,” nexuscryo.com . Lease-to-own models from Heraeus offer relief yet struggle for uptake because sponsors want ownership over IP-sensitive libraries. Capital intensity therefore concentrates demand among cash-rich enterprises.
Data-Integrity & Cybersecurity Exposure of Cloud LIMS
A 2025 survey found 38% of IT managers cite ransomware fears as the top barrier to cloud migration. Annex 11 now obliges cloud systems to maintain audit trails and role-based controls, increasing compliance spend for small vendors. Titian’s Mosaic 2025 brings end-to-end encryption and MFA, but roll-out requires staff versed in GxP and cybersecurity, scarce in developing regions. FDA 21 CFR Part 11 audits can extend validation by up to 12 months, slowing adoption. As a result, only 28% of pharma firms had moved more than half their libraries to cloud by late 2024.
*Our forecasts treat driver/restraint impacts as directional, not additive. The impact forecasts reflect baseline growth, mix effects, and variable interactions.
Compound Management Market Segment Analysis
By Type:
Services Gain Speed as Sponsors OutsourceProducts delivered 58.55% of 2025 revenue, anchored by robotic freezers, liquid handlers, and inventory scanners. However, services will outpace hardware with a 16.25% CAGR through 2031 as CROs absorb stewardship duties that once resided in-house. Automated storage systems—typified by Tecan’s Fluent and Hamilton’s Microlab STAR—reduce manual errors 95%, sustaining demand even while commoditization narrows margins. Sponsors refocus capital on AI analytics, letting external biorepositories finance cold-chain infrastructure.
Sample-archiving contracts convert fixed depreciation into variable fees and guarantee four-hour fulfillment. BioAscent’s Edinburgh upgrade added 12 million vial slots, while Syngene’s Bangalore facility undercuts U.S. pricing by 40%. Such models expand the compound management market size for services even as hardware sales plateau.


By Sample Type:
Biosamples Accelerate on Advanced TherapiesChemical compounds held 52.53% in 2025, yet biosamples will climb at 17.75% CAGR as cell and gene therapies proliferate. Each investigational product spawns thousands of cryovials that must remain at −80°C or in LN₂ with chain-of-custody metadata. WuXi Biologics added automated vial-thaw suites that cut contamination in master-cell banks. Enzymatic gene-synthesis start-ups also swell demand for plasmid storage.
Virtual catalogs such as Enamine’s REAL reduce physical small-molecule footprints, slowing chemical growth. Conversely, population cohorts and rare-disease registries extend biosample retention horizons to 50 years, elevating freezer capacity planning across the compound management industry.
By Application:
Biobanking Races Ahead, Drug Discovery Remains CoreDrug discovery retained 36.15% of 2025 sales thanks to high-throughput screening and AI triage. Yet biobanking will post a 17.82% CAGR through 2031 as genomics consortia scale to millions of biospecimens. SPT Labtech’s arktic platform reduces door openings 85%, preserving sample integrity for decades. Long-term storage fees and consent-management software push the compound management market size higher in this segment.
Gene-synthesis workflows, though smaller, gain from enzymatic DNA writers that deliver constructs same-day for CRISPR screens. Other niches—materials science or chemical synthesis—adopt similar plate-handling robotics, benefiting from spillover innovation.

By End User:
CROs Capture Incremental SpendPharmaceutical companies generated 35.65% of 2025 turnover, running centralized libraries for IP security. However, CROs will achieve a 15.32% CAGR as sponsors outsource plate reformatting and long-term archiving. Charles River already supervises 1.4 million compounds globally, shipping under temperature-monitored logistics compliant with FDA audits. Contract developers in India and China leverage labor arbitrage to deliver 24/7 retrieval at lower cost, swelling their share of compound management market revenue.
Academic institutes like UK Biobank contribute steady baseline demand yet operate under capped grants, favoring open-source inventory systems. Biopharma companies pursuing RNA and cell therapies require LN₂ precision, driving premium freezer sales and service contracts.
Geography Analysis
North America Compound Management Market
North America led with 38.23% of 2025 revenue, propelled by FDA guidance that mandates real-time temperature alerts and by deep venture funding for lab-automation start-ups such as Automata. Large players like Thermo Fisher, which bought Olink for USD 3.1 billion in 2024, integrate spatial-biology assays with storage workflows, reinforcing the region’s dominance. Canada and Mexico grow as satellite CRO hubs; BioAscent plans a 5 million-vial Toronto site by 2027.
Europe Compound Management Market
Europe benefits from a unified Annex 11 framework effective June 2025, spurring multi-country biorepository networks. Evotec and Lonza illustrate regional momentum, the latter posting a 12% emission reduction after freezer upgrades. Germany, the UK, and France remain flagship markets, while Switzerland and the Nordics specialize in gene synthesis and precision biobanking.
APAC Compound Management Market
Asia-Pacific will record the fastest 16.42% CAGR through 2031. Chinese CDMOs like WuXi AppTec reported USD 3.89 billion revenue in 2024 and are deploying automated vial-thaw suites to serve global sponsors. India’s Syngene offers FDA-compliant storage at 40% lower cost, attracting multinational trials. Yokogawa’s RAPID-Lab system aligns with Japan’s legacy ERP frameworks, easing adoption. Emerging clusters in Singapore and Taiwan court investment with modular automation and favorable regulation.
MEA and South America Compound Management Market
The Middle East, Africa, and South America together represent a smaller but rising share. Brazil’s National Cancer Institute modernized its biobank in 2024, and South Africa’s CSIR opened a gene-synthesis unit in 2025. Supply-chain fragility and skills shortages limit near-term growth yet create long-run catch-up potential.

Regulatory Landscape
Regulatory requirements in compound management increasingly focus on validated cold-chain control, electronic records, and documented traceability across storage, reformatting, and shipment. In the United States, FDA oversight relevant to outsourced and centralized handling is shaped by Section 503B policies, including the January 2025 final guidance on interim policy for compounding using bulk drug substances under 503B. This guidance tightened expectations while the agency continues its formal bulk drug list development.
In Europe, EMA guideline updates expand the compliance envelope for compound and biosample stewardship tied to advanced modalities and complex chemistries. EMA updated its Q&A guidance for biological medicinal products in December 2025, adding detail around reference standard qualification, bioburden testing, and protein content determination, which increases the need for consistent sample metadata and controlled handling. Additional guidance revisions in 2026, including updates to the chemistry of active substances and the Guideline on the Development and Manufacture of Synthetic Peptides effective June 1, 2026, raise the bar on impurity control (including N-nitrosamines) and documentation practices, indirectly increasing requirements for compliant sample inventories and data integrity in supporting laboratories and service providers.
Competitive Landscape
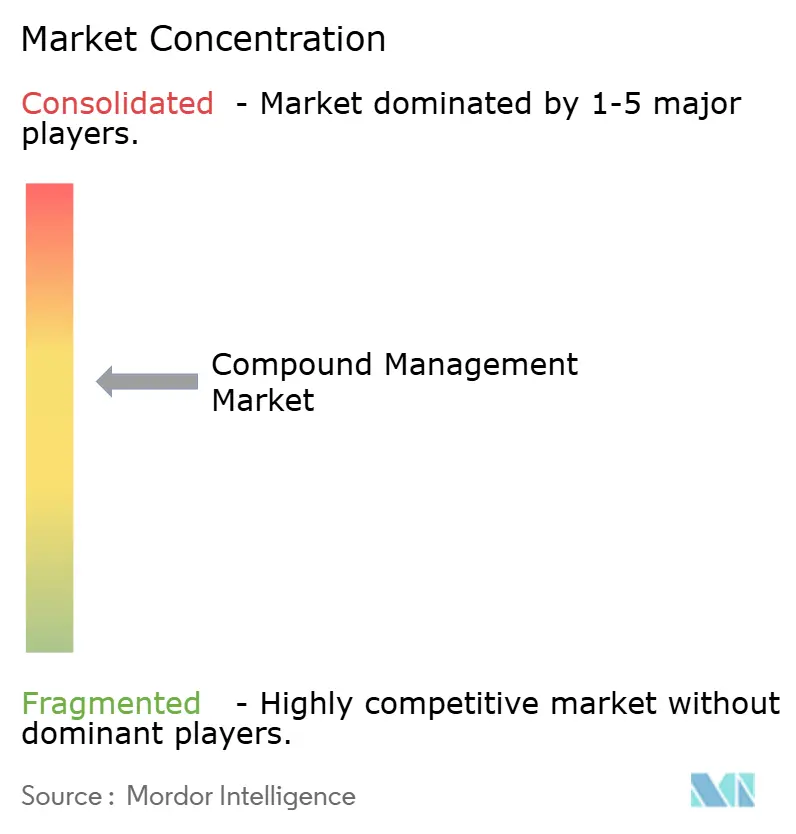
The compound management market is moderately concentrated: Thermo Fisher, Azenta, Tecan, Hamilton, and Beckman Coulter together command a significant share, but dozens of mid-tier specialists compete on niche innovation. Thermo Fisher’s Olink acquisition links proteomic readouts to freezer fleets, offering a cradle-to-insight platform. Tecan spent USD 576 million on Paramit and EUR 75 million on Cellenion to merge liquid handling with single-cell dispensing. Azenta leverages ISO 9001-certified BioStore III units to win multi-year archiving contracts from four top-20 pharma sponsors.
Disruptors attract venture funding: Ansa’s USD 65 million round advances enzymatic DNA synthesis, removing phosphoramidite waste. Automata’s LINQ orchestrates mixed-vendor robots through a single scheduler, raising USD 45 million. Trilobio’s microfluidic chips promise disposable dilution, cutting cross-contamination. Competitive differentiation is shifting from hardware robustness to software interoperability and cybersecurity readiness; Titian’s Mosaic 2025 adds MFA and encryption in response to 38% of IT managers fearing ransomware.
Compliance expertise becomes a protective moat: Annex 11’s audit-trail mandate strains small vendors lacking dedicated quality teams, while large multinationals build in-house regulatory affairs. Geographical arbitrage also influences strategy; Syngene’s Bangalore site offers compliant storage at 40% savings, and WuXi AppTec’s Shanghai hub provides Asia-Pacific proximity under China’s biosecurity rules.
Compound Management Industry Leaders
Hamilton Company
Azenta Life Sciences
Danaher (Beckman Coulter Life Sciences)
Thermo Fisher Scientific
Tecan Trading AG
- *Disclaimer: Major Players sorted in no particular order
Compound Management Market Companies Covered in this Report
- Abcam Compound Libraries
- AXXAM S.p.A.
- Azenta
- Beckman Coulter Life Sciences
- BioAscent
- Biosero
- Brooks Automation (SampleStore)
- Evotec
- FluidX (Azenta)
- Hamilton Company
- Heraeus CryoPac
- HighRes Biosolutions
- Inheco GmbH
- LiCONiC
- NEXUS Cryogenic Solutions
- SPT Labtech
- Tecan Group
- Thermo Fisher Scientific
- Titian Software
- WuXi App Tec
- Yokogawa RAPID-Lab
- Ziath

Market Opportunities and Future Outlook
Near-term whitespace is most visible in end-to-end traceability that spans physical custody, automated storage, and reformatting across multi-site workflows, particularly when sponsors split work between internal labs, CROs, and specialized biorepositories. Buyers are standardizing on integrated stacks that connect automated storage and liquid handling to sample bank software, reducing data loss and compliance friction under computerized-system controls. EU-OPENSCREEN’s 2025 shift to a fully automated workflow to manage over 100,000 compounds also points to institutional demand for standardized dissolution, aliquoting, storage, and reformatting rather than standalone equipment purchases.
Opportunity is also concentrated in scalable, high-density storage modules and service models that let smaller biotech and regional R&D hubs access compliant capacity without absorbing the full capital burden of ultra-low temperature and cryogenic automation. Product innovation is moving toward very high capacity formats and tighter automation integration, including Azenta Life Sciences’ 2024 launch of the BioArc Ultra with capacity above 16 million 0.9 mL tubes. On the services side, providers emphasizing full-process traceability and centralized stewardship, such as WuXi AppTec DMPK (platform update in July 2026), and newer logistics-focused entrants like Tangible Scientific (operations launch in February 2026), reflect active spending aimed at closing compound logistics bottlenecks, shortening turnaround, and improving auditability for distributed discovery programs.
Recent Industry Developments in Compound Management Market
- May 2026: Hamilton announced a strategic combination with Cerillo to integrate compact microplate reader technology with Hamilton liquid handling and automation platforms. The combination strengthens the link between sample handling and downstream readouts, supporting more integrated automated workflows in discovery and screening environments.
- March 2026: Azenta completed the acquisition of UK Biocentre Limited for GBP 20.5 million to expand its European sample management and biorepository footprint. The acquisition increases Azenta's service capacity and local infrastructure for outsourced sample storage and logistics, aligning with sponsors shifting stewardship to specialized providers.
- August 2025: Nanyang Biologics partnered with Equinix and HPE to launch Vecura, an AI-driven discovery platform, and outlined plans to build a large natural compound library in Singapore. The collaboration highlights infrastructure investment around data and compute integration with physical libraries, reinforcing demand for modern compound management tied to AI-enabled discovery workflows.


Compound Management Market Report Scope and Research Methodology
Market Definition and Coverage
For this study, the compound management market covers paid products and services used to receive, register, store, retrieve, track, and dispense chemical and biological samples that support research and drug discovery workflows.
Scope exclusions: We exclude internal lab consumables and general lab services that do not materially change sample integrity, traceability, or automated handling workflows.
Segments Covered in This Report
- By Type
- Products
- Automated Compound/Sample Storage Systems
- Automated Liquid-Handling Systems
- Other Storage/Handling Systems
- Services
- Products
- By Sample Type
- Chemical Compounds
- Biosamples
- By Application
- Drug Discovery
- Gene Synthesis
- Biobanking
- Other Applications
- By End User
- Pharmaceutical Companies
- Biopharmaceutical Companies
- Contract Research Organisations
- Academic & Government Institutes
- By Geography
- North America
- United States
- Canada
- Mexico
- Europe
- Germany
- United Kingdom
- France
- Italy
- Spain
- Rest of Europe
- Asia-Pacific
- China
- India
- Japan
- Australia
- South Korea
- Rest of Asia-Pacific
- Middle East and Africa
- GCC
- South Africa
- Rest of Middle East and Africa
- South America
- Brazil
- Argentina
- Rest of South America
- North America
Data Sources, Market Sizing, and Validation
Desk Research
Desk research starts with public data that helps anchor the demand pool and operating context. We reviewed sources such as US FDA and EMA guidance notes that influence sample traceability, NIH and OECD publications on life sciences R and D intensity, and public patent databases to understand automation and storage innovations.
To ground the model in real activity, we also used company filings, investor presentations, and reputable press coverage to map service footprints, site expansions, and outsourcing patterns. Where required, paid subscriptions for company financials and intelligence, news and financials, patent databases, and a global contracts and tenders tracker were used to speed up verification of deal timing and buyer intent. The examples listed above are illustrative only, and many other public and paid sources were also referred to for data collection, validation, and clarification.
Primary Interviews and Surveys
Primary work was used to pressure test desk assumptions and to translate workflows into measurable sizing inputs. We spoke with a mix of service providers, automation and storage specialists, and end users across pharma, biotech, CROs, and research centers, then reconciled differences by region and the maturity of screening programs.
Feedback focused on typical storage mix (ambient, refrigerated, frozen), expected automation penetration, common pricing structures (service fees versus equipment plus maintenance), and practical utilization levels that shape billable volume.
Distribution of primary research fieldwork respondents
| Company type | Respondent position | Region |
|---|---|---|
| Top tier: 38% | CXOs: 12% | APAC: 49% |
| Mid tier: 46% | Functional/Unit leaders: 38% | EMEA: 33% |
| Smaller Players: 16% | Managers: 50% | Americas: 18% |
Market-Sizing & Forecasting
Sizing is built by first reconstructing the addressable demand pool from life sciences R and D activity and screening intensity, then converting that into expected sample volumes that require managed storage and handling. From there, we apply adoption and outsourcing shares to split what is handled internally versus what is placed with specialist providers, before converting volumes into value using observed service fees and equipment-related revenue capture.
Inputs used in the model include the number of active discovery programs, compound library sizes and refresh rates, automation penetration in storage and retrieval, cold storage capacity additions, and typical utilization and turnaround time targets that constrain throughput. Because public data can be patchy, we corroborate the outputs with selective bottom-up checks, such as sampling reported revenue mixes, reviewing project pipelines, and validating implied pricing against commonly quoted service bundles.
For forecasting, we run scenario analysis around a central case, since growth is sensitive to R and D budgets, outsourcing appetite, and speed of lab automation adoption. Practically, we step assumptions forward using expert consensus on how quickly automated storage expands, how pricing changes with higher throughput, and how regulatory documentation expectations affect managed workflows.
Data Validation & Update Cycle
Model outputs are checked against independent signals, including disclosed capacity expansions, hiring and facility announcements, and observed shifts toward outsourced discovery operations. When outputs look inconsistent, we revisit the driver assumptions and trigger a second round of expert follow-ups to explain the variance.
Before sign-off, the work is reviewed in multiple analyst steps, including logic checks on volume-to-value conversion, regional split sanity checks, and currency timing consistency. Reports are refreshed annually, with interim updates when material events occur, such as major capacity additions, pricing resets, or regulatory changes that alter documentation needs. Right before delivery, we run a final pass so clients receive the latest updated view.
Mordor Intelligence's Compound Management Market Size Versus Other Published Estimates
Published market sizes for compound management do not always line up because each publisher makes different choices on what is counted, how the pricing is built, and which year is treated as the starting point. Differences also show up when one estimate leans more on equipment shipments while another leans more on service revenue, even though buyers often purchase these together in bundles.
The biggest gap driver is whether revenues from related lab automation hardware are counted broadly or only when they are directly tied to compound storage, tracking, and retrieval workflows. In practice, Mordor Intelligence handles this by counting value only when it supports those defined activities, and by validating those links with utilization and pricing checks.
Benchmark comparison
| Source | Market Size | Gaps in Research Methodology |
|---|---|---|
| Mordor Intelligence | USD 0.54 B (2026) | |
| Industry Publisher A | USD 0.64 B (2026) | Often includes a wider basket of lab automation and informatics spend alongside compound handling, which can lift totals when bundled equipment is counted at full value. |
| Industry Publisher B | USD 0.56 B (2025) | Uses an earlier base year and may translate sample volumes to value using broader average pricing, which can differ when automation penetration and utilization are not normalized by end user. |
Across the three numbers, the spread is mostly explained by scope decisions and how pricing is converted from workflow activity into revenue. When the model is tied back to library volume, automation adoption, and realistic utilization, the resulting market size stays traceable to a repeatable set of inputs and checks.


Key Questions Answered in the Report
What does compound management cover and why is it increasingly vital for drug discovery?
It brings together robotic freezers, liquid handlers, and inventory software to store and retrieve chemicals or biosamples on demand, trimming hit-to-lead timelines by up to 40% through seamless integration with AI imaging systems.
How rapidly is spending on outsourced sample libraries expanding?
Services that archive, reformat, and ship samples for sponsors are projected to climb at a 16.25% CAGR between 2026 and 2031 as companies convert fixed storage costs into pay-as-you-go fees.
Which sample type is growing the quickest and what is driving the surge?
Biosamples are forecast to rise at a 17.75% CAGR through 2031 because cell and gene therapy pipelines demand cryogenic precision for cell banks, viral vectors, and plasmids.
How do regulations such as the FDA's temperature guidance and the EU's Annex 11 affect adoption?
These rules require continuous temperature monitoring, audit trails, and electronic signatures, pushing labs to replace manual freezers and paper logs with automated, software-controlled systems.
In what ways are laboratories reducing the energy footprint of ultra-low-temperature storage?
Measures such as raising set points from -80 °C to -70 °C and fitting variable-speed compressors cut freezer electricity use by 15-28%, helping firms like Lonza lower Scope 1 and 2 emissions by 12% in 2024.
Page last updated on:


 Your data is secure and never sold or shared.


