Compound Horse Feedstuff Market Size and Share
Market Overview
| Study Period | 2020 - 2030 |
|---|---|
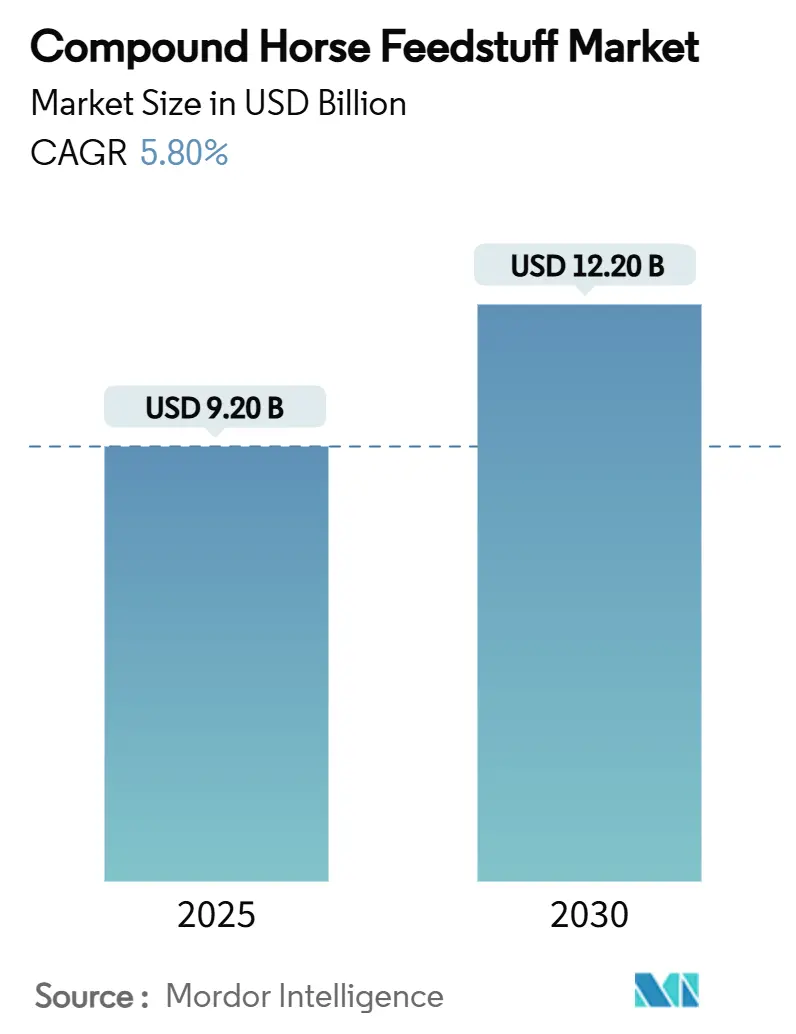
| Market Size (2025) | USD 9.20 Billion |
| Market Size (2030) | USD 12.20 Billion |
| Growth Rate (2025 - 2030) | 5.80% CAGR |
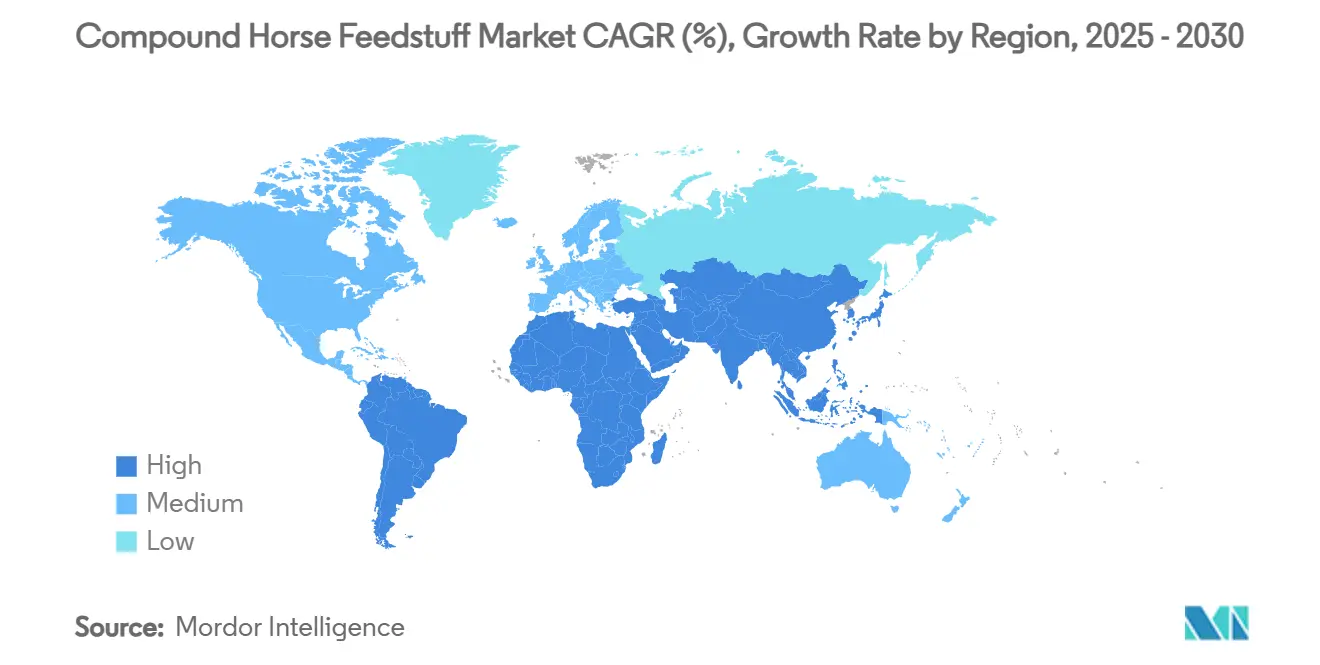
| Fastest Growing Market | Asia Pacific |
| Largest Market | North America |
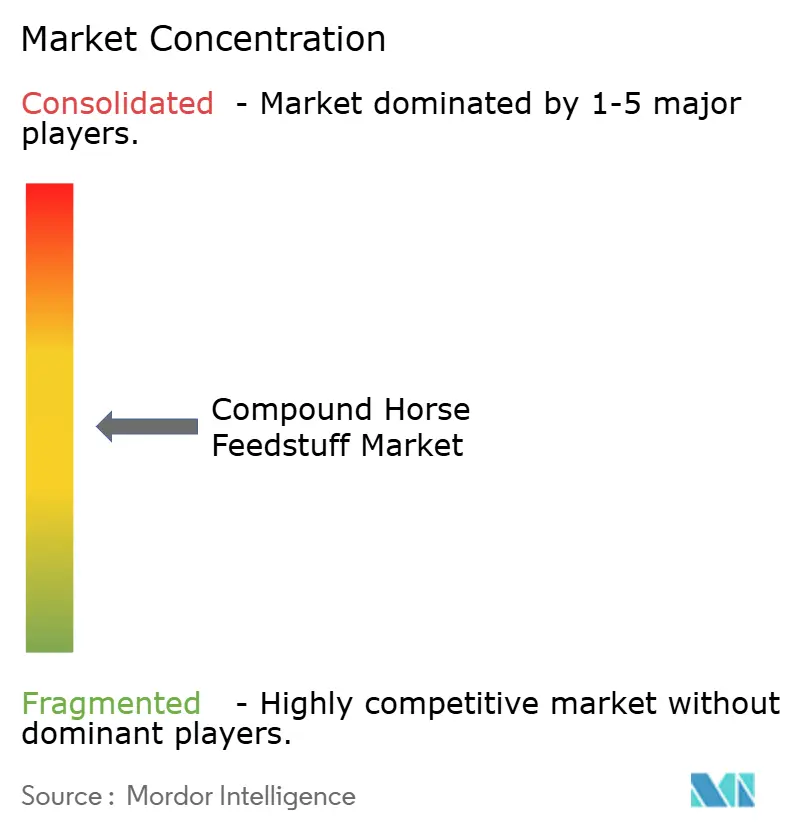
| Market Concentration | Medium |
Major Players *Disclaimer: Major Players sorted in no particular order Image © Mordor Intelligence. Reuse requires attribution under CC BY 4.0. | |
Compound Horse Feedstuff Market Analysis by Mordor Intelligence
The compound horse feedsuff market size reached USD 9.2 billion in 2025 and is projected to touch USD 12.2 billion by 2030, reflecting a 5.8% CAGR across the period. Rising professionalization of equine sports, expanding equine therapy programs, and premiumization of animal nutrition continue to steer volume and value growth. Owners increasingly demand scientifically calibrated rations that mirror companion-animal standards, pushing manufacturers toward evidence-based formulations and transparent ingredient sourcing. Precision-feeding hardware is cutting waste and sharpening ration accuracy, while e-commerce subscription models are widening access and compressing channel margins. Regulatory modernization, such as Canada’s updated Feeds Regulations and imminent tightening of the United States additive approvals, is prompting reformulations and larger capital outlays that favor firms with deep compliance capabilities. Mergers and acquisitions remain active as leading suppliers secure regional mills to lock in raw-material chains and shorten delivery routes.
Key Report Takeaways
- By feed type, pelleted feed held 42.5% revenue in 2024, and the concentrates and supplements are set to climb at an 8.1% CAGR through 2030.
- By ingredient type, cereal-based formulas accounted for 57.6% of the compound horse feedstuff market share in 2024, while protein meals are projected to expand at a 7.9% CAGR.
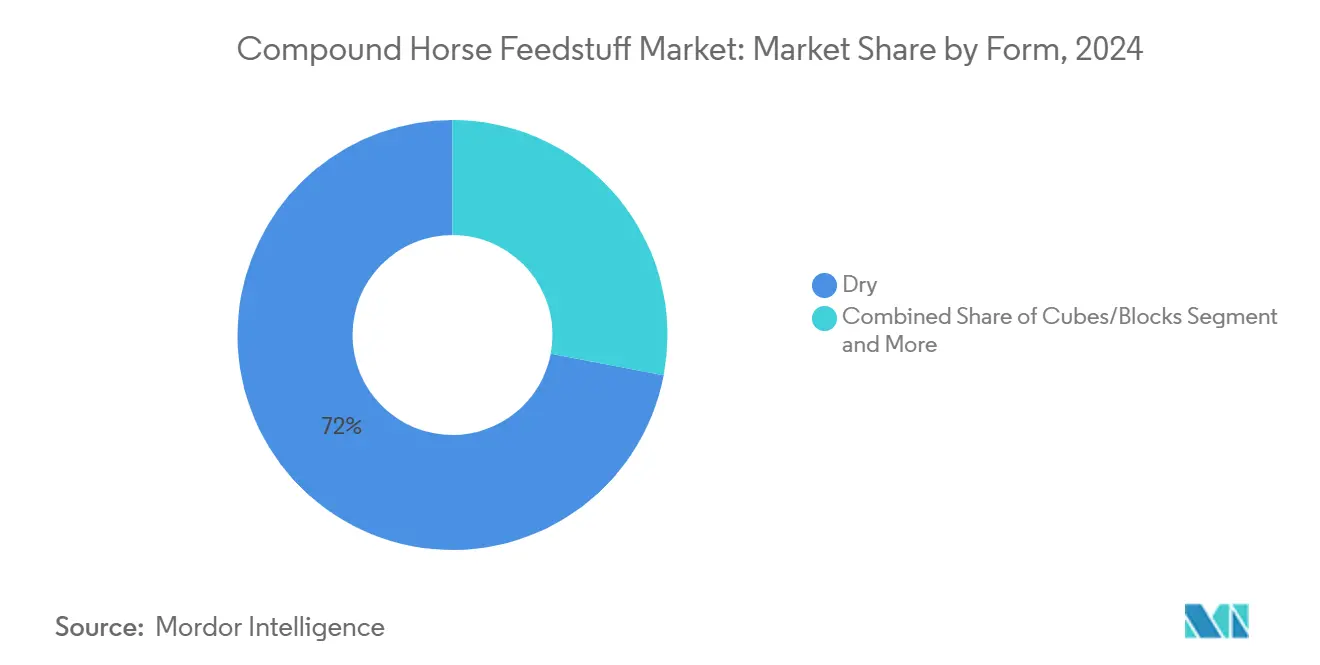
- By form, dry feeds generated 72.0% of the compound horse feedstuff market size in 2024, and cubes/blocks are poised for a 9.1% CAGR during the forecast horizon.
- By horse age group, adult horses produced 45.6% of 2024 sales, and the senior-specific diets are forecast to grow at an 8.7% CAGR.
- By distribution channel, offline retail captured 63.3% revenue in 2024, yet online retail is accelerating at an 11.7% CAGR amid subscription uptake.
- By geography, North America contributed 32.8% to global revenue in 2024, and the Asia-Pacific will register the quickest 8.8% CAGR to 2030.
- The five largest manufacturers commanded 49.7% combined revenue in 2024, underscoring a moderately concentrated competitive field.
Global Compound Horse Feedstuff Market Trends and Insights
Drivers Impact Analysis*
| Driver | (~) % Impact on CAGR Forecast | Geographic Relevance | Impact Timeline |
|---|---|---|---|
| Rising equine sports participation | +1.2% | Global, with strongest impact in North America and Europe | Medium term (2-4 years) |
| Growth of premiumization in pet nutrition | +1.0% | North America and Europe, and expanding to Asia-Pacific | Long term (≥ 4 years) |
| Adoption of precision nutrition programs | +0.8% | North America and Europe, and early adoption in Australia | Medium term (2-4 years) |
| Expansion of equine therapy centers | +0.6% | Global, with rapid growth in Asia-Pacific | Long term (≥ 4 years) |
| Proliferation of functional fiber innovations | +0.4% | Global, led by European regulatory frameworks | Short term (≤ 2 years) |
| Surge in direct-to-owner subscription models | +0.3% | North America. Europe, and emerging in Asia-Pacific | Short term (≤ 2 years) |
| Source: Mordor Intelligence | |||
Rising equine sports participation
Competitive horses consume 25-30% more calories than maintenance animals, and sanctioned events have expanded 15% year over year in major markets, lifting demand for performance-grade rations that sustain energy and speed recovery. Governments in Asia-Pacific invested USD 2.3 billion during 2024 to upgrade arenas, spurring grassroots riding clubs. Recreational riders also emulate elite diets, creating steady demand across all activity levels. This trend extends beyond elite competition to amateur participation, where weekend riders increasingly adopt professional-grade nutrition protocols. The ripple effect creates sustained demand for premium feed formulations that can deliver consistent performance benefits across diverse activity levels.
Growth of premiumization in pet nutrition
Owners adopt companion-animal benchmarks, favoring human-grade ingredients and traceable supply chains. Average feed prices jumped 18-22% during 2024 as digestibility, palatability, and condition-specific claims trumped cost. Surveys show veterinarians shape 67% of premium purchases, and breed or life-stage Stock Keeping Units (SKUs) widen shelf assortments, anchoring higher margins. The trend particularly resonates with urban horse owners who view their animals as companions rather than livestock, driving sustained margin expansion across the premium segment.
Adoption of precision nutrition programs
The Internet of Things (IoT) sensors and automated feeders trim waste by 12-15% and elevate weight-gain efficiency by 8-10%, delivering rapid payback for commercial barns[1]Source: Martin Zuidhof, “Precision Livestock Feeding,” sciencedirect.com. Real-time data sync with veterinary portals permits micro-adjustments that improve feed conversion by 20-25% among performance stables. Falling hardware costs and app-driven dashboards help mid-size operations adopt precision protocols.
Expansion of equine therapy centers
More than 4,800 certified programs operated worldwide in 2024, each requiring rations that support calm demeanor and gastrointestinal stability. Low-starch, high-fiber lines meet insurance-funded therapy protocols, and aging populations in developed economies underpin demand relevance. Insurance coverage expansion for equine therapy services in several jurisdictions has improved facility economics, supporting sustained feed demand growth. The demographic shift toward aging populations in developed markets is driving particular growth in therapeutic applications, where horses serve as mobility and mental health support tools.
Restraints Impact Analysis*
| Restraint | (~) % Impact on CAGR Forecast | Geographic Relevance | Impact Timeline |
|---|---|---|---|
| High cost volatility of key cereals | -1.4% | Global, with highest impact in import-dependent regions | Short term (≤ 2 years) |
| Concerns on feed toxin contamination | -0.8% | Global, with strictest enforcement in North America and Europe | Medium term (2-4 years) |
| Scarcity of phosphorous-efficient formulations | -0.3% | Europe and North America, expanding to other regions | Long term (≥ 4 years) |
| Stringent medication-carryover regulations | -0.2% | Global, with strictest enforcement in competitive circuits | Medium term (2-4 years) |
| Source: Mordor Intelligence | |||
High cost volatility of key cereals
Corn and oats make up about 70% of production costs. Although the United States Department of Agriculture (USDA) pegged 2025 corn at USD 1.06 per metric ton, erratic weather and export swings fuel price swings[2]Source: USDA, “World Agricultural Supply and Demand Estimates,” usda.gov. Manufacturers trial alternative grains yet must validate nutrition profiles and win label approvals, raising formulation expenses. The feed manufacturers are increasingly adopting alternative grain sources and flexible formulation strategies to mitigate price risk, though these adaptations often require extensive nutritional testing and regulatory approval. The concentration of grain production in specific geographic regions amplifies supply chain vulnerabilities, particularly for markets dependent on imports.
Concerns on feed toxin contamination
Mycotoxin incidents, such as the fatal 2024 ionophore mix-up, spurred zero-tolerance rules and pushed testing costs up to 12% higher[3]Source: Feed Strategy, “Macro Trends for the Feed Industry in 2025,” feedstrategy.com. The Food and Drug Administration's (FDA) shifting additive approval framework elongates development cycles, favoring companies with robust quality systems. Zero-tolerance policies in competitive equestrian circuits have forced manufacturers to implement stringent cleaning protocols and segregated production lines to prevent medication carryover.
*Our forecasts treat driver/restraint impacts as directional, not additive. The impact forecasts reflect baseline growth, mix effects, and variable interactions.
Segment Analysis
By Feed Type: Pelleted formats consolidate leadership
Pelleted Feed captured 42.5% revenue in 2024. Uniform nutrient density and favorable flow characteristics reduce selective feeding and labor, aligning with large-scale operations. The compound horse feedstuff market size attributable to concentrates and supplements is anticipated to rise at an 8.1% CAGR as precision-nutrition adoption grows. Textured feeds, at 28% share, drive loyalty but face waste and storage concerns. Complete Feed holds 18% share, posting 4.2% growth as convenience-minded owners embrace all-in-one solutions. Advances in extrusion allow inclusion of fragile vitamins while safeguarding palatability. Total mixed ration trials reported 47.53% body-weight gains, encouraging experimental blends.
Manufacturers enrich pellets with controlled-release starch and supplemental fat to meet high caloric needs without glycemic spikes, bolstering safe-energy delivery for sport horses. Widespread pelleting aligns with automated feeders that accurately portion rations, enabling data-driven operations and supporting volume throughput in the market.


By Ingredient Type: Protein Meals accelerate
Cereal-based diets remained dominant with a 57.6% share in 2024, yet growth cooled to 3.8% as owners sought superior amino-acid density. Protein Meals are set for a 7.9% CAGR on the back of muscle-building demand. Dual-protein strategies that pair soybean or canola meal with synthetic lysine fine-tune essential amino-acid ratios and satisfy performance barns. Fiber Additives account for a 15% share and rise 5.1% annually as prebiotic research underscores gut health benefits. Oils and Fats, now 8%, grew 6.8% in 2024 as omega-three enrichment links to anti-inflammatory advantages.
Functional blends now embed probiotics, enzymes, and chelated minerals. Pea protein appeals to non-GMO buyers, and mechanized micro-dosing systems allow consistent nutrient inclusion, elevating premium label credibility in the horse feed market.
By Horse Age Group: Senior cohort expands fastest
Adult horses generated 45.6% share in 2024 turnover and will progress steadily at 4.8%. Senior diets will progress at an 8.7% CAGR, reflecting veterinary care improvements that extend equine lifespans and heighten owner attachment. Formulators prioritize digestibility, vitamin E, and omega-three fortification to offset metabolic decline. Foals and Yearlings share 25% of demand and expand 6.2%, helped by empirical links between early nutrition and lifelong performance. Lysine-rich mare feeds enhance milk yield and foal development in controlled studies, supporting premium pricing.
Manufacturers cultivate cradle-to-grave brand loyalty by aligning SKUs with each life stage. Senior pellets employ extruded grains for softer chew and buffered calcium to lower ulcer risk, while growth rations integrate chelated trace minerals to spur bone maturation.
By Form: Dry remains dominate, cubes grow fastest
Dry formulations held a commanding 72.0% market share in 2024, with long shelf life and compatibility with bulk delivery infrastructure. Cubes/Blocks will outpace others at a 9.1% CAGR as dust-free handling attracts owners of respiratory-sensitive horses. These compressed feeds also fit pasture feeding with minimal equipment. Liquid/Mash lines sit near 8% share, leveraging rehydration and recovery positioning. New pouch concentrates dilute at the barn to cut freight weight, and gel feeds marry hydration with nutrient payloads.
Portable cube dispensers used during travel protect portion control for competition horses. In parallel, InstaMix liquid concentrates integrate electrolytes and branch-chain amino acids, commanding premium prices and extending brand differentiation.
By Distribution Channel: E-commerce upends legacy retail
Offline retail still owns 63.3% revenue share in 2024 due to immediate availability and expert counsel from feed stores and veterinarians. Online retail will post an 11.7% CAGR as subscription services deliver convenience and cost savings. Digital channels bypass distributor margins and collect consumption data for targeted upsells. Shipping heavy feed remains a hurdle, so hybrid click-and-collect models are gaining traction.
Influencer content and social ads accelerate trial, while mobile apps help owners calculate rations by weight and workload, nudging supplementary purchases. Recyclable, courier-grade multi-wall bags reduce damage and elevate unboxing visibility, reinforcing brand equity within the horse feed market.
Geography Analysis
North America led the horse feed market with 32.8% revenue in 2024. More than 30 million Americans engage in horse activities, generating USD 122 billion in annual economic output. Canada’s regulatory overhaul raised safety and traceability barriers, prompting product upgrades. Steady 4.2% regional CAGR is driven by premiumization, precision-feeding uptake, and stable therapy demand. Firms exploit robust distribution grids and advanced veterinary ecosystems to introduce high-margin offerings, while e-commerce subs and micro-fulfillment centers tighten service windows.
The Asia-Pacific region is projected to record the fastest growth, with a CAGR of 8.8% through 2030. While China's equine population declined from 3.72 million in 2021 to 3.59 million in 2023, the remaining population is now primarily used for leisure and sports, driving demand for higher-quality feed. Government grants and corporate sponsorship expand show-jumping circuits and therapy centers. Rising middle-class incomes in urban China, Japan, and Australia elevate willingness to pay for imported brands. Local mills partner with multinationals for Western-grade formulations, balancing cost with performance expectations.
Europe held 28% revenue share and advanced 4.0% in 2024. The continent’s equine economy generates EUR 100 billion (USD 108 billion) each year and underpins significant employment. Organic and non-GMO claims resonate as sustainability rules tighten. Environmental directives constrain phosphorous output, pushing enzyme-aided feeds, while animal-welfare mandates drive medicated-free claims. Brexit-induced trade uncertainty led United Kingdom firms to rework supply chains, yet demand persists in show-jumping hubs.

Competitive Landscape
The five largest suppliers held 49.7% global revenue in 2024, confirming moderate concentration that leaves room for regional challengers. Cargill, Incorporated leverages nationwide mill footprints and research and development heft to innovate high-fat, low-starch formulations that align with metabolic health goals. Purina Mills LLC (Land O’Lakes Inc.) supports adoption through an extensive field-service network and proprietary ration-balancing software, anchoring strong brand loyalty among boarding barns. Archer-Daniels-Midland Company differentiates by cross-selling amino-acid concentrates from its broader oilseed complex, leveraging vertical integration to control raw inputs.
Kent Worldwide capitalizes on Midwestern distribution strength and invests in clean-label manufacturing lines that satisfy medication-carryover rules. Ridley Corporation Ltd., headquartered in Australia, climbs into the top tier through its Barastoc brand and is accelerating exports across Asia-Pacific. Consolidation persists as majors purchase regional mills to secure cereal origination and streamline logistics. Precision-feeding technology serves as a competitive tool, with industry leaders incorporating smart feeders into supply contracts, resulting in data lock-in that increases switching costs. Changes in regulations following the expiration of the memorandum between the Food and Drug Administration (FDA) and the Association of American Feed Control Officials (AAFCO) have increased documentation requirements, which larger firms are better equipped to manage.
Smaller companies exploit white-space niches such as organic, therapeutic, or breed-specific diets, leaning on agile formulation protocols and intimate customer service. Yet capital requirements for segregated production and on-site toxin testing are climbing, potentially accelerating further industry consolidation within the horse feed market.
Compound Horse Feedstuff Industry Leaders
Purina Mills LLC (Land O’Lakes Inc.)
Ridley Corporation Ltd.
Archer-Daniels-Midland Company
KENT Worldwide
Cargill, Incorporated
- *Disclaimer: Major Players sorted in no particular order

Recent Industry Developments
- October 2024: AgroCares and Trouw Nutrition have renewed their partnership to advance precision feed solutions through the NutriOpt On-site Adviser, enhancing mobile nutritional analysis capabilities for livestock, including horses. Utilizing Trouw Nutrition’s comprehensive nutrient database and expertise, the NutriOpt On-Site Adviser can analyze raw ingredients and finished feed for specific species in under five minutes.
- September 2024: Cargill, Incorporated acquired two United States mills from Compana Pet Brands to increase production capacity for livestock, pet, and equine nutrition. This acquisition aims to expand their reach to large ranchers, agricultural retailers, and consumers of products such as horse treats. The move strengthens Cargill's position in the growing United States animal nutrition market and aligns with their objective to serve a diverse customer base.
- July 2024: The Canadian Food Inspection Agency (CFIA) introduced the Feeds Regulations, 2024, replacing the 1983 regulations to enhance feed safety through risk-based approaches. Key updates include Preventive Control Plans (PCPs), licensing requirements for importers and exporters, detailed tracking systems, revised nutrient standards for horses and other livestock, and alignment with international standards.


Global Compound Horse Feedstuff Market Report Scope
| Pelleted Feed |
| Textured (Sweet) Feed |
| Complete Feed |
| Concentrates and Supplements |
| Cereal-based |
| Protein Meals |
| Fiber Additives |
| Oils and Fats |
| Dry |
| Cubes/Blocks |
| Liquid/Mash |
| Foal |
| Yearling |
| Adult |
| Senior |
| Offline Retail |
| Online Retail |
| North America | United States |
| Canada | |
| Rest of North America | |
| South America | Brazil |
| Argentina | |
| Rest of South America | |
| Europe | Germany |
| United Kingdom | |
| France | |
| Russia | |
| Rest of Europe | |
| Asia-Pacific | China |
| Japan | |
| India | |
| Australia | |
| Rest of Asia-Pacific | |
| Middle East | United Arab Emirates |
| Saudi Arabia | |
| Rest of Middle East | |
| Africa | South Africa |
| Egypt | |
| Rest of Africa |
| By Feed Type | Pelleted Feed | |
| Textured (Sweet) Feed | ||
| Complete Feed | ||
| Concentrates and Supplements | ||
| By Ingredient Type | Cereal-based | |
| Protein Meals | ||
| Fiber Additives | ||
| Oils and Fats | ||
| By Form | Dry | |
| Cubes/Blocks | ||
| Liquid/Mash | ||
| By Horse Age Group | Foal | |
| Yearling | ||
| Adult | ||
| Senior | ||
| By Distribution Channel | Offline Retail | |
| Online Retail | ||
| By Geography | North America | United States |
| Canada | ||
| Rest of North America | ||
| South America | Brazil | |
| Argentina | ||
| Rest of South America | ||
| Europe | Germany | |
| United Kingdom | ||
| France | ||
| Russia | ||
| Rest of Europe | ||
| Asia-Pacific | China | |
| Japan | ||
| India | ||
| Australia | ||
| Rest of Asia-Pacific | ||
| Middle East | United Arab Emirates | |
| Saudi Arabia | ||
| Rest of Middle East | ||
| Africa | South Africa | |
| Egypt | ||
| Rest of Africa | ||


Key Questions Answered in the Report
What is the current global value of the compound horse feedstuff market?
The compound horse feedstuff market size stood at USD 9.2 billion in 2025 and is forecast to reach USD 12.2 billion by 2030.
Which region will grow fastest in the coming years?
Asia-Pacific is projected to advance at an 8.8% CAGR through 2030 due to rising equestrian investment and therapy adoption.
Which feed type dominates sales?
Pelleted Feed led with 42.5% revenue share in 2024 due to uniform nutrition and labor efficiency.
How are online channels transforming distribution?
Online retail is expanding at an 11.7% CAGR by delivering subscription convenience and detailed usage analytics.
Page last updated on:


