Composite Materials In Renewable Energy Market Size and Share
Market Overview
| Study Period | 2020 - 2031 |
|---|---|
| Market Size (2026) | USD 10.97 Billion |
| Market Size (2031) | USD 16.12 Billion |
| Growth Rate (2026 - 2031) | 7.99% CAGR |
| Fastest Growing Market | Asia Pacific |
| Largest Market | Asia Pacific |
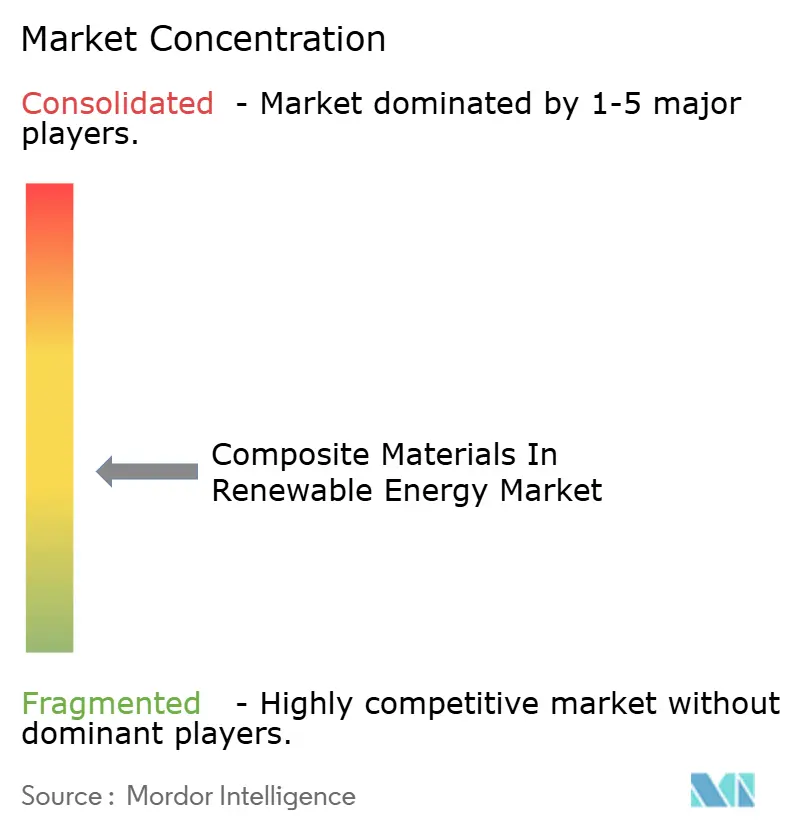
| Market Concentration | Medium |
Major Players *Disclaimer: Major Players sorted in no particular order Image © Mordor Intelligence. Reuse requires attribution under CC BY 4.0. | |

Composite Materials In Renewable Energy Market Analysis by Mordor Intelligence
The composite materials in the renewable energy market size was valued at USD 10.16 billion in 2025 and estimated to grow from USD 10.97 billion in 2026 to reach USD 16.12 billion by 2031, at a CAGR of 7.99% during the forecast period (2026-2031). Rapid capacity additions in wind, solar, and hydrogen projects demand lighter, stronger structures that extend component lifetimes and shrink carbon footprints. Government clean-energy mandates, breakthroughs in recyclable thermoplastic platforms, and the need for lightweight materials that endure harsh offshore and desert climates combine to accelerate procurement cycles. Automated fibre placement, 3D printing, and other Industry 4.0 processes are compressing production timelines while trimming manufacturing scrap. At the same time, vertically integrated suppliers are consolidating fibre spinning, resin synthesis, and part fabrication to secure critical inputs amid supply-chain tension. These intersecting forces position the composite materials in the renewable energy market for a decade of steady, innovation-driven growth.
Key Report Takeaways
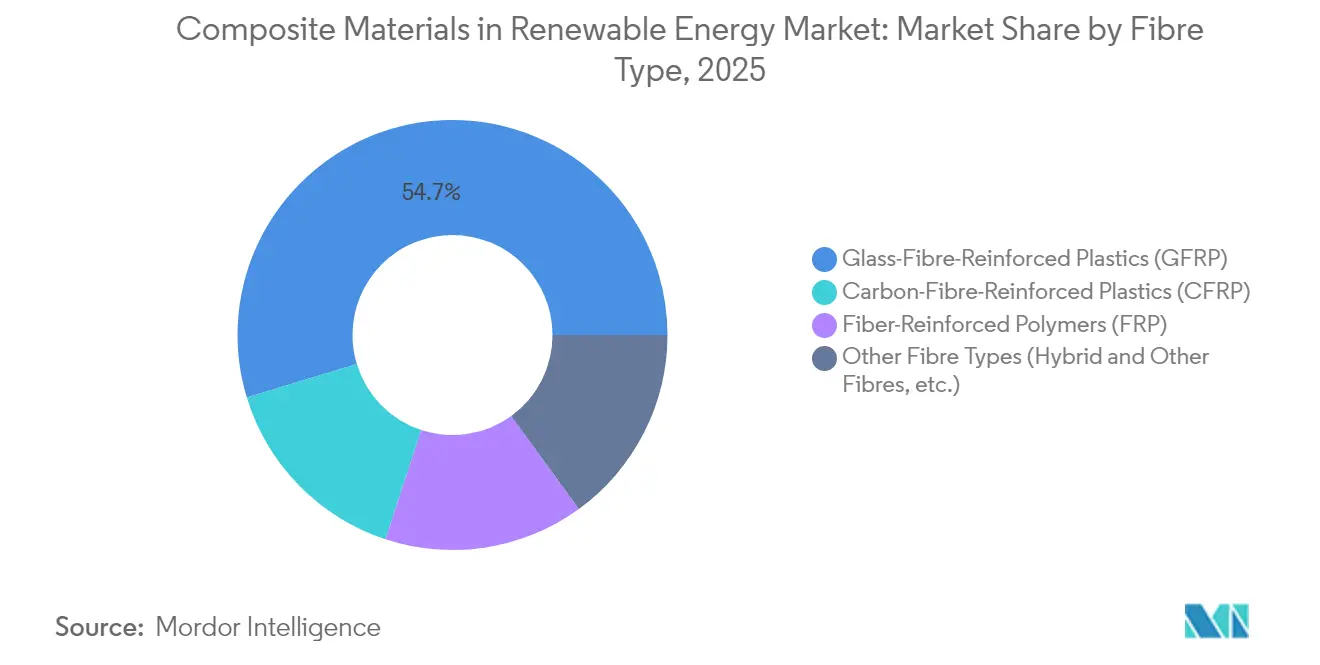
- By fibre type, glass-fibre-reinforced plastics led with 54.70% revenue share in 2025; carbon fibre is projected to grow fastest at 8.39% CAGR to 2031.
- By resin matrix, epoxy accounted for 45.20% revenue share in 2025; bio-resins and recycled resins are projected to grow fastest at 7.88% CAGR through 2031.
- By manufacturing process, vacuum infusion dominated with a 33.75% share in 2025, while automated fibre placement and 3D printing will expand at a 7.75% CAGR to 2031.
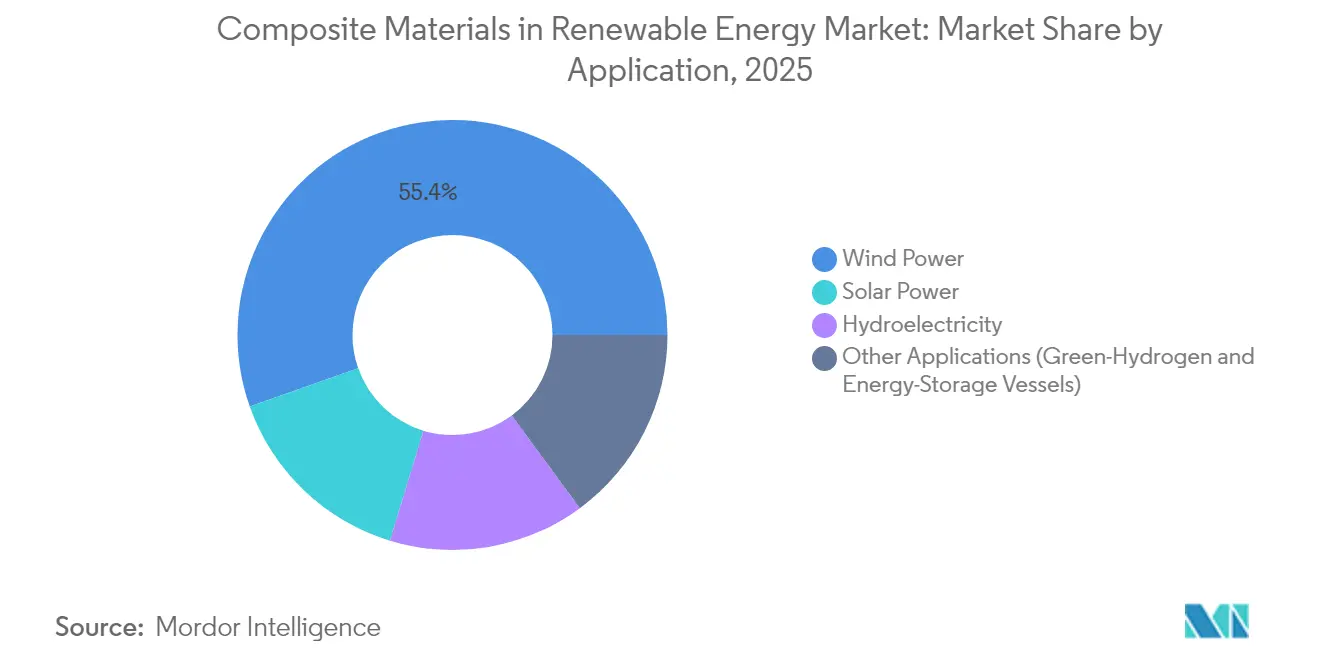
- By application, wind power held 55.40% of composite materials in the renewable energy market share in 2025, whereas other applications, such as green-hydrogen storage and floating solar installations, are projected to advance at the fastest CAGR of 7.60% through 2031.
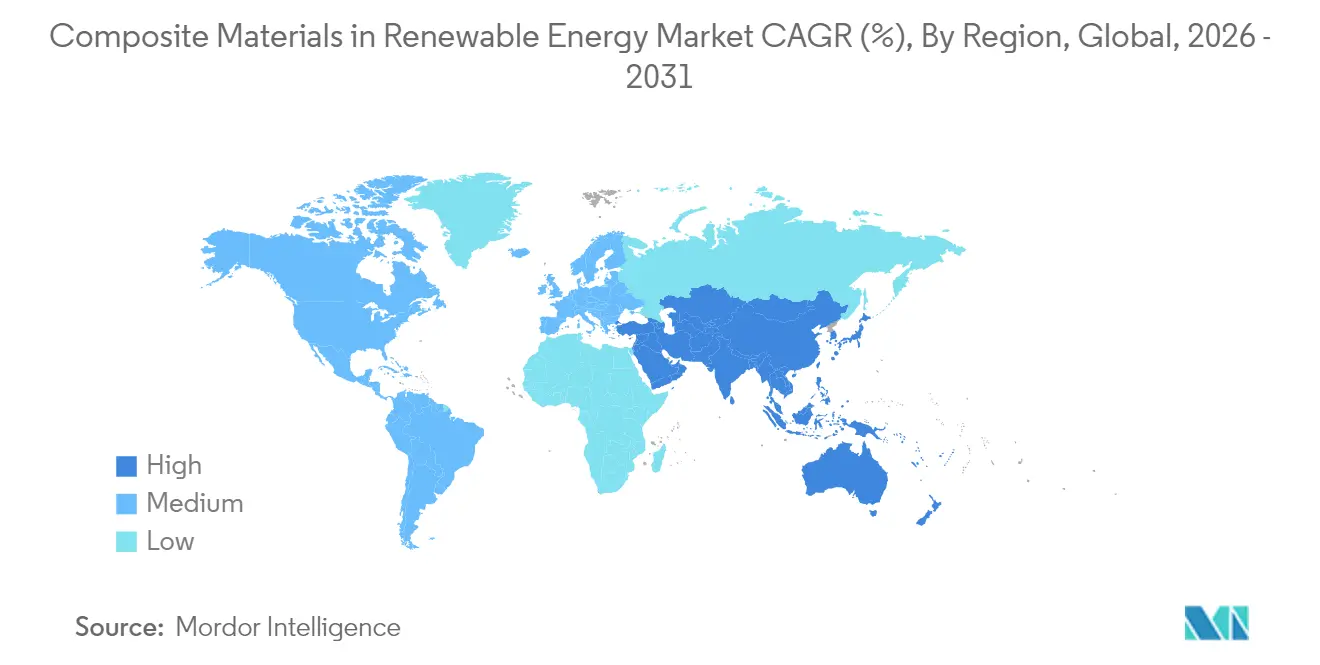
- By geography, Asia-Pacific accounted for 44.30% of the composite materials in the renewable energy market size in 2025 and is forecast to post an 8.03% CAGR through 2031.
Note: Market size and forecast figures in this report are generated using Mordor Intelligence’s proprietary estimation framework, updated with the latest available data and insights as of 2026.
Global Composite Materials In Renewable Energy Market Trends and Insights
Driver Impact Analysis*
| Driver | (~) % Impact on CAGR Forecast | Geographic Relevance | Impact Timeline |
|---|---|---|---|
| Reduced weight versus metallic structures | +1.8% | Global, with strongest impact in offshore wind markets | Medium term (2-4 years) |
| Growing demand for longer wind-turbine blades | +2.1% | APAC core, spill-over to North America and Europe | Long term (≥ 4 years) |
| Government inclination towards adoption of renewable energy | +1.5% | Global, with early gains in US (IRA), China, and India | Short term (≤ 2 years) |
| Commercialization of thermoplastic recyclable blade platforms | +0.9% | Europe and North America leading, APAC following | Medium term (2-4 years) |
| Rising adoption of 3D printed composite parts in floating solar & tidal devices | +0.7% | APAC coastal regions, expanding to MEA and Australia | Long term (≥ 4 years) |
| Source: Mordor Intelligence | |||
Reduced Weight Versus Metallic Structures
Composite substitution cuts structural mass in offshore wind, hydrogen tanks, and tidal devices, boosting payload efficiency and easing transport logistics. Weight savings of 13.76% on tidal blades have lifted power output by 46.1% versus steel alternatives. In aerospace, the development of liner-less Type V carbon-composite tanks supports the transition to liquid-hydrogen propulsion, indirectly increasing demand for renewable-grade fibres. Mitsubishi Chemical’s C/SiC ceramic matrix composite endures 1,500 °C, opening paths for heliostat receivers and fusion-reactor hardware. These advances underline why the composite materials in the renewable energy market continue to displace aluminum and steel in high-temperature, corrosive environments.
Growing Demand for Longer Wind-Turbine Blades
Siemens Energy’s 21 MW prototype with a 276 m rotor diameter illustrates how blade lengths nearing 150 m require carbon-fibre spar caps for stiffness-to-weight targets unattainable with glass fibre alone. Segmented blade architectures, enabled by high-toughness epoxy joints, ease transport while maintaining aeroelastic integrity. The ZEBRA consortium completed the world’s largest fully recyclable thermoplastic blade using Arkema’s Elium resin, signalling industrial readiness for closed-loop platforms. Hybrid lay-ups that mix natural and synthetic fibres improve impact resistance and lower embodied carbon, aligning with EU offshore wind targets of 150 GW by 2050 that could double global carbon-fibre demand.
Government Inclination Towards Adoption of Renewable Energy
Policy momentum accelerates procurement. The U.S. Inflation Reduction Act grants a 10% bonus tax credit for domestically sourced components, spurring nearly USD 600 million of new GE Vernova factories and 1,500 jobs in 2025. China’s 2024 green-manufacturing rules call for 40% of all industrial output from certified “green factories” by 2030, fostering investment in blade-recycling capacity[1]Government of China, “Green Manufacturing Policy Framework 2024,” gov.cn. India’s National Hydrogen Mission allots USD 2.4 billion to reach 5 million t annual green-hydrogen output by 2030, priming demand for 700-bar composite vessels. Japan’s perovskite roadmap, spearheaded by a public-private council, targets 38.3 GW by 2040 via flexible composite substrates. Such statutes propel the composite materials in the renewable energy market toward localization and rapid capacity buildout.
Commercialization of Thermoplastic Recyclable Blade Platforms
Arkema’s Elium chemistry enables 100% recyclability through depolymerization without fibre property loss, achieving 90% recovery rates in pilot lines at the University of Sydney[2]University of Sydney, “Closed-Loop Recycling of Thermoplastic Wind Turbine Blades,” sydney.edu.au. Westlake Corporation’s rotor concept similarly separates matrix and fibre for reuse, lowering life-cycle emissions. Advances in APA-6 and CBT resin systems permit room-temperature infusion and faster cure cycles, trimming energy demand. Nonetheless, scaling thermoplastics for 100-m-plus structures necessitates press systems with tighter temperature uniformity and higher tonnage, sustaining capex hurdles that slow widespread adoption.
Restraint Impact Analysis*
| Restraint | (~) % Impact on CAGR Forecast | Geographic Relevance | Impact Timeline |
|---|---|---|---|
| High research and development and tooling CAPEX | -1.2% | Global, with highest impact in emerging markets | Medium term (2-4 years) |
| Recycling & landfill-ban compliance costs | -0.8% | Europe and North America leading, expanding globally | Long term (≥ 4 years) |
| Concerns regarding the durability and fire resistance of some composite materials | -0.6% | Global, with particular focus on offshore wind and marine applications | Short term (≤ 2 years) |
| Source: Mordor Intelligence | |||
High Research and Development and Tooling CAPEX
Automated fibre-placement lines cost USD 5–10 million each, while molds for >100 m blades exceed USD 2 million per set, tying up capital for years before payback. Certification programs often run 5-7 years, stretching working-capital needs for mid-tier innovators. Hexcel’s USD 300 million bond issue in 2025 exemplifies the financial firepower required to retain process-technology leadership. Thermoplastic adoption compounds costs, since ovens, presses, and welding equipment differ from thermoset lines, creating parallel asset footprints that hamper small manufacturers’ competitiveness.
Recycling & Landfill-Ban Compliance Costs
EU directives and China’s 2024 recycling mandate make producers responsible for end-of-life blades, lifting operating costs by 2-3 times relative to landfill fees, where disposal remains legal. Pyrolysis and solvolysis plants need multimillion-dollar investments, yet feedstock purity varies, undermining predictable returns. Carbon Rivers’ glass-fibre reclamation route shows industrial viability but requires steady blade-supply contracts to reach scale. Divergent regional rules complicate compliance strategies for global OEMs and add uncertainty to long-range budgeting across the composite materials in the renewable energy market.
*Our forecasts treat driver/restraint impacts as directional, not additive. The impact forecasts reflect baseline growth, mix effects, and variable interactions.
Segment Analysis
By Fibre Type: Carbon Fibre Expands Premium Niches
The segment generated the largest revenue contribution in 2025, when GFRP held 54.70% of composite materials in the renewable energy market share. Carbon fibre’s 8.39% CAGR reflects rotor diameters that eclipse 120 m, where stiffness and fatigue performance justify its 5-10× cost premium. SGL Carbon’s supply agreements for 80 m-plus blades illustrate vertical moves into energy from aerospace. Fibre-hybrid lay-ups blending basalt and natural fibre reduce embodied carbon yet maintain required modulus, expanding options for mid-range turbine classes. Bio-based lignin fibre research in Germany offers a future cost-reduction lever, although commercial volumes remain limited. Recycled carbon fibre is steadily integrating into secondary structures as mechanical recycling preserves 60-70% original tensile strength, further diversifying feedstocks and tempering raw material price swings.


By Resin Matrix: Bio-Resins Gain Momentum
Epoxy maintained a 45.20% revenue share in 2025 thanks to mature supply chains and high fatigue resistance. Yet bio-resins and recycled resins are expanding at an 7.88% CAGR as OEMs race to satisfy circular-economy mandates. Dow and Vestas have qualified polyurethane spar-cap chemistries that enable rapid pultrusion while elevating interlaminar toughness. Sicomin’s SGi 128 bio-epoxy gel coat demonstrates fire-safe solutions with 35% renewable content. Thermoplastic matrices such as Elium offer the added benefit of repairability and melt recycling, pivoting the composite materials in the renewable energy market toward closed-loop economics.
By Manufacturing Process: Automation Redefines Cost Curves
Vacuum infusion delivered 33.75% of 2025 revenue, retaining primacy for 50-plus-meter blades due to favorable glass-volume fraction and low volatile-organic emissions. Automated fibre placement, robotic filament winding, and 3D printing represent the fastest-growing cluster at a 7.75% CAGR. National Renewable Energy Laboratory prototypes show that additive nacelle covers reduce waste by 20% and cycle time by 35% versus hand lay-up. Solvay’s robotic winding cell achieves 100 m/min deposition, eliminating manual defects. AI-driven cure-cycle control lowers scrap rates, supporting stable throughput despite material batch variability. These shifts recalibrate cost bases and reinforce the competitive edge of well-capitalized plants across the composite materials in the renewable energy market.
By Application: Wind Dominates, Hydrogen Storage Surges
Wind turbines accounted for 55.40% of 2025 sales, yet green-hydrogen storage, tidal devices, and floating photovoltaics are growing at 7.60% CAGR. Composite type-IV and emerging type-V tanks permit 700-bar storage with gravimetric densities outperforming steel by nearly 65%, making them essential for distributed hydrogen refueling stations. AC Marine & Composites’ blade deal for Orbital Marine’s 2 MW tidal unit underscores marine adoption. Floating solar deployments in Southeast Asia and the Middle East demand lightweight, corrosion-proof pontoons that withstand biofouling and UV exposure, tilting procurement toward thermoplastic composites.
Geography Analysis
Asia-Pacific commanded 44.30% of the composite materials in the renewable energy market size in 2025 and is on track for an 8.03% CAGR through 2031. China anchors the region with end-to-end supply chains, yet its 2024 recycling standards raise compliance costs that favor integrated local champions. India’s USD 2.4 billion Hydrogen Mission and defense-sector carbon-fibre push reinforce domestic production incentives. Japan’s perovskite roadmap aims for 38.3 GW by 2040 via flexible composite substrates, a pivot that may recalibrate global solar module architectures. South Korea leverages shipbuilding know-how to enter offshore wind composites, while Australia tests floating solar on inland reservoirs, showcasing regional diversity in end-use cases.
North America benefits from USD 369 billion of Inflation Reduction Act funding, with domestic-content bonuses catalyzing plant expansion in Texas, New York, and Ontario. GE Vernova’s USD 600 million manufacturing buildout exemplifies reshoring moves that cut trans-Pacific logistics risk. Canada’s aerospace-composite cluster supports the transfer of out-of-autoclave methods to tidal-turbine shells, while Mexico’s cost-competitive labor pool draws pultruders for solar-rack exports. The region’s challenge is scaling fibre production to prevent over-dependence on imports, a gap several joint ventures aim to close by 2027.
Europe wields regulatory clout, steering global norms on recyclability and embodied carbon. The ZEBRA project’s thermoplastic blade success positions the continent as a technology frontrunner. Germany’s lignin-fibre pilot lines symbolize R&D leadership, whereas France leverages aerospace heritage to refine high-modulus prepregs. The UK National Composites Centre’s SusWIND program validates multiple recycling routes, giving OEMs design flexibility. Offshore wind buildout in the North Sea and Baltic drives sustained fibre demand, though high energy costs compel automation to defend margins.

Competitive Landscape
The composite materials in the renewable energy market exhibit moderate fragmentation. Sustainability remains a key driver, accelerating R&D in bio-resins and blade recyclability. Strategic moves, such as Toray’s acquisition of a Dutch prepreg line and Owens Corning’s investment in thermoplastic recycling, emphasize vertical integration and alignment with circular-economy mandates. Established leaders maintain a competitive edge through scale in raw-fibre procurement and global qualification data sets, despite potential disruption from new technologies like rapid-cure thermoplastics and AI-enabled process control.
Composite Materials In Renewable Energy Industry Leaders
TEIJIN LIMITED
TORAY INDUSTRIES, INC.
Owens Corning
Gurit Services AG
Hexcel Corporation
- *Disclaimer: Major Players sorted in no particular order

Recent Industry Developments
- September 2024: Kineco Exel Composites India secured a contract to manufacture pultruded carbon fibre planks for Vestas Wind Systems. Deliveries are expected to commence in late 2025 from a newly established facility in Goa, India.
- June 2023: Solvay announced the future names of its independent publicly traded entities, following its planned separation first reported in March 2022. The new names, "Solvay" and "Syensqo," will become effective upon the completion of the separation, which was anticipated by December 2023, subject to customary conditions. Syensqo will encompass the company’s composites business.


Research Methodology Framework and Report Scope
Market Definitions and Key Coverage
Our study defines the composite materials in renewable energy market as the yearly factory-gate value of glass, carbon, and hybrid fiber reinforced polymer systems that are built into new wind turbine blades and nacelles, solar panel frames and trackers, small hydro runner assemblies, plus emerging hydrogen-storage and grid-storage pressure vessels. The estimate tracks material sales only, not the finished generation assets, which lets us isolate the true composites demand curve that equipment builders face.
Scope Exclusions: Refurbishment parts, legacy fiberglass insulation, and composites used in electric vehicles or civil infrastructure lie outside the present scope.
Segmentation Overview
- By Fibre Type
- Glass-Fibre-Reinforced Plastics (GFRP)
- Carbon-Fibre-Reinforced Plastics (CFRP)
- Fibre-Reinforced Polymers (FRP)
- Other Fibre Types (Hybrid and Other Fibres, etc.)
- By Resin Matrix
- Epoxy
- Polyester
- Polyurethane
- Thermoplastic
- Bio-resins and Recycled Resins
- By Manufacturing Process
- Vacuum Infusion
- Prepreg/Autoclave
- Pultrusion
- Automated Fibre Placement / 3-D Printing
- Compression Moulding (SMC, BMC)
- By Application
- Wind Power
- Solar Power
- Hydroelectricity
- Other Applications (Green-Hydrogen & Energy-Storage Vessels)
- By Geography
- Asia-Pacific
- China
- India
- Japan
- South Korea
- Rest of Asia-Pacific
- North America
- United States
- Canada
- Mexico
- Europe
- Germany
- United Kingdom
- France
- Italy
- Rest of Europe
- South America
- Brazil
- Argentina
- Rest of South America
- Middle East and Africa
- Saudi Arabia
- South Africa
- Rest of Middle East and Africa
- Asia-Pacific
Detailed Research Methodology and Data Validation
Primary Research
Mordor analysts interviewed wind-blade manufacturers, solar tracker fabricators, epoxy formulators, and regional trade groups across Asia-Pacific, Europe, and North America. Conversations tested preliminary density-per-megawatt ratios, verified average selling prices, and highlighted recycling mandates that could alter resin demand.
Desk Research
We began with energy installation and capacity build-out statistics from sources such as the International Energy Agency, the Global Wind Energy Council, and the US Energy Information Administration, which outline megawatt additions by technology. Company filings retrieved through D&B Hoovers, customs shipment data from Volza, and patent trends accessed via Questel then helped us map average composite usage per megawatt and resin mix shifts. Academic papers from journals like Composites Science and Technology clarified density and yield factors, while National Renewable Energy Laboratory white papers illustrated cost learning curves. The list above is illustrative; several other open and subscription datasets supported data checks and context.
Market-Sizing & Forecasting
A top-down build converts announced renewable capacity additions into composite demand through material-intensity coefficients, which are then cross-checked with sampled supplier revenue roll-ups for plausibility. Key variables include new onshore and offshore wind capacity (GW), average blade length trends, composite content per solar MW, resin price indices, and carbon-fiber penetration rates. Multivariate regression, supported by ARIMA validation on historical installations, projects each driver to 2030. Gap years without public data are filled using linear interpolation moderated by primary-research sentiment.
Data Validation & Update Cycle
Every draft model passes an anomaly screen, variance checks against third-party energy data, and a two-analyst peer review before sign-off. Reports refresh yearly, and material policy shifts trigger interim updates, so clients always receive the latest view.
Why Mordor's Composite Materials In Renewable Energy Baseline Commands Reliability
Published estimates often diverge because firms pick different energy scopes, price assumptions, and update cadences.
Key gap drivers include whether refurbished parts are counted, how aggressively future blade lengths are modeled, and the breadth of end-use segments folded into totals.
Mordor limits the scope to original equipment demand, applies region-specific ASP curves, and refreshes inputs annually, yielding a balanced baseline.
Benchmark comparison
| Market Size | Anonymized source | Primary gap driver |
|---|---|---|
| USD 10.16 B | Mordor Intelligence | - |
| USD 16.00 B | Global Consultancy A | Adds replacement parts and bioenergy vessels, inflating base |
| USD 13.28 B | Sector Specialist B | Focuses on wind-blade composites only; omits solar and hydro use, applies uniform ASP uplift |
These comparisons show that once differing scopes and price ladders are stripped away, Mordor's disciplined, annually refreshed approach provides the most dependable starting point for strategic decisions.


Key Questions Answered in the Report
What is the current Composite Materials in Renewable Energy Market size?
The Composite Materials in Renewable Energy Market size is USD 10.97 billion in 2026 and is on course to hit USD 16.12 billion by 2031 at an 7.99% CAGR.
Which application has the biggest share in Composite Materials in Renewable Energy Market?
Wind power accounts for 55.40% of current sales, reflecting the sheer scale of global onshore and offshore installations.
Which is the fastest growing region in Composite Materials in Renewable Energy Market?
Asia Pacific is estimated to grow at the highest CAGR over the forecast period (2026-2031).
How are governments influencing the market’s trajectory?
Policies such as the U.S. Inflation Reduction Act, China’s green-factory rules, and India’s Hydrogen Mission provide financial incentives and domestic-content requirements that spur regional composite production.
Page last updated on:


