Commercial Vehicles Tires Market Size and Share
Market Overview
| Study Period | 2019 - 2031 |
|---|---|
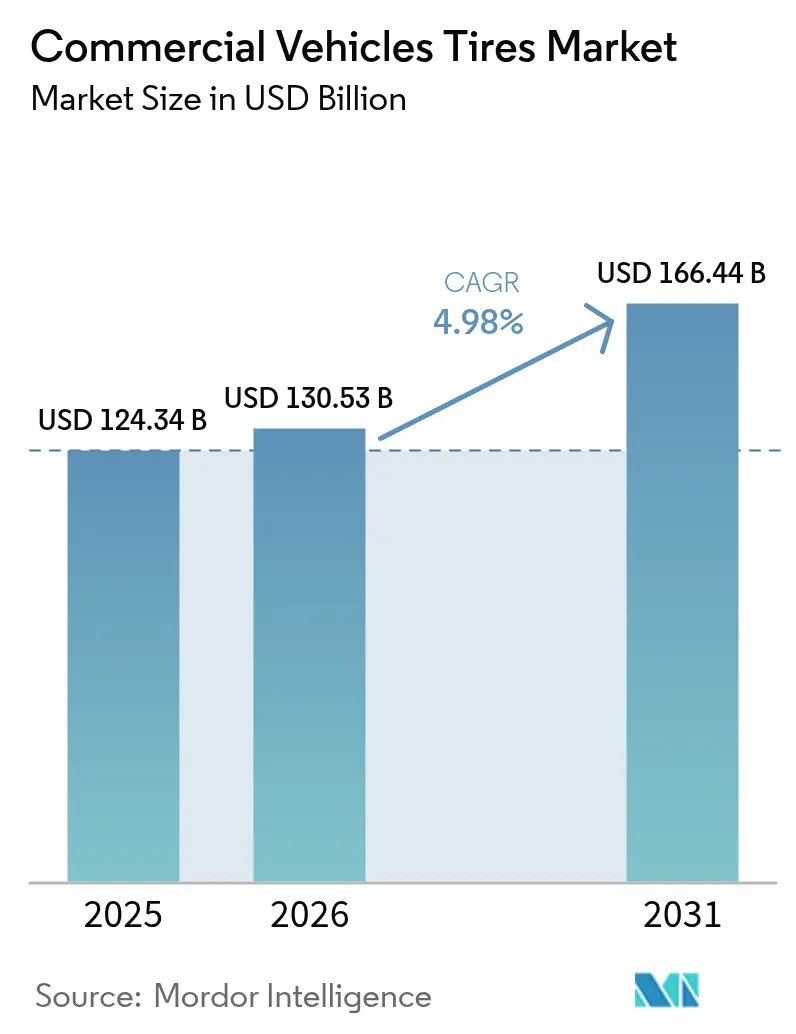
| Market Size (2026) | USD 130.53 Billion |
| Market Size (2031) | USD 166.44 Billion |
| Growth Rate (2026 - 2031) | 4.98% CAGR |
| Fastest Growing Market | Asia Pacific |
| Largest Market | North America |
| Market Concentration | Medium |
Major Players
*Disclaimer: Major Players sorted in no particular order Image © Mordor Intelligence. Reuse requires attribution under CC BY 4.0. |
|
Commercial Vehicles Tires Market Analysis by Mordor Intelligence
The Commercial Vehicles Tires Market size is expected to increase from USD 124.34 billion in 2025 to USD 130.53 billion in 2026 and reach USD 166.44 billion by 2031, growing at a CAGR of 4.98% over 2026-2031. Growth in the commercial vehicle tires market is being driven by persistent e-commerce parcel density, infrastructure-led construction haulage, and rapid radialization in emerging economies, which are reshaping fleet procurement strategies. OEMs and leading tire makers are embedding telematics in new fitments to validate fuel-efficiency gains, a move that is pushing premium tire adoption even among cost-sensitive operators. At the same time, aftermarket channels still dominate volumes because independent service networks remain the backbone of commercial fleet maintenance in South America, Africa, and large parts of Asia. Competitive dynamics are bifurcating: global majors are scaling data-driven tire-as-a-service bundles. At the same time, low-cost manufacturers from China and India undercut on landed cost, especially in Africa and Southeast Asia.
Key Report Takeaways
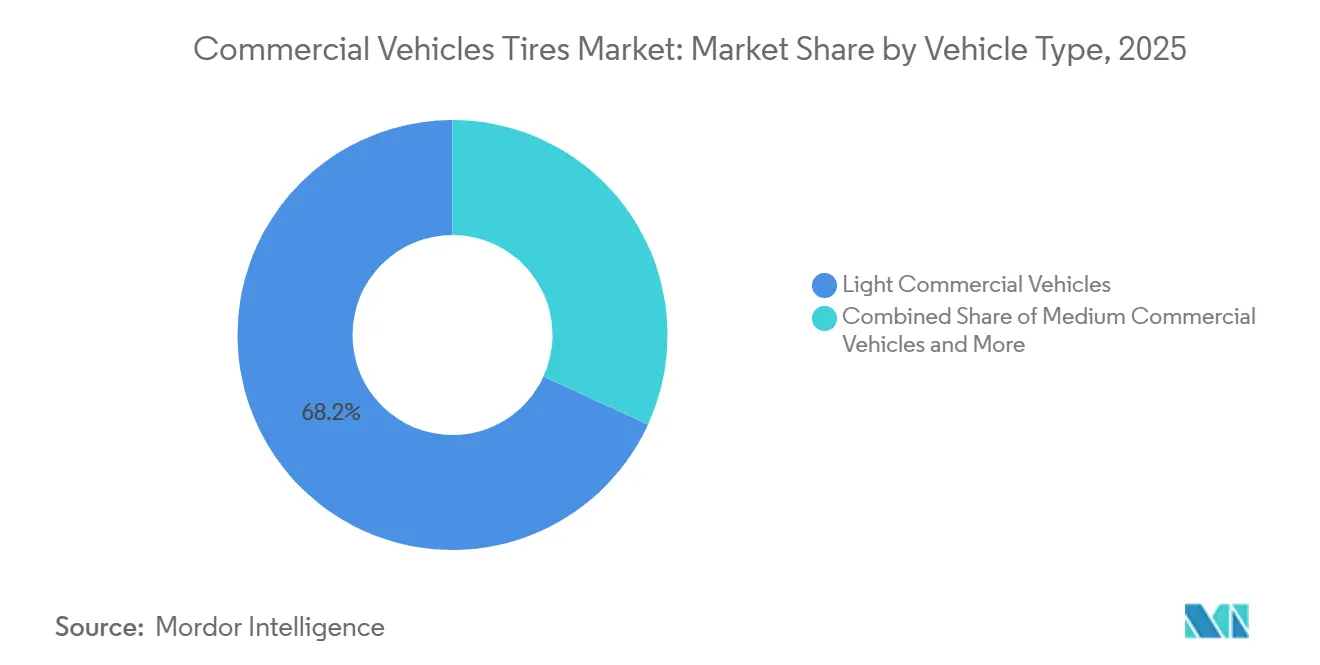
- By vehicle type, light commercial vehicles accounted for 68.17% of 2025 revenue in the commercial vehicle tires market share, and heavy commercial vehicles are projected to register a 5.30% CAGR through 2031, the fastest among all vehicle classes.
- By tire type, radial products dominated with 87.71% of the 2025 commercial vehicle tire market share. The radial category is also expected to advance at a 5.21% CAGR through 2031, leading growth within the segment.
- By application, cargo transportation accounted for 74.31% of the 2025 commercial vehicle tire market share. Construction use is forecast to expand at a 5.98% CAGR during 2026-2031, the quickest among all applications.
- By sales channel, the aftermarket segment accounted for 73.37% of the 2025 commercial vehicle tire market share. OEM fitments are projected to grow at a 5.09% CAGR to 2031, outpacing other channels.
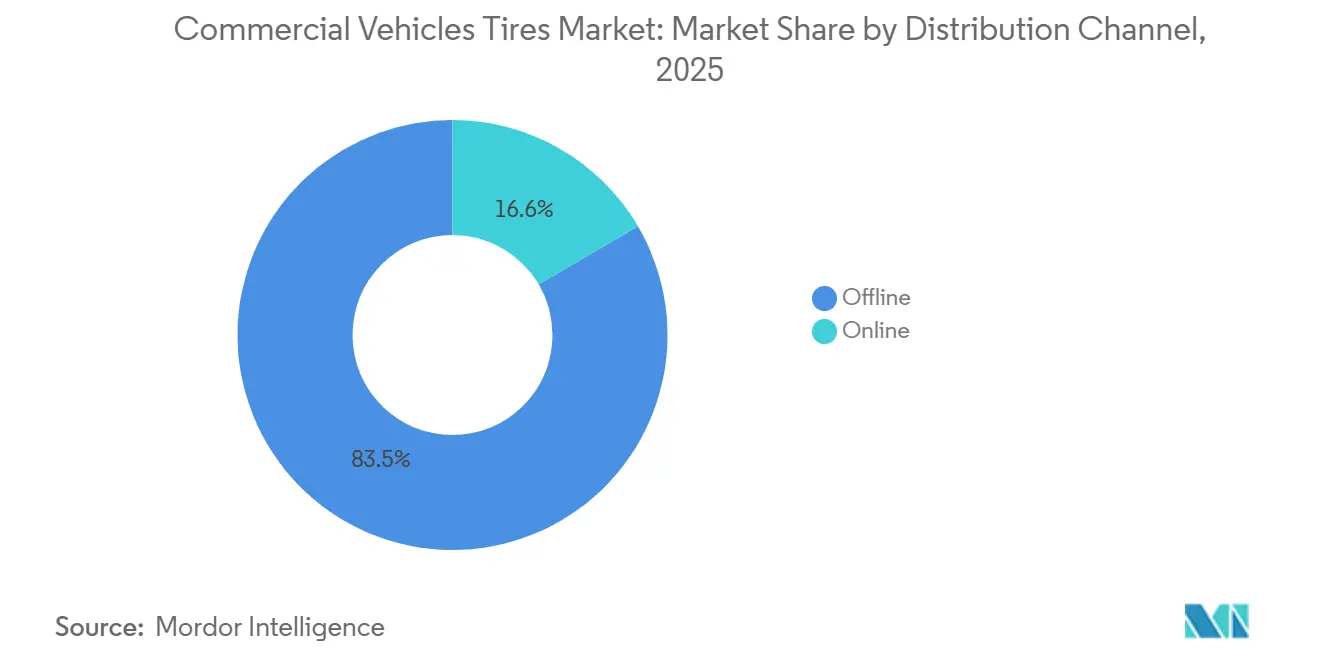
- By distribution channel, offline outlets accounted for 83.45% of the 2025 commercial vehicle tire market share. Online platforms are expected to rise at a 7.23% CAGR through 2031, the highest among distribution modes.
- By price category, economy tires accounted for 39.82% of 2025 revenue in the commercial vehicle tire market. Premium tires are projected to deliver a 5.80% CAGR over 2026-2031, leading growth across price tiers.
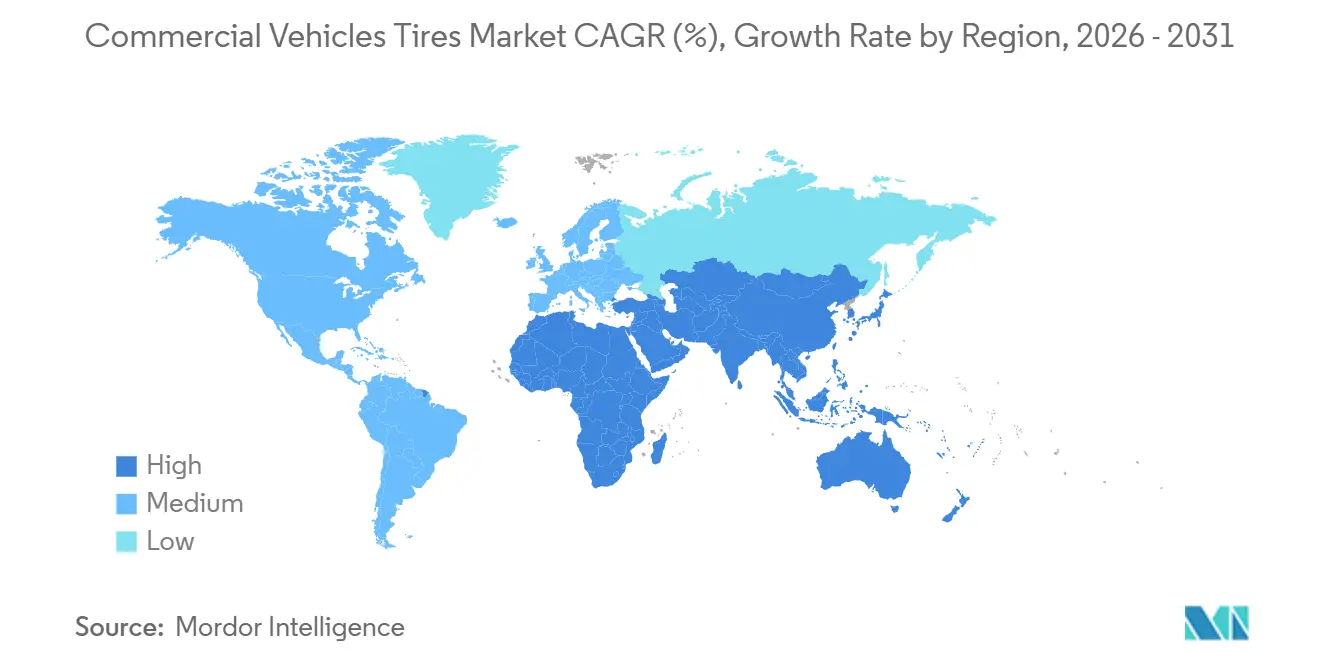
- By geography, North America dominated with 55.21% of the 2025 value, but Asia-Pacific is advancing at a 5.18% CAGR through 2031.
Note: Market size and forecast figures in this report are generated using Mordor Intelligence’s proprietary estimation framework, updated with the latest available data and insights as of 2026.
Global Commercial Vehicles Tires Market Trends and Insights
Drivers Impact Analysis*
| Driver | (~) % Impact on CAGR Forecast | Geographic Relevance | Impact Timeline |
|---|---|---|---|
| E-Commerce Drives Last-Mile Deliveries | +1.2% | Global, with concentration in North America, Europe, and Asia Pacific urban centers | Short term (≤ 2 years) |
| Fleet Modernization and Radialization Grow | +0.9% | India, Southeast Asia, Latin America, Eastern Europe | Medium term (2-4 years) |
| Infrastructure Spending Expands Haulage Fleets | +0.8% | Asia Pacific core, spill-over to MEA and South America | Medium term (2-4 years) |
| Global Logistics Corridors Expand | +0.7% | Belt and Road Initiative regions, India-Middle East-Europe corridor | Long term (≥ 4 years) |
| Tire-as-a-Service Subscriptions Rise | +0.6% | North America and EU, early adoption in developed Asia Pacific markets | Medium term (2-4 years) |
| Telematics Boosts Premium Tire Demand | +0.5% | Global, led by North America and Europe | Short term (≤ 2 years) |
| Source: Mordor Intelligence | |||
Rising E-Commerce Last-Mile Deliveries Boost LCV Tire Demand
Same-day and next-day delivery networks have surged, boosting LCV utilization rates significantly compared to traditional fleets. This shift has shortened tire life in dense urban corridors from an average of several years to a much shorter duration. Amazon expanded its Delivery Service Partner network to encompass a large number of global operators, introducing thousands of vans [1]"Amazon to expand Prime delivery services in smaller cities", Reuters, reuters.com. Collectively, these vans demand a substantial volume of tires annually. FedEx allocated significant funds to procure electric LCVs, driving up demand for tires that can support heavier curb weights and handle instant-torque loads. Data from DHL reveal that Asian fleets replace tires more frequently per vehicle each year than European fleets, highlighting the influence of road quality on tire wear patterns. The market is gravitating towards specific tire sizes, which together account for a majority of global LCV fitments. Thus, the commercial vehicle tire market is closely attuned to the surge in parcel-delivery traffic in major urban hubs.
Fleet Modernization and Radialization in Emerging Markets
Mandates tied to Bharat Stage VI in India and comparable norms in Southeast Asia push carriers to swap bias tires for radials that trim fuel use and extend mileage. This move significantly increased the nation's radialization rate, creating a notable wave of replacements as aging bias-ply stock was phased out. Apollo Tyres reported a surge in domestic radial volumes, signaling robust commercial demand, especially as financing hurdles diminish. In Brazil, Bridgestone, in collaboration with Banco do Brasil, offered zero-interest financing, facilitating a substantial number of radial tire upgrades in a short period. While interest in radials is gaining traction across West Africa, the region's subpar road conditions dampen the anticipated fuel-savings benefits. Despite these challenges, the commercial vehicle tire market is witnessing a surge in demand for longer-lasting radials, bolstered by expanding unit margins driven by the technology's performance premium.
Infrastructure Spending Expands Construction Haulage Fleets
China, India, and Gulf economies have pledged significant investments in roads, ports, and energy projects, directly boosting the demand for heavy-duty tires used in dump trucks and concrete mixers. China's development plan allocated a substantial amount specifically for transport projects. Bridgestone’s upgrade of its Kitakyushu plant adds large-rim capacity tailored to this segment [2]“MasterCore Mining Tire Series Whitepaper,” Bridgestone Corporation, Bridgestone.com . Meanwhile, in North America, infrastructure investment initiatives are bolstering demand, even as the housing market shows signs of cooling. Notably, freight ton-miles for construction materials have risen significantly.
Expansion of Global Logistics Trade Corridors
Megaprojects like the Belt and Road and the India-Middle East-Europe Economic Corridor create contiguous freight lanes that require high-durability, long-haul tires. Carriers negotiating desert heat or alpine cold value tread formulas engineered for route-specific extremes. Tire makers add service points and retread workshops at logistic hubs to secure retainer contracts over product life cycles. Corridor development also prompts local joint ventures that lower lead times and import duties, reinforcing global supply chain resilience. As traffic scales, harmonized quality standards across borders further favor established brands with multi-regional SKUs.
Restraints Impact Analysis*
| Restraint | (~) % Impact on CAGR Forecast | Geographic Relevance | Impact Timeline |
|---|---|---|---|
| Rising Rubber and Crude Prices Increase Costs | -0.4% | Global, particularly affecting price-sensitive emerging markets | Short term (≤ 2 years) |
| Stricter Emission and Disposal Rules | -0.3% | Europe, North America, with gradual expansion to Asia Pacific | Medium term (2-4 years) |
| Low-Rolling-Resistance Tires Delay Replacement | -0.3% | Global, with pronounced impact in developed markets adopting premium tires | Medium term (2-4 years) |
| Retread Competition Reduces New-Tire Demand | -0.2% | Emerging markets, particularly price-sensitive commercial fleet segments | Short term (≤ 2 years) |
| Source: Mordor Intelligence | |||
Volatile Natural Rubber and Crude Prices Inflate Input Costs
Natural rubber prices surged, while crude oil prices fluctuated widely. These movements squeezed gross margins for most tire manufacturers. In response to raw-material inflation, Michelin increased its list prices in Europe and South America. However, smaller manufacturers with limited hedging capabilities experienced more significant margin erosion. For instance, Apollo Tyres experienced a notable decline in EBITDA despite increased volumes. Fleets adapted by deferring purchases and boosting retreading efforts. Many Brazilian operators chose to postpone new tire purchases, opting instead for regrooving. Such price fluctuations not only compress replacement cycles but also temper growth in the commercial vehicle tires market during inflationary periods.
Stricter Emission and Disposal Regulations on Tire Makers
New EU rules on labeling and producer responsibility push for more recycled content and clearer end-of-life tracking. To comply, companies are investing in new mixing lines for devulcanized crumb and redesigning products for easier recycling. Larger manufacturers, with their heftier R&D budgets, can better absorb these costs than their smaller counterparts, making it easier for them to enter the market. Meanwhile, North American states are rolling out similar regulations, and advanced economies in APAC are hinting at alignment, amplifying the global cost impact. Interestingly, these regulations are also boosting retreading volumes, as the reuse of carcasses helps meet circularity goals.
*Our forecasts treat driver/restraint impacts as directional, not additive. The impact forecasts reflect baseline growth, mix effects, and variable interactions.
Segment Analysis
By Vehicle Type: LCVs Drive Market Volume
In 2025, light commercial vehicles (LCVs) commanded a dominant 68.17% share of the market, buoyed by the surge in e-commerce parcel deliveries. However, heavy commercial vehicles (HCVs) are projected to outpace LCVs, growing at a robust 5.30% CAGR. This trend indicates a notable shift in the commercial vehicle tires market. LCVs predominantly favor specific tire dimensions, benefiting from economies of scale in manufacturing. Meanwhile, medium commercial vehicles (MCVs) are closely aligned with GDP growth in emerging markets. HCV adoption is on the rise, driven by highway expansions and stringent emission regulations, leading to the retirement of older tractor fleets.
HCV purchasers are increasingly leaning towards wide-base single tires, which can significantly reduce rig weight. This not only enhances fuel efficiency but also increases payload capacities. Bridgestone’s M860 made a significant mark, securing a notable share of the North American HCV replacement market in its debut year, underscoring the demand for long-lasting tires. In regions like India and Southeast Asia, government-sponsored credit initiatives are facilitating HCV upgrades. These upgrades not only add multiple tire positions per vehicle but also amplify the overall demand. With electric truck prototypes set to transition from pilot fleets post-2027, tire designs that can handle instant torque are poised to redefine the commercial vehicle tires landscape.


By Tire Type: Radial Dominance Faces Solid Tire Disruption
Radials already command 87.71% share and are advancing at 5.21% CAGR, underpinning the commercial vehicle tires market share premium enjoyed by global majors. While bias tires, known for their puncture resistance, dominate off-road mining and agricultural sectors, their prevalence is declining annually in OECD countries. Solid tires, primarily used in forklifts and port straddle carriers, cater to a niche market. This segment remains stable, bolstered by investments in warehouse automation.
Emerging markets play a crucial role: In recent years, India has seen significant growth in radial tire penetration, with projections suggesting further increases contingent on improved access to financing. Michelin's X Multi Energy D tire, tailored for electric trucks, showcased an extended range during DHL's trials. This underscores the alignment of radial tire advancements with global decarbonization goals. Given that radial casings boast a longer lifespan and are amenable to retreading, there's a noticeable shift in aftermarket revenue towards service-oriented models. This trend is propelling the commercial vehicle tire market towards more lifecycle contracts.
By Application: Mining Emerges as Growth Leader
Cargo transport accounted for 74.31% of 2025 demand and will remain dominant as global freight ton-miles expand with nearshoring and omni-channel retail. Construction, however, is the fastest-growing segment, with a 5.98% CAGR amid infrastructure outlays across Asia-Pacific and the Middle East. Public transit, mining, and agriculture form smaller pools tied to government procurement cycles and commodity prices.
By 2030, China's Belt and Road projects are set to deploy a significant number of construction vehicles, each consuming multiple tires annually. Within months of its rollout, Goodyear's Fuel Max secured a notable market share in the Middle East, underscoring operators' readiness to invest in reducing downtime. From Paris to Singapore, cities are now mandating low-noise tires for electric buses. This push is prompting suppliers to design tread blocks that not only reduce rolling sound but also meet wet-grip standards. Such specialized niches are broadening the commercial vehicle tires market, moving it beyond a sole focus on freight.
By Sales Channel: Aftermarket Dominance with OEM Acceleration
Aftermarket networks accounted for 73.37% of 2025 sales, anchoring volume leadership in the commercial vehicle tires market. Independent dealers thrive in markets with aging, fragmented fleets, particularly in Africa and South America, where 80-85% of purchases occur outside OEM channels. Yet OEM fitments are rising at a 5.09% CAGR as tire makers lock in multiyear TaaS deals at the point of vehicle purchase.
Truck builders in North America and Europe are increasingly pairing tires with telematics. For instance, Bridgestone inked a deal with Daimler Truck covering Freightliner Cascadia EVs over several years. Meanwhile, in China, the OEM's market share is gradually rising, thanks to factory-installed TPMS. These systems, which depend on brand-specific sensors, drive aftermarket purchases. Digital platforms such as TireConnect are shaking up the industry by standardizing pricing, squeezing distributor margins, and offering same-day delivery, directly challenging traditional physical outlets. This evolving hybrid landscape is significantly altering the economics for retailers in the broader commercial vehicle tires market.
By Distribution Channel: Digital Disruption of Traditional Networks
Offline distribution retained an 83.45% share in 2025 due to mandatory installation services, yet online channels are increasing at a 7.23% CAGR. Metropolitan areas with dense logistics infrastructure support four-hour delivery windows, a service model popular among fleets of 10-50 vehicles seeking transparent pricing.
In its inaugural year of offering next-day delivery in collaboration with Goodyear and Michelin, Amazon Business secured an estimated share of the U.S. commercial volume. In the forecast period, Alibaba processed significant B2B tire transactions, underscoring a shift in cross-border supply in the commercial vehicle tire market. While last-mile economics pose challenges for wide-base truck tires outside major hubs, offline outlets will remain vital in peri-urban areas. However, as digital transparency rises, it compresses channel margins, compelling brick-and-mortar dealers to enhance their offerings with value-added services, like wheel alignment contracts.
By Price Category: Premium Segment Gains Momentum
Economy-tier products accounted for 39.82% of 2025 revenue, underscoring the importance of low upfront costs across fragmented fleets. In contrast, premium tires are expanding at a 5.80% CAGR as telematics capture the lifecycle savings narrative. In Africa and South America, budget lines flourish as high interest rates stifle financing for capital expenditure, while Chinese entrants offer significantly lower prices than their competitors.
Continental’s ContiConnect demonstrated that premium tires can reduce the total tire cost per kilometer. This finding convinced enterprise fleets to make the switch, even in the face of a notable price difference. Due to EU fuel-efficiency regulations, Michelin’s X Line Energy captured a significant share of the European long-haul market. Yet ZC Rubber and Linglong are still clinching deals with smaller fleets, leveraging aggressive payment terms in markets strained by cash flow constraints. This dynamic, with its two-tiered coexistence, shapes the pricing landscape of the commercial vehicle tires market.
Geography Analysis
North America accounts for a 55.21% share in the 2025 global value, its dominance underpinned by Class 8 long-haul freight and early adoption of tire-as-a-service among mega-fleets like J.B. Hunt. In 2025, freight ton-miles rose, buoyed by nearshoring's impact on cross-border traffic. Meanwhile, many cold-chain fleets, benefiting from low-rolling-resistance technology, are now extending their replacement intervals. In Canada, seasonal winter regulations lead to quarterly demand spikes, with a significant share of trucks in Ontario and Quebec using dedicated snow tires. Additionally, Goodyear experienced growth in construction tire sales in 2025, due to U.S. infrastructure projects funded by the IIJA.
Asia-Pacific is expected to be the fastest-growing region, with a 5.18% CAGR. China accounted for a significant share of commercial vehicles, while India experienced notable growth in domestic sales [3]“Commercial Vehicle Sales 2025,”, Society of Indian Automobile Manufacturers, siam.in. Government mandates and the expansion of e-commerce fleets, with Lazada and Shopee operating a substantial number of vans, are driving these volumes. However, with retread penetration exceeding a considerable percentage in heavy-duty segments, the demand for new tires is tempered. Japan and South Korea, while primarily focused on replacements, are also testing grounds for EV-specific tires.
Europe accounted for a significant share of the global market value. Stricter labeling laws boosted LRR penetration to a high percentage, enabling premium suppliers to command higher margins. Germany's shift towards electric trucks, with a notable share of new sales electrified, has spurred collaborations such as the Continental-Daimler partnership to optimize for higher load factors. Following Brexit, the U.K. saw a decline in long-haul volumes compared to pre-Brexit levels, prompting a pivot in tire demand toward shorter domestic routes. In South America, Brazil's decline in new truck sales impacted OEM volumes, yet the aftermarket retreading remained resilient. The Middle East and Africa, despite their smaller size, witnessed robust double-digit growth in construction and mining fleets. Notably, the UAE's construction tire consumption surged significantly in anticipation of Expo 2030. These diverse regional trends illustrate the resilience of the commercial vehicle tire market amid economic fluctuations.

Competitive Landscape
The commercial vehicle tires market is dominated by a premium tier—comprising Bridgestone, Michelin, Continental, and Goodyear—that commands a significant share of the global value. In contrast, the fragmented budget segment is led by players such as ZC Rubber, Giti, Apollo, and MRF. The premium leaders are making significant investments in R&D. For instance, Michelin has focused on low-rolling-resistance and EV-specific compounds, thereby safeguarding its technical advantages. Meanwhile, Bridgestone made headlines with its acquisition of Webfleet, granting it proprietary telematics. This move enables Bridgestone to offer bundled tire-and-software packages, enhancing loyalty among fleet operators.
On the other hand, budget suppliers are leveraging large-scale manufacturing in cost-effective regions. A case in point is ZC Rubber's expansion in Thailand, where it aims for a substantial boost by strategically targeting tariff-protected ASEAN markets. In India, Apollo and MRF are attracting smaller fleets by pricing their offerings lower than their tier-one competitors. While technological advancements are becoming more uniform across the board, regulatory differences still create a divide in product offerings. For instance, tires destined for the EU must meet stringent noise and rolling-resistance standards, whereas in emerging markets, the focus is more on puncture resistance than efficiency.
There's a growing potential in the realms of electric truck tires and subscriptions for mid-sized fleets, both of which currently lack a clear market leader. Continental's ContiConnect, which oversees a significant number of commercial tires worldwide, has demonstrated a notable reduction in downtime for pilot fleets. This underscores the notion that, in today's market, it's data—not sheer rubber volume—that enhances profit margins. Looking ahead, the integration of technology, expansion of regional capacities, and a shift towards service-based revenue models are poised to shape the competitive landscape of the commercial vehicle tires market.
Commercial Vehicles Tires Industry Leaders
-
Bridgestone Corporation
-
Continental AG
-
The Goodyear Tire & Rubber Company
-
Hankook Tire & Technology
-
Yokohama Rubber Co., Ltd.
- *Disclaimer: Major Players sorted in no particular order


Recent Industry Developments
- May 2025: Balkrishna Industries Ltd, India's top off-highway tire manufacturer, aims to more than double its revenue by the decade's end. This ambitious target is driven by strategic moves, including ramping up sales in its core off-highway tire and carbon black segments, and making inroads into the premium passenger car and commercial vehicle radial tire markets.
- February 2025: Goodyear Tire & Rubber Company has unveiled its latest offering: the Cooper® WORK Series™ Regional Haul All-position (RHA) 2 tire. Designed specifically for super-regional and regional commercial vehicles, the SmartWay*-verified RHA 2 promises extended mileage and consistent wear, catering to the expanding super-regional commercial vehicle market.


Global Commercial Vehicles Tires Market Report Scope
The commercial vehicle tires market report is segmented by vehicle type (LCVs, MCVs, and HCVs), tire type (radial, bias, and solid), application (cargo, public transit, construction, mining, and agriculture), sales channel (OEM and aftermarket), distribution (online and offline), price (budget, economy, premium), and geography (North America, South America, Europe, Asia-Pacific, MEA). Market forecasts are provided in value (USD) and volume (units).
| Light Commercial Vehicles (LCVs) |
| Medium Commercial Vehicles (MCVs) |
| Heavy Commercial Vehicles (HCVs) |
| Radial Tires |
| Bias Tires |
| Solid Tires |
| Cargo Transportation |
| Public Transportation |
| Construction |
| Mining |
| Agriculture |
| OEM |
| Aftermarket |
| Online |
| Offline |
| Budget |
| Economy |
| Premium |
| North America | United States |
| Canada | |
| Rest of North America | |
| South America | Brazil |
| Argentina | |
| Rest of South America | |
| Europe | Germany |
| United Kingdom | |
| France | |
| Italy | |
| Spain | |
| Rest of Europe | |
| Asia-Pacific | China |
| India | |
| Japan | |
| South Korea | |
| Rest of Asia-Pacific | |
| Middle East and Africa | United Arab Emirates |
| Saudi Arabia | |
| South Africa | |
| Turkey | |
| Rest of Middle East and Africa |
| By Vehicle Type | Light Commercial Vehicles (LCVs) | |
| Medium Commercial Vehicles (MCVs) | ||
| Heavy Commercial Vehicles (HCVs) | ||
| By Tire Type | Radial Tires | |
| Bias Tires | ||
| Solid Tires | ||
| By Application | Cargo Transportation | |
| Public Transportation | ||
| Construction | ||
| Mining | ||
| Agriculture | ||
| By Sales Channel | OEM | |
| Aftermarket | ||
| By Distribution Channel | Online | |
| Offline | ||
| By Price Category | Budget | |
| Economy | ||
| Premium | ||
| By Geography | North America | United States |
| Canada | ||
| Rest of North America | ||
| South America | Brazil | |
| Argentina | ||
| Rest of South America | ||
| Europe | Germany | |
| United Kingdom | ||
| France | ||
| Italy | ||
| Spain | ||
| Rest of Europe | ||
| Asia-Pacific | China | |
| India | ||
| Japan | ||
| South Korea | ||
| Rest of Asia-Pacific | ||
| Middle East and Africa | United Arab Emirates | |
| Saudi Arabia | ||
| South Africa | ||
| Turkey | ||
| Rest of Middle East and Africa | ||


Key Questions Answered in the Report
How large will global demand for truck and bus tires be by 2031?
The commercial vehicle tires market size is forecast to reach USD 166.44 billion by 2031, reflecting a 4.98% CAGR from 2026.
Which vehicle type will add the most incremental tire demand by 2031?
Heavy commercial vehicles are projected to grow at 5.30% CAGR, outpacing other classes as infrastructure projects and long-haul freight rebound.
What share do radial tires hold today?
Radial products already command 87.71% of global revenue and continue to gain ground, especially in India, Southeast Asia, and Latin America.
What is the main constraint on near-term growth?
Volatile natural rubber and crude prices inflate input costs, prompting some fleets—especially in South America and Africa—to delay purchases or switch to retreads.
How fast are online tire sales growing?
E-commerce channels for commercial tires are expanding at about 7.23% CAGR, most rapidly in dense urban markets where mobile installers support same-day service.
Page last updated on:


