Commercial Greenhouse Market Size and Share
Market Overview
| Study Period | 2021 - 2031 |
|---|---|
| Market Size (2026) | USD 51.40 Billion |
| Market Size (2031) | USD 86.90 Billion |
| Growth Rate (2026 - 2031) | 11.10% CAGR |
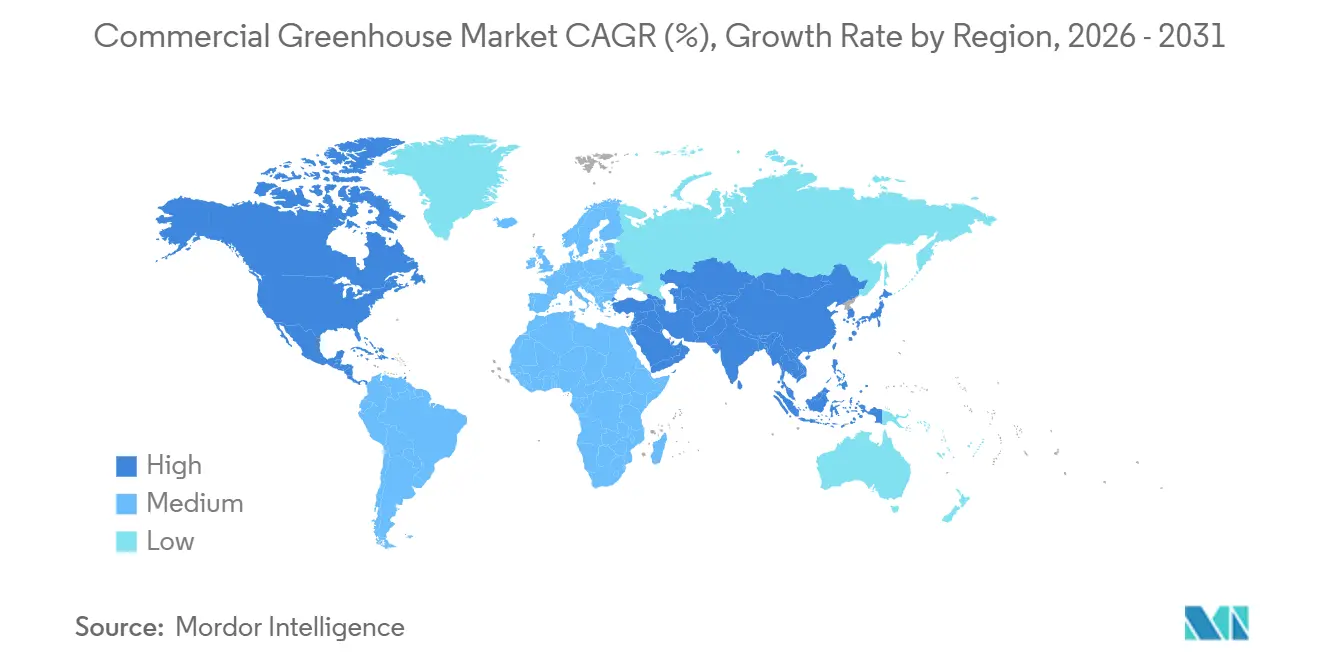
| Fastest Growing Market | Asia Pacific |
| Largest Market | North America |
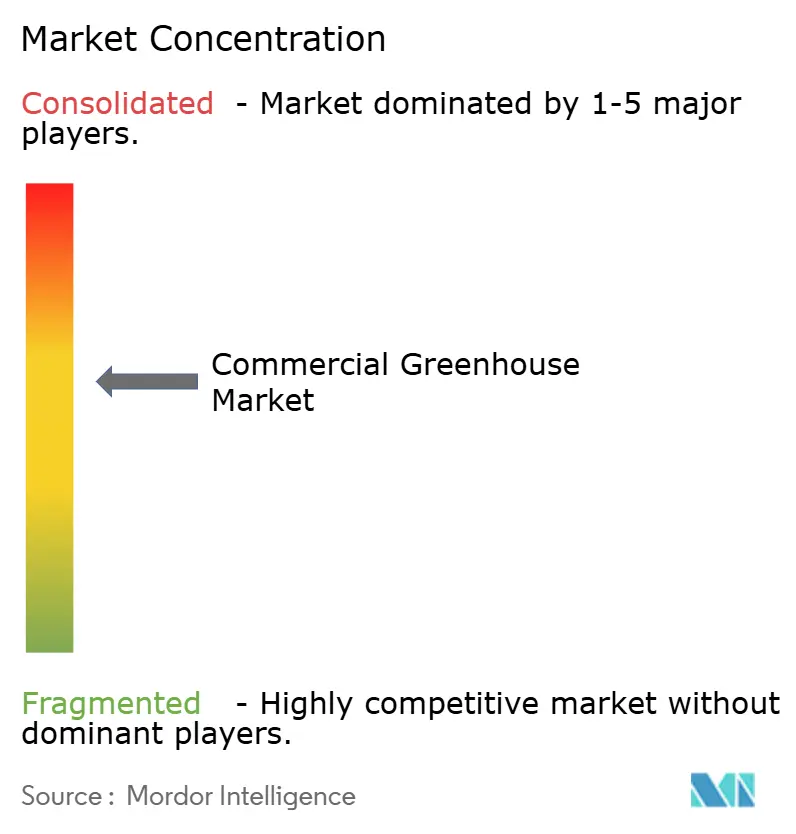
| Market Concentration | Medium |
Major Players *Disclaimer: Major Players sorted in no particular order Image © Mordor Intelligence. Reuse requires attribution under CC BY 4.0. | |
Commercial Greenhouse Market Analysis by Mordor Intelligence
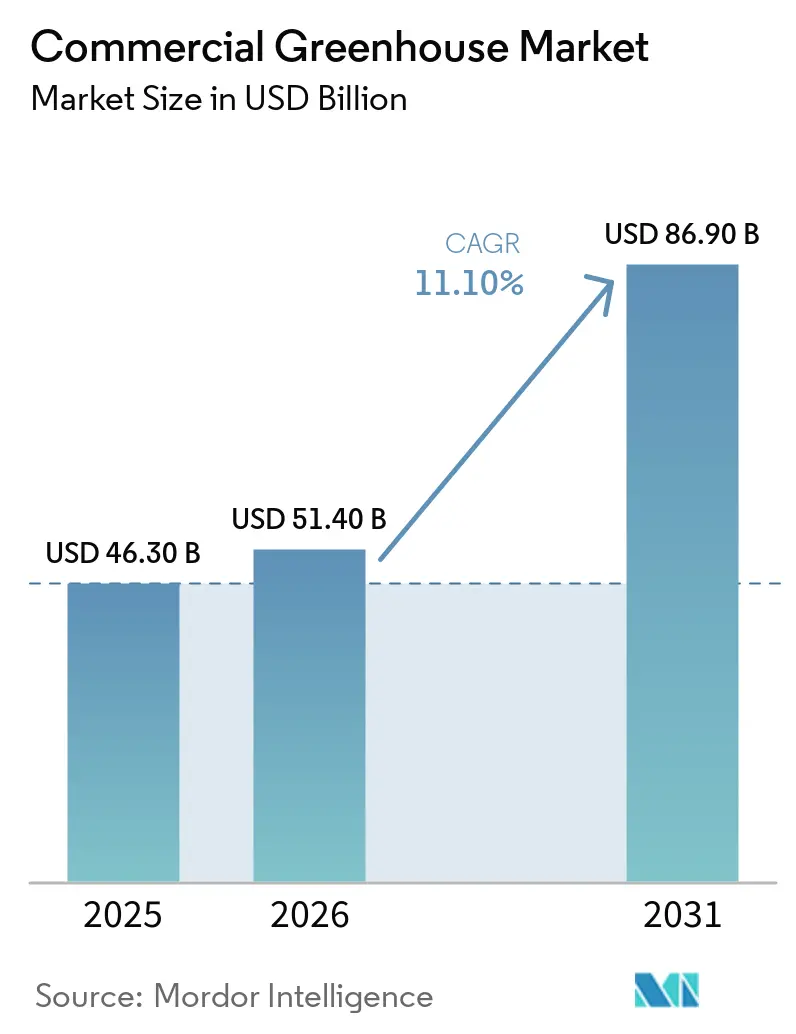
The commercial greenhouse market size is projected to be USD 46.3 billion in 2025, USD 51.4 billion in 2026, and reach USD 86.9 billion by 2031, growing at a CAGR of 11.1% from 2026 to 2031. The commercial greenhouse market is expanding because retailers and food-service buyers now need stable year-round produce volumes that open-field farming cannot deliver with the same consistency. Falling costs for controlled-environment agriculture (CEA) equipment are improving payback periods and drawing more capital into medium-tech and high-tech projects. The commercial greenhouse market is also expanding geographically, as waste-heat integration with industrial sites can improve energy economics in areas that were once difficult for protected cultivation. Growth still faces pressure from energy-price volatility and weak interoperability across lighting, climate, and fertigation systems in multi-vendor installations. Even with those limits, policy support, stricter buyer standards, and more capable artificial intelligence (AI)-driven controls are keeping the commercial greenhouse market on a strong growth path through 2031.
Key Report Takeaways
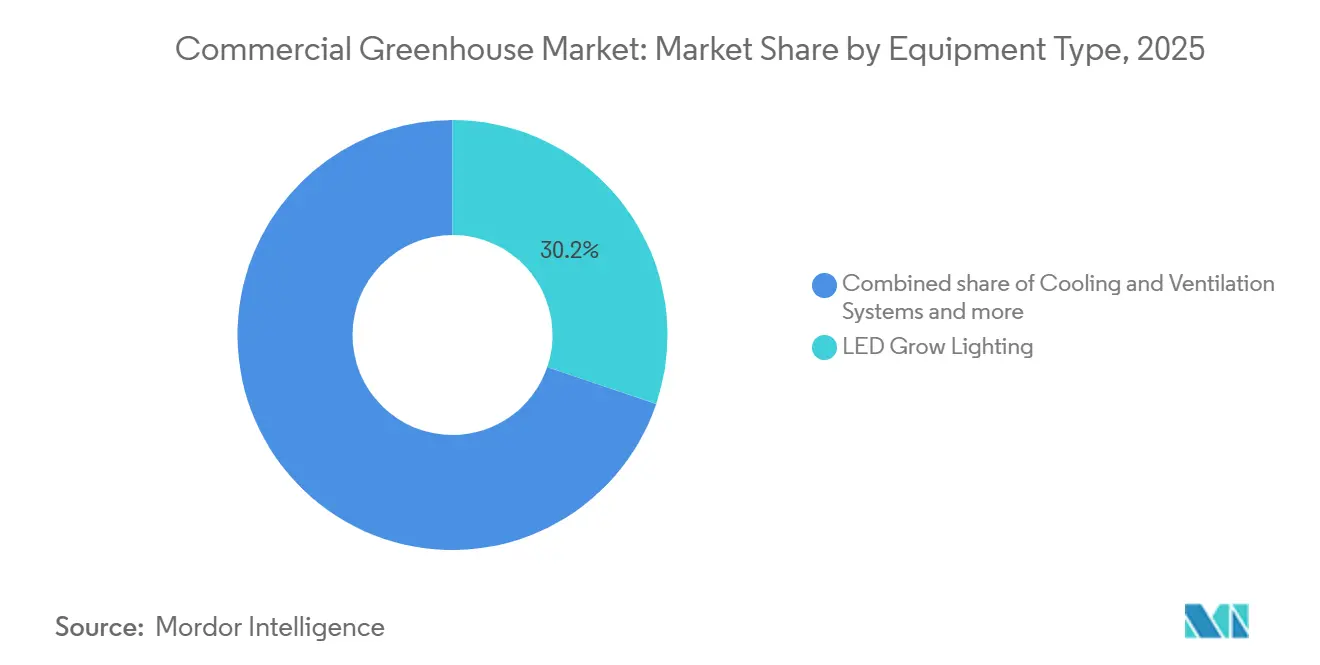
- By equipment type, light-emitting diode (LED) grow lighting held the largest 30.2% share of the commercial greenhouse market in 2025, while climate control and automation software are the fastest-growing category at 13.2% through 2031.
- By crop type, Fruits and Vegetables accounted for 55.5% of the commercial greenhouse market size in 2025, while cannabis and specialty crops are the fastest-growing segment at 14.5% CAGR during 2026-2031.
- By greenhouse type, plastic-film greenhouses captured the largest 61.2% commercial greenhouse market share in 2025, while glass greenhouses are the fastest segment at 12.2% CAGR during 2026-2031.
- By cultivation technology, hydroponic systems held 54.4% of the commercial greenhouse market share in 2025, while hybrid and vertical integration are the fastest-growing segments at 11.2% CAGR during 2026-2031.
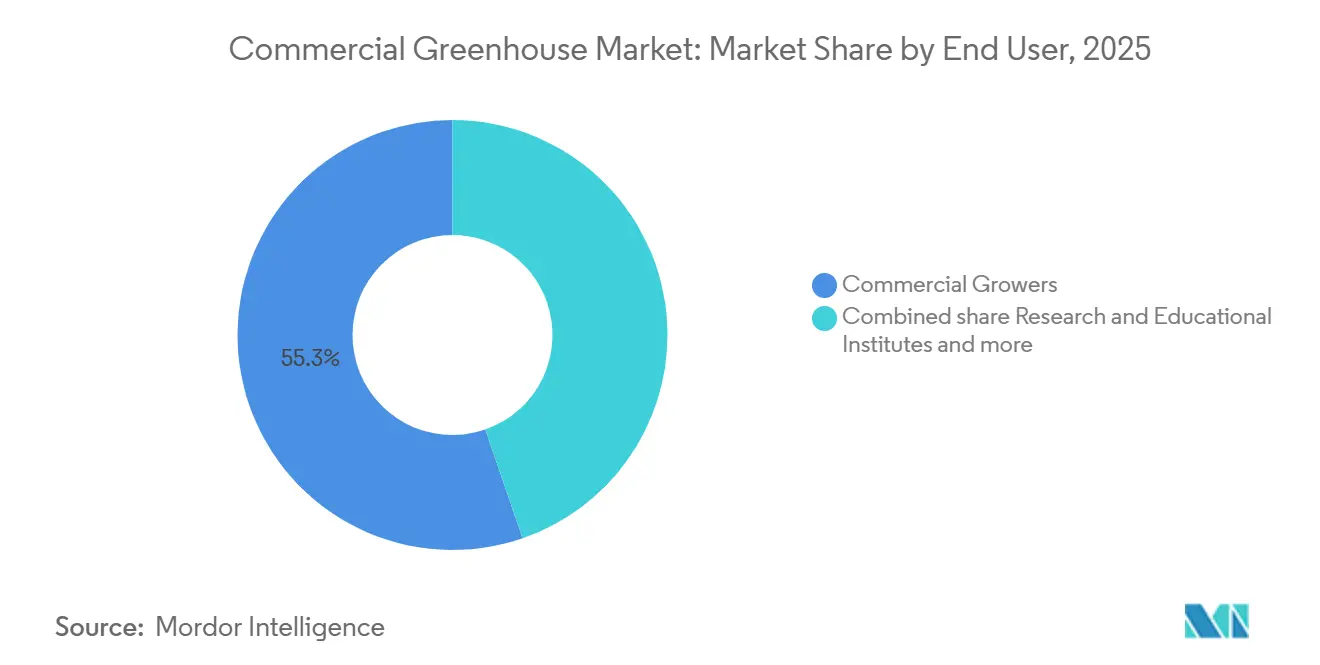
- By end user, commercial growers held the largest 55.3% share of the commercial greenhouse market in 2025, while research and educational institutes are the fastest-growing segment at a 13.5% CAGR during 2026-2031.
- By geography, North America held the largest 37.6% of the commercial greenhouse market share in 2025, while Asia-Pacific is the fastest region at 12.4% CAGR during 2026-2031.
Note: Market size and forecast figures in this report are generated using Mordor Intelligence’s proprietary estimation framework, updated with the latest available data and insights as of January 2026.
Global Commercial Greenhouse Market Trends and Insights
Drivers Impact Analysis*
| Driver | (~) % Impact on CAGR Forecast | Geographic Relevance | Impact Timeline |
|---|---|---|---|
| Demand for year-round fresh produce | +1.6% | Global, with the strongest pull in North America, Western Europe, and urban East Asia, where retailers require dependable contracted supply | Short term (≤ 2 years) |
| Climate-resilient production amid weather volatility | +1.9% | Strongest in South Asia, Southern Europe, the Middle East, and other regions where open-field output has become less reliable | Medium term (2-4 years) |
| LED lighting, sensors, and climate-control automation | +1.8% | Most visible in the Netherlands, Canada, the United States, Japan, South Korea, China, and India | Medium term (2-4 years) |
| Government support for protected cultivation and food security | +1.7% | Highest in Asia-Pacific and the Middle East, with meaningful support in North America and Europe | Long term (≥ 4 years) |
| Retailer shelf-life and pesticide-residue requirements | +1.3% | Strong in North America, Western Europe, Japan, and selected Gulf retail chains | Short term (≤ 2 years) |
| Waste-heat, carbon dioxide reuse, and flexible-energy monetization | +0.9% | Most relevant in the Netherlands, Denmark, Canada, Germany, Japan, and the United Arab Emirates | Long term (≥ 4 years) |
| Source: Mordor Intelligence | |||
Demand for Year-Round Fresh Produce
Retail and food-service procurement now favors consistent year-round supply, which directly supports new investment in the commercial greenhouse market. Large buyers want dependable volumes of tomatoes, cucumbers, lettuce, peppers, berries, and other fresh produce with stable quality and residue control, and greenhouse systems are better positioned to deliver them. The United States Department of Agriculture (USDA) announced USD 1.3 billion in second-round payments under the Marketing Assistance for Specialty Crops program in April 2025, which brought total support under that program to USD 2.65 billion[1]Source: U.S. Department of Agriculture, “USDA to Issue USD 1.3 Billion to Specialty Crop Producers Through Second Marketing Assistance Program Payment,” USDA, usda.gov. Grocery consolidation is strengthening this driver because fewer, larger buyers can impose tighter service expectations and stiffer penalties for supply gaps. That shift improves the case for utilization in the commercial greenhouse market because growers with stable output become more valuable to modern supply chains.
Climate-Resilient Production Amid Weather Volatility
Weather volatility has made open-field supply less dependable across several produce-growing regions, prompting buyers to turn to more protected cultivation. This matters to the commercial greenhouse market because extreme heat, drought, flooding, and irregular seasonal patterns raise the value of controlled output more quickly than standard planning models suggest. A February 2026 study in Nature Communications found that controlled-environment systems can remain viable under aggressive climate scenarios when they maximize natural light and carefully manage heating loads. The European Commission reinforced this direction in 2025 with a Horizon Europe work program that included EUR 12.0 million (USD 13 million) for controlled-environment agriculture research[2]Source: European Commission, “Horizon Europe Work Programme 2025, Food, Bioeconomy, Natural Resources, Agriculture and Environment,” European Commission, europa.eu. As procurement teams place greater weight on resilience, the commercial greenhouse market benefits, as greenhouse output shifts from backup supply to core supply planning.
LED Lighting, Sensors, and Climate-Control Automation
Technology upgrades are improving labor efficiency and operational precision in the commercial greenhouse market, especially as growers seek to standardize crop outcomes across seasons. Signify N.V. introduced a 4-channel Philips GreenPower LED Toplighting Force fixture in June 2025, with an efficacy of up to 4.3 µmol/J at 50% power, enabling more flexible spectral management. In the same month, Signify extended Philips GrowWise control to support remote spectral steering and participation in the Automatic Frequency Restoration Reserve (aFRR) energy market in the Benelux. Priva Holding B.V. and Blue Radix stated in January 2025 that their installed base already covered 100 greenhouses in 17 countries, with reported reductions in climate-computing task load of up to 80% per operator.
Government Support for Protected Cultivation and Food Security
Public support is helping more greenhouse projects move from planning into funded implementation, which is expanding the commercial greenhouse market in both developed and emerging regions. The United States Department of Agriculture (USDA) confirmed total support of USD 2.65 billion under the Marketing Assistance for Specialty Crops program in April 2025. The Specialty Crop Block Grant Program (SCBGP) added USD 72.9 million for fiscal 2025, which supports specialty crop systems that can include greenhouse-linked supply chains[3]Source: U.S. Department of Agriculture Agricultural Marketing Service, “Specialty Crop Block Grant Program Fiscal Year 2025 Request for Applications,” Agricultural Marketing Service, ams.usda.gov. The Rijksdienst voor Ondernemend Nederland (RVO) allocated EUR 8.5 million (USD 9.2 million) in 2025 under the Market Introduction Energy Innovations Greenhouse Horticulture scheme. Meanwhile, Ireland maintained its capital-grant support for commercial horticulture investments. These initiatives are significant as they reduce initial cost barriers and emphasize the recognition of greenhouse capacity as strategic food infrastructure within the commercial greenhouse market.
Restraints Impact Analysis*
| Restraint | (~) % Impact on CAGR Forecast | Geographic Relevance | Impact Timeline |
|---|---|---|---|
| High upfront capital and long payback periods | -2.1% | Most constraining in India, Brazil, South Africa, Mexico, Turkey, and other markets with limited long-duration greenhouse finance | Medium term (2-4 years) |
| Energy-cost volatility and power-intensity exposure | -1.8% | Strongest in the Netherlands, the United Kingdom, Germany, Japan, Canada, and other high-tech glass greenhouse clusters | Medium term (2-4 years) |
| Interoperability gaps across climate, lighting, and crop-data stacks | -1.4% | Most visible in the United States, Canada, the Netherlands, Japan, and Australia where multi-vendor installations are common | Long term (≥ 4 years) |
| Water recirculation and discharge compliance costs | -1.1% | Highest in the Netherlands, Spain, the United Kingdom, Israel, and the United Arab Emirates where water rules are strict | Long term (≥ 4 years) |
| Source: Mordor Intelligence | |||
High Upfront Capital and Long Payback Periods
Capital intensity remains a clear barrier in the commercial greenhouse market because full high-tech builds can exceed USD 5 million to USD 10 million per hectare when climate systems, lighting, fertigation, and software are included. This makes financing harder in markets where agricultural lending is expensive or where greenhouse cash flow is still viewed as execution sensitive. The challenge intensifies when wholesale vegetable prices decline, as debt servicing does not adjust as rapidly as produce prices. This trend highlights why larger, well-capitalized operators dominate the recent project pipeline in the commercial greenhouse market. While leasing models, platform financing, and energy-as-a-service solutions offer support, the initial financial burden continues to hinder broader adoption.
Energy-Cost Volatility and Power-Intensity Exposure
Energy remains one of the main cost risks in the commercial greenhouse market because heating, cooling, and supplemental lighting shape a large share of operating expenses in advanced glass facilities. Price dislocations after 2024 showed how quickly project margins can narrow when business plans depend on lower gas and electricity assumptions. Certhon Build B.V. responded in July 2025 by commissioning an energy system for OK Plant that included a 1-million-liter thermal buffer tank, 2 heat pumps, and a smart energy platform. Orbia reported in its 2025 results that agricultural operating margins remained under pressure from input-cost volatility, a trend that aligns with the stress seen across greenhouse-linked supply chains. Efficiency upgrades and electrification will ease this issue over time, but the transition will take most of the current forecast period in the commercial greenhouse market.
*Our forecasts treat driver/restraint impacts as directional, not additive. The impact forecasts reflect baseline growth, mix effects, and variable interactions.
Segment Analysis
By Equipment Type: LED Grow Lighting Anchors the Equipment Spending Mix
LED grow lighting accounted for the largest share of the equipment segment in 2025, holding 30.2% of the market, making it the primary revenue generator in the commercial greenhouse market. This dominance reflects a widespread retrofit trend, as growers replace high-pressure sodium (HPS) fixtures with LED systems that provide improved heat management and more precise light delivery. Heating, cooling, and ventilation systems continue to represent a significant expenditure category, as maintaining climate stability remains critical for consistent yields in glass and semi-closed greenhouse operations. Additionally, irrigation and fertigation systems maintain their importance, driven by the increasing focus on water reuse and nutrient precision to enhance cost efficiency and meet regulatory requirements. Structural components are primarily linked to greenfield developments, particularly in regions where new greenhouse complexes are expanding at a faster rate than retrofits.
Climate control and automation software is the fastest-growing equipment category in the commercial greenhouse market size, with a compound annual growth rate (CAGR) of 13.2% during 2026-2031. This growth highlights a shift in value from hardware to crop-performance control. In June 2025, Signify introduced the Philips GrowWise smart spectrum, enabling growers to achieve greater software-controlled spectral settings. During the same period, Signify also launched a new 4-channel fixture platform, which emphasized the connection between lighting upgrades, energy efficiency, and dynamic control. Growers increasingly demand integrated solutions that combine lighting, irrigation, climate, and energy data into a unified system, rather than relying on separate tools. This trend is reshaping competition among equipment vendors, favoring those capable of linking devices to measurable crop outcomes instead of offering standalone hardware solutions.


By Crop Type: Fruits and Vegetables Dominate While Specialty Crops Advance Faster
Fruits and vegetables accounted for 55.5% of the commercial greenhouse market share in 2025, representing the largest revenue share among crop groups. Tomatoes, cucumbers, lettuce, and peppers remain the primary products due to their alignment with year-round retail demand and greenhouse economics. Their prominence is also driven by supermarket and food-service contracts, which prioritize consistent sizing, minimal residue exposure, and reliable delivery schedules. This crop mix provides the commercial greenhouse market with a stable demand base, supporting investments in lighting, irrigation, and automation technologies. While flowers and ornamentals continue to play a significant role in high-value horticulture, their demand patterns are more mature and seasonal in nature.
The cannabis and specialty crops segment is the fastest-growing in the commercial greenhouse market, with a projected compound annual growth rate (CAGR) of 14.5% during 2026-2031. Medical cannabis is a key growth driver, as greenhouse environments enable consistency, traceability, and effective residue management in regulated production. Additionally, herbs, microgreens, seedlings, and propagation crops are expanding due to their compatibility with short production cycles and local delivery models. This segment is gaining traction because controlled greenhouse conditions deliver quality advantages that are difficult to achieve through traditional field cultivation. While the crop portfolio is diversifying, fruits and vegetables continue to serve as the primary foundation for operations in the commercial greenhouse market.
By Greenhouse Type: Plastic-film Structures Lead While Glass Gains in Advanced Projects
Plastic-film greenhouses accounted for the largest market share at 61.2% in 2025, making them the most prevalent greenhouse type in the commercial greenhouse market. Their dominance is attributed to lower construction costs, faster installation, and suitability for growers transitioning to protected cultivation for the first time. These characteristics make plastic-film structures particularly relevant in regions such as Asia, Latin America, and parts of the Middle East, where affordability significantly influences project design. Within this category, hybrid and semi-closed designs are gaining traction due to their ability to enhance climate control without incurring the higher costs associated with full-glass structures. Rigid polycarbonate structures maintain a steady presence in institutional and medium-tech applications, where impact resistance and diffused light are critical factors.
Glass greenhouses are the fastest-growing type in the commercial greenhouse market, with a projected compound annual growth rate (CAGR) of 12.2% during 2026-2031. Their growth is driven by superior climate control, enhanced light transmission, and better compatibility with automation-intensive crop production systems. For instance, in July 2025, Signify reported that Looye Kwekers achieved summer-level winter tomato yields in an 8.2-hectare semi-closed glass greenhouse equipped with full LED systems delivering 375 µmol/m²/sec. This example highlights why some growers are willing to invest in higher capital costs when maximizing yield intensity and ensuring year-round production are key objectives. Over time, the commercial greenhouse market is projected to retain plastic film
By Cultivation Technology: Hydroponics Leads While Hybrid Models Expand
Hydroponic systems accounted for the largest market share of 54.4% in 2025, representing the most widely adopted cultivation method in the commercial greenhouse market. This dominance is attributed to their compatibility with water reuse, precise nutrient management, and controlled root-zone conditions in commercial applications. Nutrient Film Technique (NFT) remains significant for leafy green production, while drip hydroponics is widely used for high-wire crops such as tomatoes, cucumbers, and peppers. Soil and substrate-based methods continue to play a role in cases where buyer preferences, crop-specific requirements, or certification standards necessitate their use. However, the commercial greenhouse market increasingly favors hydroponics due to its alignment with precision control and scalable automation.
Hybrid and vertical integration represent the fastest-growing cultivation approach, with a projected compound annual growth rate (CAGR) of 11.2% during 2026-2031 in commercial greenhouse market. This growth is driven by higher yield density and more efficient utilization of greenhouse space, particularly in regions where land and labor costs are significant constraints. This trend indicates a shift in the commercial greenhouse market from basic hydroponic adoption to more advanced, software-driven cultivation models. The strongest demand is anticipated in operations where water, labor, and space efficiency are critical to project economics.
By End User: Commercial Growers Lead While Research Demand Rises Faster
Commercial growers accounted for the largest market share of 55.3% in 2025, establishing themselves as the primary demand base for the commercial greenhouse market. This group incurs the highest capital expenditures due to the increasing need for large-scale operations to justify investments in advanced climate control, lighting, and irrigation systems. Additionally, commercial growers benefit significantly from advantages in energy procurement, labor management, and retailer partnerships. As these benefits expand, market consolidation continues to strengthen the role of larger commercial operators in greenhouse project development. While retail garden centers and nurseries remain relevant, their investment patterns are more seasonal and rely less on automation.
Research and educational institutes represent the fastest-growing end-user group, with a projected compound annual growth rate (CAGR) of 13.5% during 2026-2031. Demand from this segment is increasing as crop-science programs, seed companies, and training institutions require controlled environments for consistent and repeatable research. For instance, Van der Hoeven Horticultural Projects B.V. completed the 2.5-hectare Rijk Zwaan Hybride 2 breeding greenhouse in the Netherlands in December 2025, focusing on the development of tomatoes, sweet peppers, and aubergines. These institutional projects play a critical role in testing new structural, environmental, and crop-control methods, which can later be scaled into larger commercial applications. Although research buyers currently contribute a smaller volume, they are influential in shaping the future direction of the commercial greenhouse market.
Geography Analysis
North America accounted for 37.6% of the commercial greenhouse market in 2025. The United States and Canada supported this share through robust retail demand, established grower networks, and a mature base for high-technology vegetable production. The region benefited from government support programs for specialty crops, such as funding under the Marketing Assistance for Specialty Crops initiative and the Specialty Crop Block Grant Program during fiscal 2025. Additionally, tariff pressures and supply chain disruptions drove increased interest in domestic sourcing and shorter supply chains for greenhouse structures and equipment. These factors reinforced North America’s leading position in the commercial greenhouse market, though its growth rate was slower than that of emerging markets experiencing rapid expansion.
The Asia-Pacific region was projected to be the fastest-growing market, with a CAGR of 12.4% during 2026–2031. China led this growth through significant investments in smart greenhouse infrastructure. Japan and South Korea remained key markets due to their advanced automation capabilities and demand for environmental control systems and advanced lighting technologies. Additionally, India and several Southeast Asian countries expanded protected cultivation, driven by food-security initiatives, government support programs, and a growing focus on water-efficient agricultural systems.
Europe's growth in the commercial greenhouse market stemmed from technology modernization and energy-transition investments rather than large-scale greenfield greenhouse projects. The Netherlands remained a central player, supported by Rijksdienst voor Ondernemend Nederland (RVO) programs that promoted energy efficiency and innovation in greenhouse horticulture. Spain also played a significant role due to its extensive greenhouse cultivation area and increasing demand for automation, water-efficiency systems, and climate-control upgrades to meet stricter environmental regulations. The Middle East experienced steady growth, driven by rising investments in high-tech greenhouse systems in Saudi Arabia and the United Arab Emirates as part of broader food security strategies. In Africa, gradual expansion was forecast, led by Kenya, South Africa, and Egypt. These countries increasingly adopted protected cultivation to enhance compliance with export quality standards, improve resource efficiency, and optimize water management.
Mordor Intelligence provides coverage of the commercial greenhouse market across other key regional markets. Detailed country-level analysis extends to Netherlands, United Kingdom, and Spain incorporating local coverage and market participation, as required.

Competitive Landscape
The commercial greenhouse market is moderately concentrated, with the top five market players accounting for a significant share in 2025. Prospiant LLC, Netafim Ltd., Richel Group, Certhon Build B.V., and KUBO Greenhouse Projects B.V. were the leading companies. However, none of these companies had full control over the entire value chain, encompassing structures and controls. This creates competition across different layers of the value chain, with turnkey builders competing on delivery and scale while software and controls firms compete on crop outcomes and integration. The commercial greenhouse market is characterized by a diverse supplier landscape, with no single supplier model or technology stack dominating. Factors such as regional presence, project suitability, and operational data capabilities are as significant as company size in determining success within this market.
In 2025, Signify N.V. enhanced its position in software and intelligent lighting management by updating its Philips GrowWise platform. These updates included spectrum control and greenhouse optimization features. Similarly, Priva Holding B.V. bolstered its autonomous growing capabilities in January 2025 through a multi-year agreement with Blue Radix, integrating artificial intelligence-based crop control with Priva process computers. Ridder advanced interoperability by enabling integration between Philips GrowWise lighting systems and Ridder Hortimax Pro using the Horti Lighting Protocol. These initiatives highlight a trend among vendors to evolve into integrated greenhouse operating platforms rather than remaining solely hardware providers. The market increasingly values suppliers that can reduce labor demands, enhance energy efficiency, and stabilize yields across crop cycles.
Certhon Build B.V. prioritized energy-efficient greenhouse infrastructure in 2025, incorporating advanced climate-control and energy-management systems into its projects. Priva Holding B.V. further expanded its digital ecosystem by integrating plant intelligence and greenhouse management platforms, enabling more data-driven cultivation decisions. The commercial greenhouse market continues to offer opportunities for arid-climate turnkey systems, interoperable software platforms, and operating models focused on water-use and energy-efficiency performance. These developments create space for specialist vendors, even as larger companies expand their ecosystems through partnerships and integration strategies.
Commercial Greenhouse Industry Leaders
Prospiant LLC
Netafim Ltd.
Richel Group SAS
Certhon Build B.V.
KUBO Greenhouse Projects B.V.
- *Disclaimer: Major Players sorted in no particular order

Recent Industry Developments
- October 2025: KUBO Greenhouse Projects B.V. secured a contract to supply greenhouse technology for a high-tech production zone exceeding 1 million sqm in Saudi Arabia's Jazan region, in partnership with Amtar Al Khair Agricultural Crops Company and backed by the Saudi Ministry of Environment, Water and Agriculture and the Agriculture Development Fund. The project aligns with Saudi Vision 2030 food-security objectives and represents one of the largest single commercial greenhouse contracts awarded globally.
- August 2025: Certhon Build B.V. commissioned an innovative heating and cooling system for OK Plant featuring a 1 million liter thermal buffer tank, two heat pumps, and a smart energy management platform integrated with the Certhon Control System, significantly reducing natural gas consumption and providing real-time energy-flow monitoring across the facility.
- June 2025: Signify N.V. launched the Philips GrowWise smart spectrum algorithm and a new 4-channel GreenPower LED Toplighting Force, achieving up to 4.3 µmol/J efficacy at 50% power. The GrowWise update enables Benelux growers to participate in the Automatic Frequency Restoration Reserve (aFRR) energy market, generating additional revenue from dimmable LED installations.


Research Methodology Framework and Report Scope
Market Definitions and Key Coverage
Our study counts revenue generated by purpose-built glass or plastic structures where temperature, humidity, light, and fertigation are actively regulated to grow fruits, vegetables, flowers, ornamentals, herbs, and other specialty crops for sale to retailers, food-service buyers, or processors.
Scope exclusion: Backyard hobby houses and purely academic installations below 200 m² are not included.
Segmentation Overview
- By Equipment Type
- Heating Systems
- Cooling and Ventilation Systems
- LED Grow Lighting
- Irrigation and Fertigation Systems
- Climate Control and Automation Software
- Screening and Shading Systems
- Structural Components
- Glazing Systems
- Frames and Trusses
- By Crop Type
- Fruits and Vegetables
- Tomatoes
- Cucumbers
- Lettuce and Leafy Greens
- Peppers
- Strawberries and Berries
- Flowers and Ornamentals
- Cut Flowers
- Potted Plants and Bedding Plants
- Herbs and Microgreens
- Cannabis and Specialty Crops
- Medical Cannabis
- Seedlings and Propagation Crops
- Fruits and Vegetables
- By Greenhouse Type
- Glass Greenhouses
- Plastic-film Greenhouses
- Rigid Polycarbonate Greenhouses
- Hybrid and Semi-closed Greenhouses
- By Cultivation Technology
- Hydroponic
- Nutrient Film Technique
- Deep Water Culture
- Drip Hydroponics
- Non-hydroponic Soil and Substrate
- Soil-based
- Coco Coir and Rockwool Substrate
- Hybrid and Vertical Integration
- Hydroponic
- By End User
- Commercial Growers
- Research and Educational Institutes
- Retail Garden Centers and Nurseries
- By Geography
- North America
- United States
- Canada
- Mexico
- Rest of North America
- South America
- Brazil
- Argentina
- Chile
- Rest of South America
- Europe
- Netherlands
- Spain
- Germany
- United Kingdom
- France
- Russia
- Rest of Europe
- Asia-Pacific
- China
- Japan
- India
- South Korea
- Australia
- Rest of Asia-Pacific
- Middle East
- Saudi Arabia
- United Arab Emirates
- Turkey
- Israel
- Rest of Middle East
- Africa
- South Africa
- Egypt
- Kenya
- Rest of Africa
- North America
Detailed Research Methodology and Data Validation
Primary Research
Mordor analysts interviewed commercial growers in the Netherlands, Mexico, Canada, and China, system integrators for heating and ventilation, LED makers, and horticulture consultants. These discussions provided live insights on installed area additions, retrofit frequency, average selling prices, and subsidy uptake, allowing us to refine assumptions surfaced in secondary work.
Desk Research
We drew foundational data from publicly available tier-1 sources such as FAO land-use tables, Eurostat crop-production dashboards, USDA ERS price trackers, UN Comtrade shipment codes for protected-crop HS lines, and reports by the International Greenhouse Growers Association. Trade journals and peer-reviewed papers in "Frontiers in Plant Science" clarified technology efficiency benchmarks. Paid libraries we access, D&B Hoovers for supplier revenues, Questel for patent activity, and Volza for shipment trends, helped quantify market shares and diffusion rates. The sources named here are illustrative; many additional repositories were tapped for corroboration.
Market-Sizing & Forecasting
We employ a hybrid top-down and bottom-up framework. Installed greenhouse surface area by country is multiplied by region-specific yield factors and crop-mix shares; the resulting tonnage pools are valued with weighted farm-gate prices. Supplier roll-ups of glazing, climate control hardware, and LED volumes then validate and, where needed, adjust totals. Variables powering the model include annual greenhouse area additions, electricity and natural-gas price indices, LED penetration ratio, subsidy intensity, and export share of protected-crop output. Forecasts through 2030 use multivariate regression supported by expert consensus, while scenario analysis stress-tests weather-driven volatility. Data gaps in supplier reporting are bridged with capacity announcements and historic utilization trends.
Data Validation & Update Cycle
Outputs undergo peer review, senior-lead scrutiny, and automated variance checks against independent series. Our model refreshes annually, with interim reruns triggered when policy or energy-price swings breach preset thresholds, ensuring clients receive the most current view.
Why Mordor's Commercial Greenhouse Baseline Commands Reliability
Published estimates often diverge because firms select different crop baskets, infrastructure scopes, and price bases.
Key gap drivers include: some publishers merge produce sales with equipment revenue, others omit replacement glazing, and many freeze electricity costs at base-year levels. Our baseline reports 2025 values in constant 2024 dollars, excludes hobby units, and normalizes average selling prices across major regions, reducing double counting and inflation noise.
Benchmark comparison
| Market Size | Anonymized source | Primary gap driver |
|---|---|---|
| USD 46.7 B | Mordor Intelligence | - |
| USD 32.8 B | Global consultancy A | Combines greenhouses with container farms; omits software revenue |
| USD 38.9 B | Trade journal B | Uses grower revenue only, excludes replacement components |
| USD 41.8 B | Regional consultancy C | Holds prices constant; no energy-cost indexing |
The comparison shows that, by embracing the full equipment universe while excluding hobby demand and by rigorously updating cost drivers, Mordor Intelligence delivers a transparent, balanced baseline that decision-makers can trace, replicate, and stress-test with confidence.


Key Questions Answered in the Report
What is the current outlook for commercial greenhouse operations worldwide?
The commercial greenhouse market is projected to grow from USD 51.4 billion in 2026 to USD 86.9 billion by 2031, at a 11.1% CAGR during 2026-2031.
Which region currently leads global demand?
North America is projected to hold the largest regional share at 37.6% in 2025, driven by established retail channels and consistent year-round demand for produce.
Which crop group brings the most revenue in greenhouse production?
Fruits and Vegetables held the largest crop-type share at 55.5% in 2025, led by tomatoes, cucumbers, lettuce, and peppers.
Which cultivation approach is most widely used?
Hydroponic Systems led with a 54.4% share in 2025 because they support water reuse, nutrient precision, and controlled root-zone management.
What is the biggest operating risk for greenhouse investors?
Energy-cost volatility remains a major risk because heating, cooling, and lighting account for a heavy share of operating expenses, especially in high-tech glass facilities.
Page last updated on:


