Color Detection Sensor Market Size and Share
Market Overview
| Study Period | 2020 - 2031 |
|---|---|
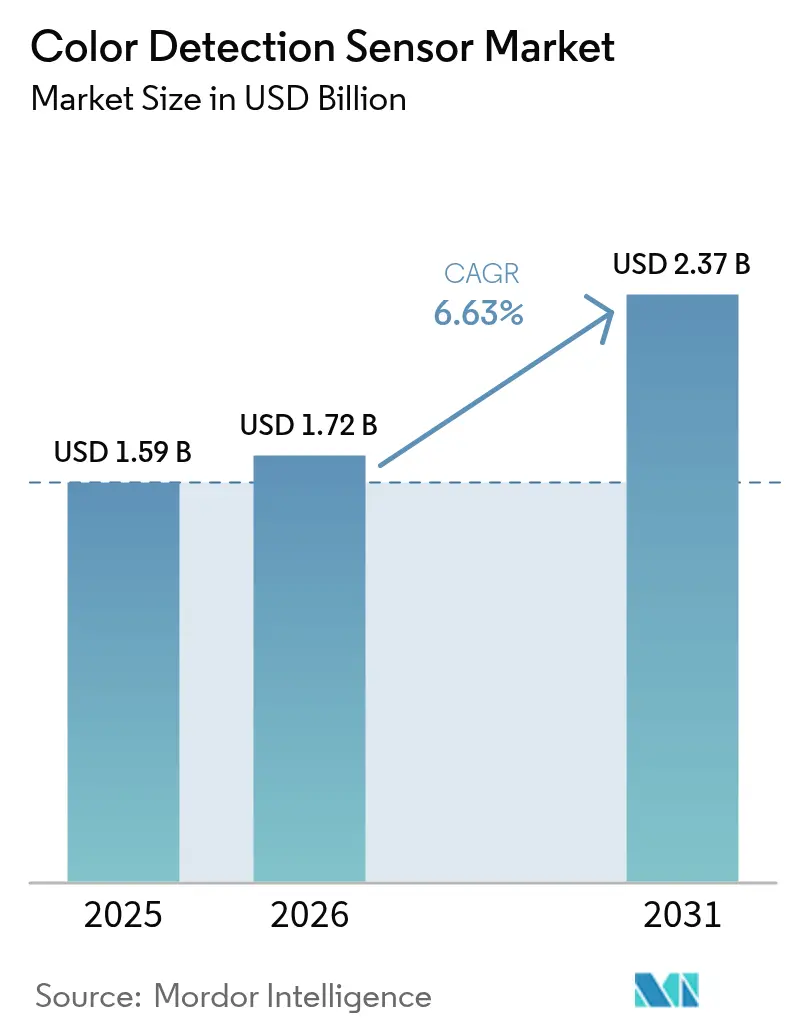
| Market Size (2026) | USD 1.72 Billion |
| Market Size (2031) | USD 2.37 Billion |
| Growth Rate (2026 - 2031) | 6.63% CAGR |
| Fastest Growing Market | Asia Pacific |
| Largest Market | Asia Pacific |
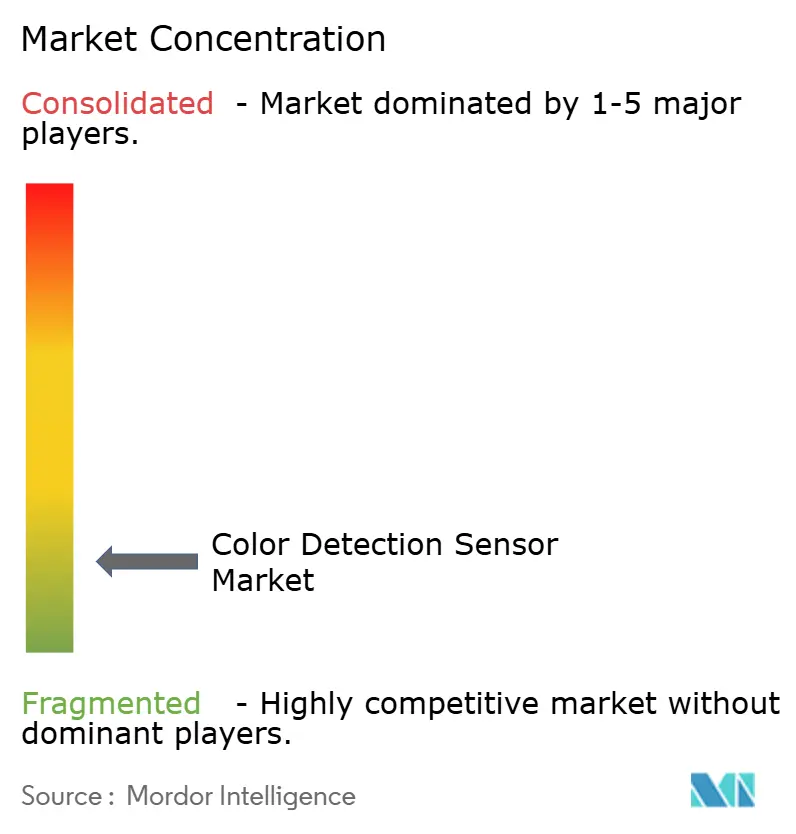
| Market Concentration | Low |
Major Players *Disclaimer: Major Players sorted in no particular order Image © Mordor Intelligence. Reuse requires attribution under CC BY 4.0. | |
Color Detection Sensor Market Analysis by Mordor Intelligence
The color detection sensor market size is expected to increase from USD 1.59 billion in 2025 to USD 1.72 billion in 2026 and reach USD 2.37 billion by 2031, growing at a CAGR of 6.63% over 2026-2031. Demand keeps rising as factory owners digitize quality control, smartphone and wearable brands embed chromatic modules for health monitoring, and regulators tighten rules on color uniformity in food and pharmaceutical packaging. Investment is also flowing toward hyperspectral research that promises material-level insights far beyond classic RGB, while machine-learning firmware shortens inspection cycles and trims scrap. Vendors are responding with miniaturized, low-power devices that fit next to camera sensors or robot grippers, allowing real-time validation without slowing throughput. Pricing pressure persists in high-volume consumer electronics, yet industrial and healthcare buyers continue to pay a premium for accuracy, traceability, and long-term supply assurance.
Key Report Takeaways
- By sensor type, RGB sensors led with 41.27% of the color detection sensor market share in 2025, while spectral variants are advancing at a 7.61% CAGR through 2031.
- By form factor, embedded designs commanded 38.32% of 2025 revenue and are scaling at a 7.18% CAGR to 2031 as on-board integration replaces standalone modules.
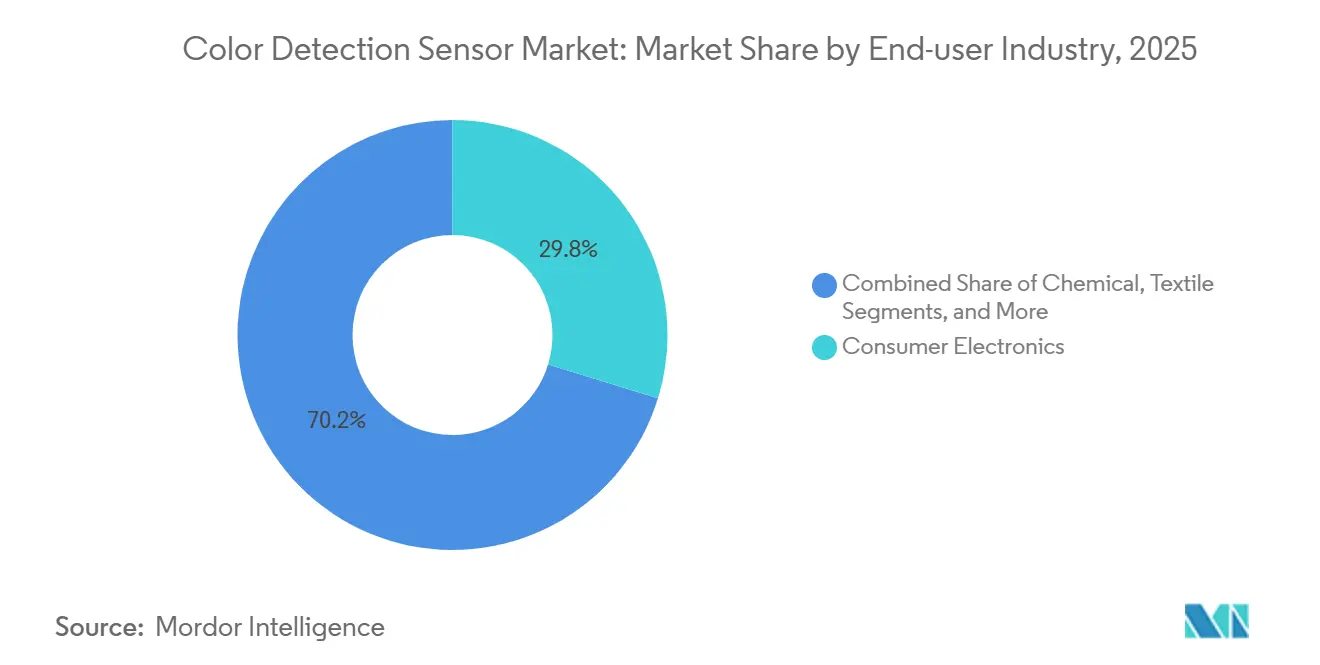
- By end-user industry, consumer electronics accounted for 29.76% of 2025 demand, whereas healthcare is expanding fastest at 7.97% CAGR through 2031.
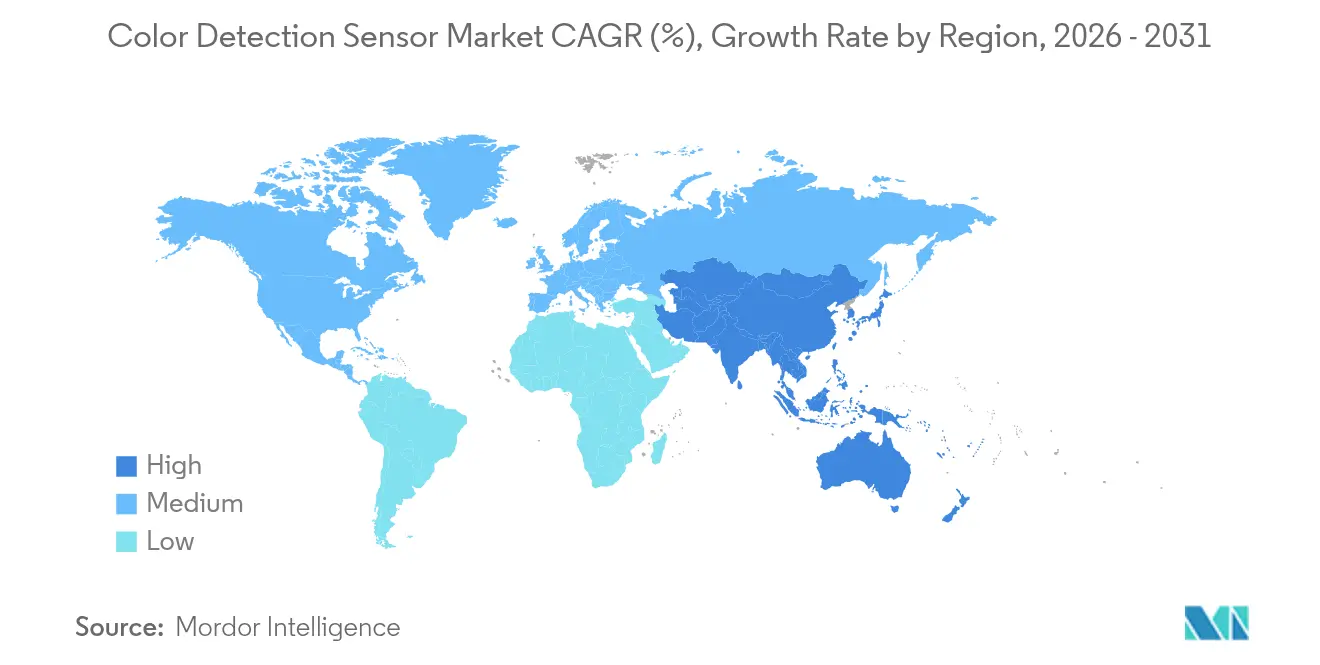
- By geography, Asia-Pacific captured 37.54% of 2025 sales and is projected to post a 7.56% CAGR, maintaining its lead through 2031.
Note: Market size and forecast figures in this report are generated using Mordor Intelligence’s proprietary estimation framework, updated with the latest available data and insights as of 2026.
Global Color Detection Sensor Market Trends and Insights
Drivers Impact Analysis*
| Driver | (~) % Impact on CAGR Forecast | Geographic Relevance | Impact Timeline |
|---|---|---|---|
| Rising Process Automation Across Discrete and Process Industries | +1.8% | Global with emphasis on Asia-Pacific and North America | Medium Term (2–4 Years) |
| Proliferation of Color Sensors in Smartphones and Wearables | +1.5% | Global led by Asia-Pacific assembly hubs and U.S. design centers | Short Term (≤ 2 Years) |
| Adoption in Industrial Robotics and Machine-Vision Systems | +1.2% | North America, Europe, and Asia-Pacific | Medium Term (2–4 Years) |
| Stringent Color-Matching Standards in Food-Pharma Packaging | +0.9% | North America and Europe, with spillover to Asia-Pacific exporters | Long Term (≥ 4 Years) |
| Inline Color Measurement for Additive Manufacturing | +0.6% | North America and Europe | Long Term (≥ 4 Years) |
| Hyperspectral Color Sensing in Precision-Agri Drones | +0.4% | North America, Europe, select Asia-Pacific farms | Long Term (≥ 4 Years) |
| Source: Mordor Intelligence | |||
Rising Process Automation Across Discrete and Process Industries
Factories that assemble cars, smartphones, or machinery now rely on inline color checks to confirm part identity, spot coating flaws, and hold paint within tolerance without pausing the line. Chemical and food producers run continuous colorimetry on liquid streams to trigger adjustments before off-spec batches reach packaging. Growth accelerated after large vision suppliers posted double-digit revenue gains from 2025 automation projects.[1]Cognex Corporation, “Investor Relations 2025 Results,” cognex.com Ethernet-ready sensors feed programmable logic controllers, closing feedback loops that lift first-pass yield and trim rework. Emerging uses include color-coded plastic sorting for recycling and real-time verification of tablet coating in pharma lines where hue correlates with drug release rates.
Proliferation of Color Sensors in Smartphones and Wearables
Phone and watch makers mount RGB and RGB+IR diodes beside cameras or under glass to read pulse, blood-oxygen saturation, and even skin tone for cosmetic advice. With annual handset volumes in the hundreds of millions, component pricing has plunged, spurring suppliers to shrink packages to under 2 mm while adding up to 14 channels of spectral output.[2] ams-OSRAM AG, “AS7341 Spectral Sensor Datasheet,” ams-osram.com R&D now targets non-invasive glucose tests that could open clinical markets once regulators complete guidance on software-as-a-medical-device rules. The high-volume mobile segment, therefore, finances miniaturization that industrial and healthcare adopters quickly repurpose.
Adoption in Industrial Robotics and Machine-Vision Systems
Robots equipped with color vision pick parts by hue, orient them correctly, and inspect finished goods for tint or gloss problems within milliseconds. Automotive paint booths verify basecoat and clearcoat consistency in situ, eliminating costly rework later in the process. Electronics plants use color-guided pick-and-place to identify tiny resistors or capacitors without barcodes. Compact sensors from leading automation brands now integrate sub-millisecond response, internal illumination, and AI-based classification, allowing deployment in variable-light cells.
Stringent Color-Matching Standards in Food-Pharma Packaging
Packaging colors serve as legal identifiers for dosage strength, flavor, or safety warnings. U.S. and EU regulations require documented proof that every production lot stays within certified colorant windows.[3]U.S. Food and Drug Administration, “Color Additives,” fda.gov Pharmaceutical firms deploy inline spectrophotometers to ensure tablet coatings match reference spectra that correlate with dissolution profiles. Food-brand owners monitor label color so recycled substrates still deliver consistent shelf appeal. The move to plant-based and recycled materials, which can vary in base shade, intensifies the need for continuous measurement under ISO 13655 conditions.[4] International Organization for Standardization, “ISO 13655:2017,” iso.org
Restraints Impact Analysis*
| Restraint | (~) % Impact on CAGR Forecast | Geographic Relevance | Impact Timeline |
|---|---|---|---|
| High Upfront Cost and ROI Concerns | -0.9% | Global, strongest in South America and Middle East and Africa | Short Term (≤ 2 Years) |
| Ambient-Light Sensitivity and Calibration Complexities | -0.6% | Global, especially outdoor deployments | Medium Term (2–4 Years) |
| Availability of Low-Cost Monochrome Alternatives | -0.4% | Asia-Pacific and South America | Short Term (≤ 2 Years) |
| Rare-Earth Photodiode Material Supply Volatility | -0.3% | Global supply chains tied to China | Long Term (≥ 4 Years) |
| Source: Mordor Intelligence | |||
High Upfront Cost and ROI Concerns
An inline color station, including a sensor, optics, and integration software, can cost more than USD 10,000, a hurdle for smaller factories with limited capital. Return-on-investment calculations for color detection systems are highly variable, since they depend on scrap rates, production throughput, and the scale of deployment, which makes managers cautious about committing capital until external pressure, such as rising labor costs or stricter customer quality clauses, forces their hand. This hesitation has historically slowed adoption, but vendors are increasingly addressing it with flexible business models that reduce financial risk.
Ambient-Light Sensitivity and Calibration Complexities
Color detectors, which measure reflected light, are inherently sensitive to variations in illumination, viewing angle, and surface texture, leading to drift in readings under real-world conditions. This challenge is particularly pronounced in outdoor farming drones, where shifting sunlight alters spectral balance, and in foundry environments, where heat and dust interfere with sensor stability. To mitigate these issues, manufacturers employ techniques such as active LED illumination to standardize lighting, ratiometric sampling to normalize signal fluctuations, and on-chip reference pixels to provide internal baselines.
*Our forecasts treat driver/restraint impacts as directional, not additive. The impact forecasts reflect baseline growth, mix effects, and variable interactions.
Segment Analysis
By Sensor Type: Spectral Sensors Expand Beyond RGB Norms
RGB sensors held 41.27% of the color-detection sensor market share in 2025, maintaining volume leadership because three-channel data satisfies many consumer electronics and automotive applications. Spectral devices, however, are registering a 7.61% CAGR as pharmaceutical coatings, precision agriculture, and counterfeit-protection applications demand wavelength-resolved insight. RGB+IR hybrids bridge the gap by adding near-infrared channels that enhance heart-rate readings and low-light contrast.
Spectral architectures capture detailed signatures that reveal composition and layer thickness, which RGB cannot see. Hyperspectral payloads on drones scan hundreds of bands to map crop health, while inline arrays monitor additive manufacturing layers for color drift linked to powder degradation. CMOS image sensors continue to ride semiconductor cost curves, turning once-premium features into standard options for mid-range devices. Photodiode arrays, though lacking imagery, deliver exceptional signal-to-noise and remain staples in web inspection where spatial resolution matters less than spectral fidelity.


By Form Factor: Embedded Integration Gains Ground
Embedded units accounted for 38.32% of 2025 revenue and are growing at 7.18% as designers drop bare dies next to processors, trimming board count and easing heat management. Discrete modules remain relevant for retrofits and labs, where swap-outs simplify maintenance, while OEM bare dies serve high-volume lines that can absorb the costs of custom engineering.
Smartphone makers now co-locate color pixels with camera arrays to share lenses and illumination, saving space and power. Industrial-control houses embed color channels into I/O cards that plug straight into fieldbus networks, clearing cabinet space once reserved for standalone controllers. Automotive suppliers integrate tiny detectors into headlamps so adaptive beams shift hue with the weather, and into interior trims to balance ambient lighting. Although embedded designs are rising fastest, discrete and OEM options will persist where modularity or extreme temperature ratings dominate selection criteria.
By End-User Industry: Healthcare Climbs the Adoption Curve
Consumer electronics accounted for 29.76% of 2025 demand, driven by massive handset and wearable volumes. Healthcare is accelerating at 7.97% CAGR to 2031 as point-of-care colorimetry replaces lab work for blood glucose, hemoglobin, and cholesterol tests. Food and beverage operations rely on hue to control roasting, baking, and frying stages that define flavor and moisture. Chemicals, textiles, and automotive firms each use real-time color checks to avoid costly rework.
Clinical developers are validating smartphone-based assays that achieve laboratory-grade accuracy without venous draws, opening reimbursement pathways once regulatory clearance is granted. Food processors correlate surface color with internal moisture to guarantee uniform roasts, and tablet makers track coating shade to confirm dissolution profiles. Textiles deploy sensors along dye baths to hold shade across kilometers of fabric, while automotive paint shops use multi-angle spectrophotometers to align metallic flakes on panels from different plants. Price erosion continues in consumer devices, yet healthcare units maintain premium margins due to traceability and validation requirements.
Geography Analysis
Asia-Pacific captured 37.54% of global revenue in 2025 and is forecast to post a 7.56% CAGR through 2031. China’s handset and wearable assembly complexes integrate hundreds of millions of RGB+IR chips each year, while Japan leverages robotics expertise to add color checks to welding and painting cells. India’s generic pharmaceutical leaders deploy inline spectrophotometers to meet FDA import requirements, and Singapore and Malaysia house semiconductor back-end plants where color-sensing systems validate printed solder paste. Australia, meanwhile, mounts hyperspectral rigs on drones to survey broadacre farms, improving fertilizer targeting.
North America follows closely, driven by stringent FDA color additive rules that require pharmaceutical makers to validate every lot. Detroit paint shops rely on instant tint checks to avoid warranty claims, and U.S. aerospace primes use color vision to inspect composite layers. Canada’s food packagers and Mexico’s fast-growing auto plants are integrating color stations to meet export targets.
Europe maintains leadership in machine-vision research and packaging legislation. German carmakers combine color and texture analysis to guarantee consistent finishes across global supply chains, and French food regulators enforce tight label-tone tolerance. The United Kingdom’s pharma sector accelerated inline adoption after Brexit shifted compliance paperwork in-house. South America and the Middle East and Africa remain smaller today, yet Brazilian textile mills and Saudi petrochemical refineries are installing ruggedized sensors as part of broader Industry 4.0 investments.

Competitive Landscape
The color detection sensor market is moderately fragmented. Industrial mainstays such as SICK, Keyence, and Omron face rising competition from photodiode specialists, including ams-OSRAM and Hamamatsu Photonics. Leaders differentiate by merging color data with distance or surface-texture metrics in a single package, reducing hardware counts on crowded lines. Smaller firms like Spectricity and SensoPart focus on CMOS spectral chips that promise hyperspectral performance at RGB pricing, pushing incumbents to accelerate their own spectral roadmaps.
Strategic moves include vertical integration: sensor vendors acquire optics makers to secure prisms, filters, and illumination modules. Horizontal partnerships are also expanding as automation-platform providers embed third-party sensors to offer turnkey inspection suites. Edge-compute designs place machine-learning inference on the sensor, cutting latency and network load. Patent filings reveal attention to rare-earth-free photodiodes that sidestep geopolitical supply risks, and to self-calibration routines that reference on-chip standards to slash maintenance.
Standard bodies such as the IEC and IEEE are drafting interoperability profiles so robots, PLCs, and cloud dashboards can consume spectral data without proprietary middleware. As handset volumes plateau, vendors redeploy R&D toward industrial and healthcare verticals, which promise longer product cycles and higher margins. Success will belong to firms that couple hardware with subscription analytics, turning sporadic sensor sales into recurring revenue built on predictive maintenance and continuous improvement.
Color Detection Sensor Industry Leaders
SICK AG
Ams-Osram AG
Keyence Corporation
Omron Corporation
Vishay Intertechnology Inc.
- *Disclaimer: Major Players sorted in no particular order

Recent Industry Developments
- December 2025: Datalogic secured
- November 2025: SICK expanded its ColorGATE line with a 32-band hyperspectral model targeting pharma and food producers seeking FDA 21 CFR Part 11 compliance.
- September 2025: ams-OSRAM reached a multi-year, USD 50 million agreement to supply 14-channel spectral sensors for a forthcoming flagship smartphone, enabling clinical-grade health metrics.
- June 2025: SinceVision released the IP67-rated SS1 color sensor with active LED illumination, winning early orders from textile mills and recycling plants.


Global Color Detection Sensor Market Report Scope
The Color Detection Sensor Market Report is Segmented by Sensor Type (RGB, RGB+IR, Spectral, CMOS, Photodiode Array), Form Factor (Discrete Module, Embedded, OEM), End-User Industry (Food and Beverage, Healthcare, Chemical, Textile, Automotive, Consumer Electronics, Rest), and Geography (North America, South America, Europe, Asia-Pacific, Middle East and Africa). Market Forecasts are Provided in Terms of Value (USD).
| RGB |
| RGB+IR |
| Spectral |
| CMOS |
| Photodiode Array |
| Discrete Module |
| Embedded |
| OEM |
| Food and Beverage |
| Healthcare |
| Chemical |
| Textile |
| Automotive |
| Consumer Electronics |
| Rest of End-User Industries |
| North America | United States |
| Canada | |
| Mexico | |
| South America | Brazil |
| Argentina | |
| Rest of South America | |
| Europe | Germany |
| United Kingdom | |
| France | |
| Italy | |
| Spain | |
| Rest of Europe | |
| Asia-Pacific | China |
| Japan | |
| India | |
| Singapore | |
| Australia | |
| Malaysia | |
| Rest of Asia-Pacific | |
| Middle East | Saudi Arabia |
| United Arab Emirates | |
| Rest of Middle East | |
| Africa | South Africa |
| Egypt | |
| Rest of Africa |
| By Sensor Type | RGB | |
| RGB+IR | ||
| Spectral | ||
| CMOS | ||
| Photodiode Array | ||
| By Form Factor | Discrete Module | |
| Embedded | ||
| OEM | ||
| By End-User Industry | Food and Beverage | |
| Healthcare | ||
| Chemical | ||
| Textile | ||
| Automotive | ||
| Consumer Electronics | ||
| Rest of End-User Industries | ||
| By Geography | North America | United States |
| Canada | ||
| Mexico | ||
| South America | Brazil | |
| Argentina | ||
| Rest of South America | ||
| Europe | Germany | |
| United Kingdom | ||
| France | ||
| Italy | ||
| Spain | ||
| Rest of Europe | ||
| Asia-Pacific | China | |
| Japan | ||
| India | ||
| Singapore | ||
| Australia | ||
| Malaysia | ||
| Rest of Asia-Pacific | ||
| Middle East | Saudi Arabia | |
| United Arab Emirates | ||
| Rest of Middle East | ||
| Africa | South Africa | |
| Egypt | ||
| Rest of Africa | ||


Key Questions Answered in the Report
What is the forecast value of the color detection sensor market in 2031?
The market is projected to reach USD 2.37 billion by 2031.
How fast is the market expected to grow after 2026?
It is forecast to expand at a 6.63% CAGR between 2026 and 2031.
Which sensor type is gaining traction fastest?
Spectral sensors are advancing at a 7.61% CAGR, outpacing RGB and RGB+IR designs.
Why is Asia-Pacific the leading region?
High-volume smartphone assembly, rising industrial automation, and stringent export quality standards give the region a 37.54% share with the fastest regional CAGR.
What restraint most affects adoption in small factories?
High upfront cost and uncertain ROI slow deployments, especially in price-sensitive economies.
Which industry vertical offers the strongest growth opportunity?
Healthcare is expanding at 7.97% CAGR as non-invasive diagnostics and remote monitoring roll out.
Page last updated on:


