Cocoa Beans Market Size and Share
Cocoa Beans Market Analysis by Mordor Intelligence
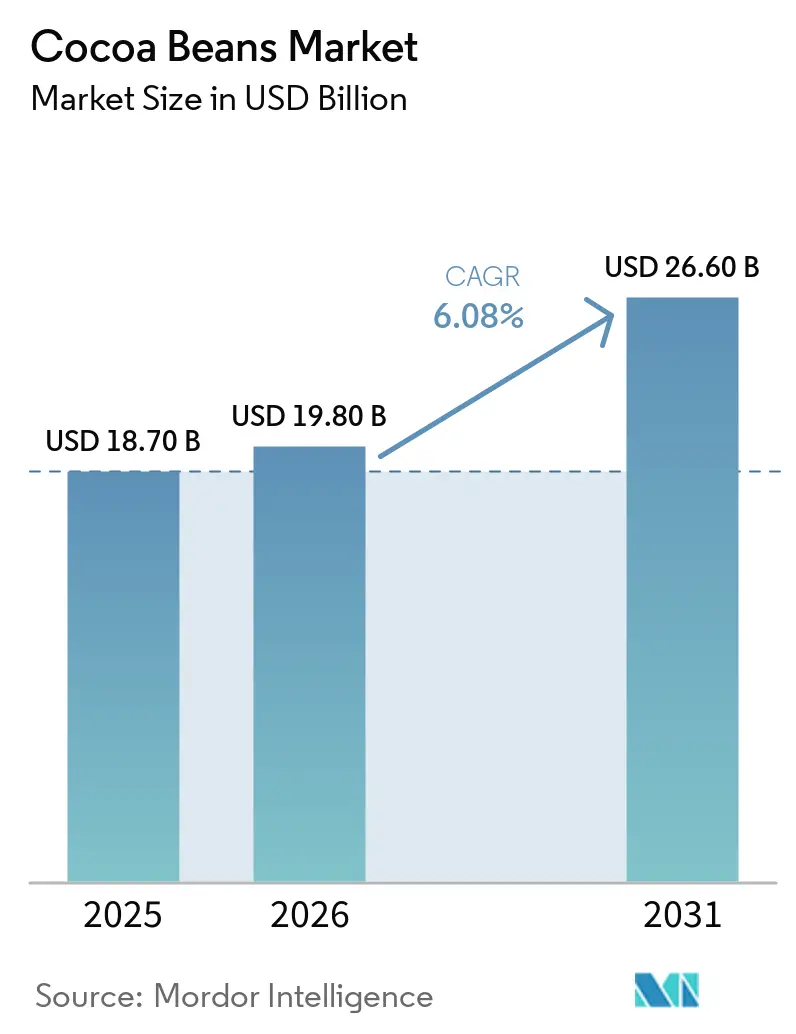
The cocoa beans market size was valued at USD 18.70 billion in 2025 and is estimated to reach USD 19.80 billion in 2026, further projected to grow to USD 26.60 billion by 2031, advancing at a CAGR of 6.08% during the forecast period (2026 to 2031). Rising confectionery demand, expanding sustainability requirements in Europe and North America, and strategic supply-chain diversification by processors are driving growth. Tight weather-linked supply, especially in West Africa, is lifting farm-gate prices, accelerating technology adoption at origin, and encouraging grinding at origin to reduce freight exposure. Leading traders are intensifying investments in vertical integration and traceability to comply with the European Union Deforestation Regulation. Meanwhile, niche craft chocolatiers are disrupting premium channels by sourcing directly from producer cooperatives, fragmenting margins in the higher-grade segment. Production momentum is gradually shifting toward Indonesia, Ecuador, and Vietnam as governments back climate-smart farming and post-harvest infrastructure.
Key Report Takeaways
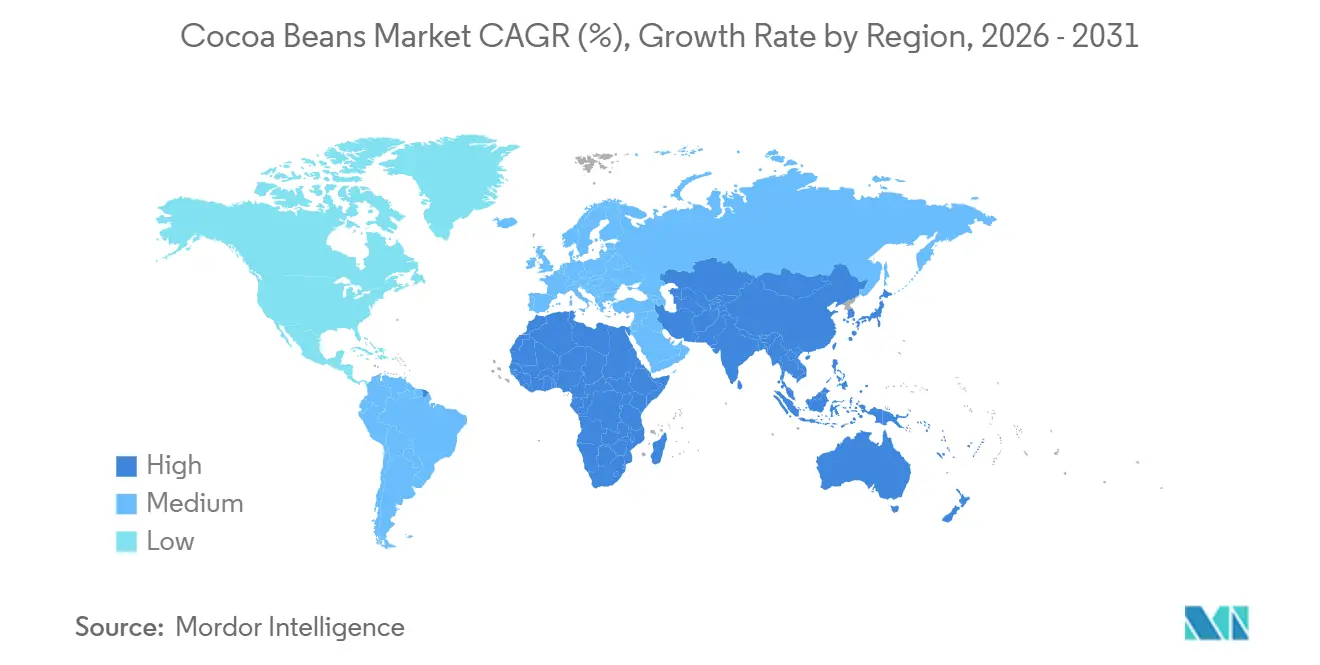
- By geography, Europe commanded a 38.2% share of the cocoa beans market in 2025, while Asia-Pacific was set to lead with a projected CAGR of 4.9% through 2031.
Note: Market size and forecast figures in this report are generated using Mordor Intelligence’s proprietary estimation framework, updated with the latest available data and insights as of January 2026.
Global Cocoa Beans Market Trends and Insights
Drivers Impact Analysis*
| Driver | (~) % Impact on CAGR Forecast | Geographic Relevance | Impact Timeline |
|---|---|---|---|
| Rising Need for Cocoa Beans in Chocolate Manufacturing | +2.2% | Global | Short term (≤ 2 years) |
| Growth in Precision and Climate-Smart Farming Practices | +1.0% | Africa, South America, and the Asia-Pacific | Medium term (2-4 years) |
| Supportive Government Sustainability Programs and Subsidies | +0.8% | Africa and Global | Medium term (2-4 years) |
| Rising Presence of Cocoa-Based Functional Beverages | +0.6% | North America, the Asia-Pacific, and Europe | Short term (≤ 2 years) |
| Rising Demand for Fine-Flavor Beans in Premium Craft Chocolate | +0.7% | North America, Europe, and the Asia-Pacific | Long term (≥ 4 years) |
| Commodity Market Inflows Supported by Inflation Hedging Demand | +0.4% | Global | Short term (≤ 2 years) |
| Source: Mordor Intelligence | |||
Rising Need for Cocoa Beans in Chocolate Manufacturing
The chocolate category remains the main demand base for the cocoa beans market because core confectionery use still accounts for the majority of bean processing worldwide. The International Cocoa Organization (ICCO) reported grindings of 4.6 million metric tons in the 2025-26 crop year, a lower figure that reflected temporary processor caution and inventory drawdowns. As Chinese consumers become more health-conscious, there is a growing trend towards healthier, more natural chocolate confectionery. This has led to increased demand for dark chocolate due to its perceived health benefits. Additionally, there has been a shift towards premium and artisanal chocolate brands, reflecting a desire for higher-quality, more unique chocolate experiences [1]Source: General Administration of Customs of the People’s Republic of China, “Chocolate Import Trends 2025,” english.customs.gov.cn.. As of early 2026, Mondelez International has intensified its cocoa sourcing in Asia, aligned with a broader strategy to ensure 100% of its cocoa volume for chocolate brands is sourced through its Cocoa Life sustainability program, underscoring the region’s influence on the cocoa beans market.
Growth in Precision and Climate-Smart Farming Practices
Climate-smart agricultural practices are becoming increasingly important across major cocoa-producing countries as growers respond to rising disease pressure, aging tree stock, and climate variability. Research in Ghana and other West African cocoa regions shows growing adoption of integrated pest management, rehabilitation planting, and improved farm-management practices to strengthen yields and resilience. Ghana also continued cocoa rehabilitation programs from 2024 to 2025 through expanded distribution of improved planting materials and farm-recovery initiatives. Côte d’Ivoire has accelerated digital monitoring and sustainability programs, including satellite-based mapping and traceability systems designed to improve disease management and compliance with international sourcing standards. Indonesia and Ecuador are also investing in post-harvest quality improvement and traceability infrastructure to strengthen export competitiveness and premium cocoa positioning. These initiatives support higher-quality production, reduced post-harvest losses, and improved supply-chain transparency across the global cocoa sector.
Supportive Government Sustainability Programs and Subsidies
Public-sector support continues to stabilize the cocoa bean market, as farm economics and disease control in West Africa cannot be managed solely by private buyers. In April 2026, the FAO (Food and Agriculture Organization) introduced a five-year roadmap for Côte d’Ivoire and Ghana focused on CSSVD (Cocoa Swollen Shoot Virus Disease) containment through replanting, surveillance, farmer compensation, and stronger coordination. Ghana also expanded climate-smart initiatives under the GCFRP (Ghana Cocoa Forest REDD Plus Program), distributing USD 21.8 million to nearly 24,000 farmers in Atewa. In February 2026, the country reformed cocoa pricing by linking producer prices more closely to global FOB benchmarks and guaranteeing farmers at least 70% of the gross FOB (Freight On Board) price. These measures support farmer participation, encourage replanting, reduce the risk of crop abandonment, and improve long-term market stability and investment confidence.
Rising Presence of Cocoa-Based Functional Beverages
The cocoa beans market is gaining an additional source of demand from functional beverages, where cocoa ingredients are increasingly used beyond traditional confectionery products. In 2025, cocoa-based functional beverages, including flavonol-rich extracts for wellness, supplements, and sports nutrition, became one of the fastest-growing application areas in the Asia-Pacific. Growth is particularly strong in India, China, Japan, and South Korea, where health-focused positioning and premium product trends are driving new product launches. The rising popularity of high-cacao and lower-sugar formulations is also expanding opportunities for cocoa ingredient suppliers in health-oriented beverage categories. Although these products remain smaller than mainstream confectionery, they help diversify cocoa demand and support the use of premium powders, extracts, and origin-specific ingredients. Over time, this trend is anticipated to strengthen the connection between cocoa consumption and health-focused premium products, especially across the Asia-Pacific region.
Restraints Impact Analysis*
| Restraint | (~) % Impact on CAGR Forecast | Geographic Relevance | Impact Timeline |
|---|---|---|---|
| Increasing Climate and Disease Pressures in Cocoa-Producing Regions | -1.4% | Africa and Brazil | Short term (≤ 2 years) |
| Rising Adoption of Cocoa Butter Equivalents and Artificial Flavoring Solutions | -0.7% | Global cost-sensitive segments | Medium term (2-4 years) |
| ESG Scrutiny Increasing Compliance Costs for Traders | -0.5% | Europe and North America | Medium term (2-4 years) |
| Rising Volatility in Freight Rates and Port Congestion | -0.4% | West Africa and Asia-Pacific ports | Short term (≤ 2 years) |
| Source: Mordor Intelligence | |||
Increasing Climate and Disease Pressures in Cocoa-Producing Regions
Disease and weather risks remain the main production challenges in the cocoa beans market, affecting supply, bean quality, and long-term farm productivity. CSSVD (Cocoa Swollen Shoot Virus Disease) impacted more than 40% of farms in Côte d’Ivoire during the 2024–25 season, putting a significant share of the national supply at risk[2]Source: Food and Agriculture Organization, “Five Years and Five Levers to Roll Back Cocoa Swollen Shoot Disease in Côte d'Ivoire and Ghana,” Food and Agriculture Organization, fao.org. Climate change is adding further pressure, with studies projecting a decline in suitable cocoa-growing areas under high-emission scenarios. Beyond reducing output, disease can lower bean fat content and increase waste ratios, weakening processing economics and operational efficiency. This was reflected in Cargill, Incorporated’s suspension of cocoa grinding operations in Côte d’Ivoire in September 2025 due to quality concerns. Although FAO-led coordination efforts support recovery, effective disease control will require sustained funding, farmer participation, and multiple crop cycles, making biological risk a long-term challenge for the market.
Rising Adoption of Cocoa Butter Equivalents and Synthetic Flavor Compounds
Substitution risk is becoming more significant in the cocoa beans market as manufacturers adopt cocoa butter alternatives and cocoa-free formulations to manage rising costs and sustainability goals. In May 2026, Cargill, Incorporated and Voyage Foods expanded North American distribution of NextCoa, a cocoa-free confectionery alternative with a substantially lower carbon footprint than traditional cocoa ingredients. This highlights the shift of substitution products from development stages into commercial distribution backed by major industry players. The risk is greatest in lower-cost product categories where cocoa flavor can be replicated, and consumers are more price-sensitive. Although premium chocolate demand is anticipated to remain resilient due to the importance of origin and flavor authenticity, alternative ingredients could reduce demand in lower-value industrial segments. If cocoa prices remain elevated, investment and adoption of these substitutes are likely to increase further.
*Our forecasts treat driver/restraint impacts as directional, not additive. The impact forecasts reflect baseline growth, mix effects, and variable interactions.
Geography Analysis
Europe accounted for 38.2% of cocoa consumption globally in 2025 and remains a key region in the cocoa beans market due to its extensive grinding and chocolate-manufacturing infrastructure. Germany, the Netherlands, Belgium, France, and the United Kingdom dominate the region's processing capacity. However, the market is increasingly influenced by traceability requirements, sustainability initiatives, and stricter sourcing controls linked to the European Union Deforestation Regulation (EUDR). European processors also face growing challenges related to decarbonization investments, compliance costs, and supply chain transparency requirements.
The Asia-Pacific region is projected to be the fastest-growing in the cocoa beans market, with a CAGR of 4.9% through 2031. Factors such as rising chocolate consumption, urbanization, and the expanding middle-class populations in China, India, and Southeast Asia drive regional demand growth. Indonesia remains a significant regional producer, while China and India emerge as important consumer markets. Additionally, Singapore and Malaysia continue to play critical roles as regional hubs for trading and processing in the cocoa supply chain.
Africa continues to be the dominant cocoa-producing region globally. However, production conditions are increasingly impacted by weather volatility, disease outbreaks, and infrastructure challenges in major producing countries such as Côte d’Ivoire and Ghana. Virus outbreaks, drought conditions, and tighter global stocks contribute to elevated cocoa prices during 2024–2025. Cameroon and Nigeria are rehabilitating farms, but port delays in Douala and Lagos dent competitiveness. Uganda entered the supply map with Olam’s new fermentation unit that serves East African grinders. Ghana’s seedling program and Côte d’Ivoire’s satellite alerts are to buttress medium-term stability, anchoring Africa’s prominent role in the cocoa beans market[3]Source: International Cocoa Organization, “February 2026 Quarterly Bulletin of Cocoa Statistics,” International Cocoa Organization, icco.org.


Competitive Landscape
The cocoa beans market remains highly fragmented at the farm level, with the majority of global cocoa production supplied by smallholder farmers managing relatively small farms, particularly in West Africa. Cooperatives play a significant role in aggregation, sourcing, certification, and the establishment of export linkages within the market structure. Traceability is becoming increasingly critical as stricter deforestation and sustainability regulations raise compliance requirements across global cocoa supply chains. In Côte d’Ivoire, export sourcing models vary significantly among companies, with some relying heavily on direct cooperative sourcing, while others maintain broader intermediary networks.
Processing within origin countries is gaining importance as a competitive factor in the cocoa beans market. Ghana continues to promote domestic cocoa processing as part of its broader value-addition strategy, encouraging increased local grinding capacity and downstream manufacturing investments. This trend is gradually shifting portions of bean availability toward domestic processors, strengthening regional processing economics. Investments supported by development-finance institutions and private-sector expansion projects are also contributing to higher utilization rates at selected processing facilities.
Regional grinding performance has shown mixed trends across the cocoa beans market. Asian processing hubs, such as Malaysia, have experienced periods of stronger grinding activity, while some European processing regions have faced softer volumes during times of elevated cocoa prices and supply constraints. North American processors have generally demonstrated greater resilience due to stronger hedging capabilities and diversified procurement structures. Technology, certification systems, and traceability infrastructure are increasingly becoming competitive differentiators, particularly as sustainability compliance and supply-chain transparency requirements intensify. Additionally, the emergence of cocoa-alternative ingredients and lower-carbon confectionery products highlights a growing long-term substitution risk for portions of commodity-grade cocoa demand.
Recent Industry Developments
- May 2026: Cargill, Incorporated and Voyage Foods announced a North American distribution partnership for Voyage’s cocoa-free chocolate alternative products, including NextCoa. Voyage Foods has publicly promoted a significantly lower environmental impact than conventional cocoa.
- May 2026: Guan Chong Berhad finalized its acquisition of a 25% stake in TRANSCAO-CI for EUR 28.08 million (USD 30.7 million), gaining a strategic foothold in Côte d'Ivoire's processing sector and gaining access to TRANSCAO-CI's 100,000 metric tons of combined processing capacity at San Pedro and the newly commissioned PK 24 industrial complex.
- April 2026: Hartree Partners completed the acquisition of Touton SAS, creating a commodities-house-backed cocoa originator processing around 308,000 metric tons of cocoa annually. Touton retains its brand, leadership team, and sustainability programs, and the deal was cleared by the European Commission under the European Union Merger Regulation in February 2026.


Research Methodology Framework and Report Scope
Market Definitions and Key Coverage
Our study defines the global cocoa beans market as the value of whole, fermented and dried beans of Theobroma cacao that enter formal trade channels for onward processing into liquor, butter, or powder. Coverage spans production, trade, and apparent consumption in value (USD) and volume terms across five broad regions.
Explicitly excluded are downstream chocolate confectionery, intermediate derivatives sold separately, and any beans moving through purely informal barter chains.
Segmentation Overview
- By Geography
- North America
- United States
- Production Analysis (Area Harvested, Yield, and Production Volume)
- Consumption Analysis (Consumption Value and Volume)
- Import Market Analysis (Import Value, Volume, and Key Supplying Markets)
- Export Market Analysis (Export Value, Volume, and Key Destination Markets)
- Wholesale Price Trend Analysis and Forecast
- Regulatory Framework
- List of Key Players
- Logistics and Infrastructure
- Seasonality Analysis
- Canada
- Production Analysis (Area Harvested, Yield, and Production Volume)
- Consumption Analysis (Consumption Value and Volume)
- Import Market Analysis (Import Value, Volume, and Key Supplying Markets)
- Export Market Analysis (Export Value, Volume, and Key Destination Markets)
- Wholesale Price Trend Analysis and Forecast
- Regulatory Framework
- List of Key Players
- Logistics and Infrastructure
- Seasonality Analysis
- United States
- Europe
- Germany
- Production Analysis (Area Harvested, Yield, and Production Volume)
- Consumption Analysis (Consumption Value and Volume)
- Import Market Analysis (Import Value, Volume, and Key Supplying Markets)
- Export Market Analysis (Export Value, Volume, and Key Destination Markets)
- Wholesale Price Trend Analysis and Forecast
- Regulatory Framework
- List of Key Players
- Logistics and Infrastructure
- Seasonality Analysis
- Netherlands
- Production Analysis (Area Harvested, Yield, and Production Volume)
- Consumption Analysis (Consumption Value and Volume)
- Import Market Analysis (Import Value, Volume, and Key Supplying Markets)
- Export Market Analysis (Export Value, Volume, and Key Destination Markets)
- Wholesale Price Trend Analysis and Forecast
- Regulatory Framework
- List of Key Players
- Logistics and Infrastructure
- Seasonality Analysis
- United Kingdom
- Production Analysis (Area Harvested, Yield, and Production Volume)
- Consumption Analysis (Consumption Value and Volume)
- Import Market Analysis (Import Value, Volume, and Key Supplying Markets)
- Export Market Analysis (Export Value, Volume, and Key Destination Markets)
- Wholesale Price Trend Analysis and Forecast
- Regulatory Framework
- List of Key Players
- Logistics and Infrastructure
- Seasonality Analysis
- France
- Production Analysis (Area Harvested, Yield, and Production Volume)
- Consumption Analysis (Consumption Value and Volume)
- Import Market Analysis (Import Value, Volume, and Key Supplying Markets)
- Export Market Analysis (Export Value, Volume, and Key Destination Markets)
- Wholesale Price Trend Analysis and Forecast
- Regulatory Framework
- List of Key Players
- Logistics and Infrastructure
- Seasonality Analysis
- Belgium
- Production Analysis (Area Harvested, Yield, and Production Volume)
- Consumption Analysis (Consumption Value and Volume)
- Import Market Analysis (Import Value, Volume, and Key Supplying Markets)
- Export Market Analysis (Export Value, Volume, and Key Destination Markets)
- Wholesale Price Trend Analysis and Forecast
- Regulatory Framework
- List of Key Players
- Logistics and Infrastructure
- Seasonality Analysis
- Russia
- Production Analysis (Area Harvested, Yield, and Production Volume)
- Consumption Analysis (Consumption Value and Volume)
- Import Market Analysis (Import Value, Volume, and Key Supplying Markets)
- Export Market Analysis (Export Value, Volume, and Key Destination Markets)
- Wholesale Price Trend Analysis and Forecast
- Regulatory Framework
- List of Key Players
- Logistics and Infrastructure
- Seasonality Analysis
- Germany
- Asia-Pacific
- India
- Production Analysis (Area Harvested, Yield, and Production Volume)
- Consumption Analysis (Consumption Value and Volume)
- Import Market Analysis (Import Value, Volume, and Key Supplying Markets)
- Export Market Analysis (Export Value, Volume, and Key Destination Markets)
- Wholesale Price Trend Analysis and Forecast
- Regulatory Framework
- List of Key Players
- Logistics and Infrastructure
- Seasonality Analysis
- Malaysia
- Production Analysis (Area Harvested, Yield, and Production Volume)
- Consumption Analysis (Consumption Value and Volume)
- Import Market Analysis (Import Value, Volume, and Key Supplying Markets)
- Export Market Analysis (Export Value, Volume, and Key Destination Markets)
- Wholesale Price Trend Analysis and Forecast
- Regulatory Framework
- List of Key Players
- Logistics and Infrastructure
- Seasonality Analysis
- Indonesia
- Production Analysis (Area Harvested, Yield, and Production Volume)
- Consumption Analysis (Consumption Value and Volume)
- Import Market Analysis (Import Value, Volume, and Key Supplying Markets)
- Export Market Analysis (Export Value, Volume, and Key Destination Markets)
- Wholesale Price Trend Analysis and Forecast
- Regulatory Framework
- List of Key Players
- Logistics and Infrastructure
- Seasonality Analysis
- Singapore
- Production Analysis (Area Harvested, Yield, and Production Volume)
- Consumption Analysis (Consumption Value and Volume)
- Import Market Analysis (Import Value, Volume, and Key Supplying Markets)
- Export Market Analysis (Export Value, Volume, and Key Destination Markets)
- Wholesale Price Trend Analysis and Forecast
- Regulatory Framework
- List of Key Players
- Logistics and Infrastructure
- Seasonality Analysis
- Japan
- Production Analysis (Area Harvested, Yield, and Production Volume)
- Consumption Analysis (Consumption Value and Volume)
- Import Market Analysis (Import Value, Volume, and Key Supplying Markets)
- Export Market Analysis (Export Value, Volume, and Key Destination Markets)
- Wholesale Price Trend Analysis and Forecast
- Regulatory Framework
- List of Key Players
- Logistics and Infrastructure
- Seasonality Analysis
- India
- South America
- Brazil
- Production Analysis (Area Harvested, Yield, and Production Volume)
- Consumption Analysis (Consumption Value and Volume)
- Import Market Analysis (Import Value, Volume, and Key Supplying Markets)
- Export Market Analysis (Export Value, Volume, and Key Destination Markets)
- Wholesale Price Trend Analysis and Forecast
- Regulatory Framework
- List of Key Players
- Logistics and Infrastructure
- Seasonality Analysis
- Ecuador
- Production Analysis (Area Harvested, Yield, and Production Volume)
- Consumption Analysis (Consumption Value and Volume)
- Import Market Analysis (Import Value, Volume, and Key Supplying Markets)
- Export Market Analysis (Export Value, Volume, and Key Destination Markets)
- Wholesale Price Trend Analysis and Forecast
- Regulatory Framework
- List of Key Players
- Logistics and Infrastructure
- Seasonality Analysis
- Brazil
- Middle East
- United Arab Emirates
- Production Analysis (Area Harvested, Yield, and Production Volume)
- Consumption Analysis (Consumption Value and Volume)
- Import Market Analysis (Import Value, Volume, and Key Supplying Markets)
- Export Market Analysis (Export Value, Volume, and Key Destination Markets)
- Wholesale Price Trend Analysis and Forecast
- Regulatory Framework
- List of Key Players
- Logistics and Infrastructure
- Seasonality Analysis
- Saudi Arabia
- Production Analysis (Area Harvested, Yield, and Production Volume)
- Consumption Analysis (Consumption Value and Volume)
- Import Market Analysis (Import Value, Volume, and Key Supplying Markets)
- Export Market Analysis (Export Value, Volume, and Key Destination Markets)
- Wholesale Price Trend Analysis and Forecast
- Regulatory Framework
- List of Key Players
- Logistics and Infrastructure
- Seasonality Analysis
- Iran
- Production Analysis (Area Harvested, Yield, and Production Volume)
- Consumption Analysis (Consumption Value and Volume)
- Import Market Analysis (Import Value, Volume, and Key Supplying Markets)
- Export Market Analysis (Export Value, Volume, and Key Destination Markets)
- Wholesale Price Trend Analysis and Forecast
- Regulatory Framework
- List of Key Players
- Logistics and Infrastructure
- Seasonality Analysis
- United Arab Emirates
- Africa
- Ghana
- Production Analysis (Area Harvested, Yield, and Production Volume)
- Consumption Analysis (Consumption Value and Volume)
- Import Market Analysis (Import Value, Volume, and Key Supplying Markets)
- Export Market Analysis (Export Value, Volume, and Key Destination Markets)
- Wholesale Price Trend Analysis and Forecast
- Regulatory Framework
- List of Key Players
- Logistics and Infrastructure
- Seasonality Analysis
- Cote d'Ivoire
- Production Analysis (Area Harvested, Yield, and Production Volume)
- Consumption Analysis (Consumption Value and Volume)
- Import Market Analysis (Import Value, Volume, and Key Supplying Markets)
- Export Market Analysis (Export Value, Volume, and Key Destination Markets)
- Wholesale Price Trend Analysis and Forecast
- Regulatory Framework
- List of Key Players
- Logistics and Infrastructure
- Seasonality Analysis
- Uganda
- Production Analysis (Area Harvested, Yield, and Production Volume)
- Consumption Analysis (Consumption Value and Volume)
- Import Market Analysis (Import Value, Volume, and Key Supplying Markets)
- Export Market Analysis (Export Value, Volume, and Key Destination Markets)
- Wholesale Price Trend Analysis and Forecast
- Regulatory Framework
- List of Key Players
- Logistics and Infrastructure
- Seasonality Analysis
- Nigeria
- Production Analysis (Area Harvested, Yield, and Production Volume)
- Consumption Analysis (Consumption Value and Volume)
- Import Market Analysis (Import Value, Volume, and Key Supplying Markets)
- Export Market Analysis (Export Value, Volume, and Key Destination Markets)
- Wholesale Price Trend Analysis and Forecast
- Regulatory Framework
- List of Key Players
- Logistics and Infrastructure
- Seasonality Analysis
- Cameroon
- Production Analysis (Area Harvested, Yield, and Production Volume)
- Consumption Analysis (Consumption Value and Volume)
- Import Market Analysis (Import Value, Volume, and Key Supplying Markets)
- Export Market Analysis (Export Value, Volume, and Key Destination Markets)
- Wholesale Price Trend Analysis and Forecast
- Regulatory Framework
- List of Key Players
- Logistics and Infrastructure
- Seasonality Analysis
- Ghana
- North America
Detailed Research Methodology and Data Validation
Primary Research
Interviews with farm-gate aggregators in Côte d'Ivoire and Ghana, mid-stream grinders in the Netherlands and Malaysia, and procurement managers at beverage innovators in the United States allow us to test secondary ratios, sense-check unit prices, and refine yield loss and contract premium assumptions that desktop work alone cannot surface.
Desk Research
During desk research, we draw first on high-credibility, open datasets such as FAOSTAT crop balances, UN Comtrade trade codes 1801 and 1803, International Cocoa Organization quarterly bulletins, and price series from the World Bank Commodities database. Alongside public statistics, our team screens scholarly journals on plant science and climate resilience, plus policy notes from ECOWAS and the European Parliament that frame sustainability and traceability rules affecting bean flows.
Company annual reports, IPO filings, and audited processor capacity disclosures supply conversion yields and utilization benchmarks, which are then contrasted with shipment-level insights gathered through D&B Hoovers and Volza. The sources named are illustrative; many further records inform data collection, validation, and clarification.
Market-Sizing & Forecasting
For quantification, we apply a top-down production and trade reconstruct: starting with harvested tonnage, subtracting farm losses, and valuing the clean bean pool at region-specific average selling prices. Results are corroborated through selective bottom-up roll-ups of grinder capacity and sampled average selling price multiplied by volume invoices, which help us adjust for unreported artisan flows. Key variables feeding the model include hectare yields, certified-bean penetration, terminal exchange prices, grind-to-press ratios, and regional dark-chocolate share of confectionery demand. Scenario analysis coupled with multivariate regression against GDP per capita and retail chocolate spend projects the market from 2025 to 2030. Where bottom-up evidence lags, interpolation is guided by three-year moving averages of ICCO stock-to-grind ratios.
Data Validation & Update Cycle
Before finalization, Mordor analysts run variance checks against ICCO supply balances and customs data outliers, escalate anomalies for peer review, and document every adjustment. Reports refresh annually, with interim updates triggered by material events such as extreme price shocks or regulatory changes; a fresh analyst pass occurs just prior to delivery so clients receive the latest view.
Why Mordor's Cocoa Beans Baseline Commands Reliability
Published estimates often diverge because firms choose different bean definitions, price assumptions, and refresh cadences. According to Mordor Intelligence, anchoring the baseline in physically traded beans and vetting price series directly with grinders keeps our figure grounded and repeatable.
The main spread in values arises when other publishers fold in derivatives, apply constant-currency conversions, or extrapolate aggressive premium penetration without validating certified-bean supply.
Benchmark comparison
| Market Size | Anonymized source | Primary gap driver |
|---|---|---|
| USD 14.40 B (2025) | Mordor Intelligence | - |
| USD 13.54 B (2023) | Global Consultancy A | Includes cocoa butter and powder revenues; older base year; currency fixed at 2023 rates |
| USD 13.67 B (2024) | Regional Consultancy A | Assumes uniform farm-gate prices, limited grinder interviews, and no stock reconciliation |
| USD 14.60 B (2025) | Trade Journal B | Mixes organic and conventional beans yet applies a single price curve; excludes re-exports |
Taken together, the comparison shows that Mordor's disciplined scope selection, live price validation, and balanced triangulation provide a dependable decision-making baseline for stakeholders seeking clarity in a highly volatile commodity landscape.


Key Questions Answered in the Report
What is the 2026 value of cocoa bean demand?
The cocoa beans market stands at USD 19.80 billion in 2026 and is projected to reach USD 26.60 billion by 2031 at a 6.08% CAGR.
Which region leads global cocoa consumption?
Europe led consumption with a 38.2% share in 2025, even though Asia-Pacific is growing faster through 2031.
Why is Ecuador becoming more important in cocoa sourcing?
Ecuador combines stronger yields, export growth, fine-aroma positioning, and easier alignment with traceability requirements, which makes it attractive for both premium and industrial buyers.
What is the biggest risk to future cocoa supply?
Disease and climate stress in West Africa remain the biggest risk, with Cocoa Swollen Shoot Virus Disease (CSSVD) affecting large number of farms in Côte d'Ivoire.
Page last updated on:


