Areca Nuts Market Size and Share
Areca Nuts Market Analysis by Mordor Intelligence
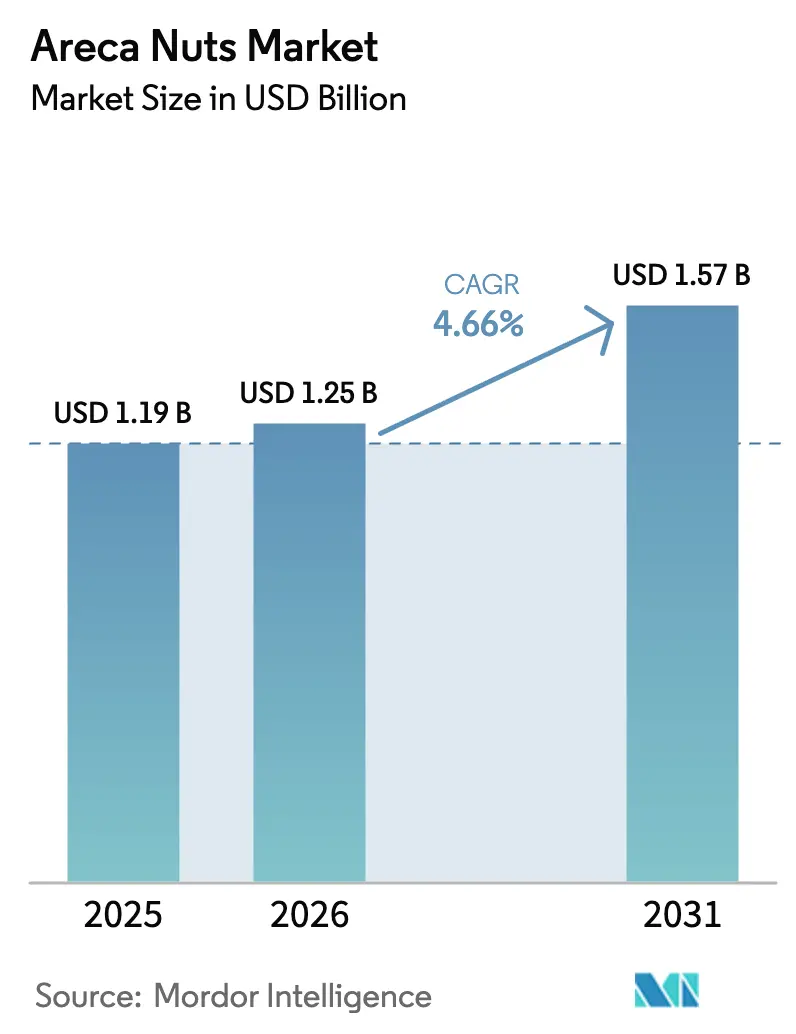
The areca nut market size was valued at USD 1.19 billion in 2025 and estimated to grow from USD 1.25 billion in 2026 to reach USD 1.57 billion by 2031, at a CAGR of 4.66% during the forecast period (2026-2031). This steady expansion in the areca nut market stems from entrenched cultural chewing habits in South and Southeast Asia, sustained urbanization-driven demand in Nepal and Bangladesh, and premium pricing for pesticide-residue-certified shipments flowing into Gulf Cooperation Council destinations. At the same time, India’s October 2025 extension of its Minimum Import Price and 100% basic customs duty underscores an increasingly protective policy stance that tightens formal trade corridors while leaving informal flows intact. Improving post-harvest infrastructure in Indonesia, Myanmar, and Pakistan keeps farm-gate prices competitive and ensures supply diversity, while ongoing disease outbreaks such as Yellow Leaf Disease in Karnataka raise production risk and incentivize investment in integrated pest management. Against this backdrop, the areca nut market continues to balance cultural resilience with intensifying regulatory scrutiny from jurisdictions classifying the nut as a Group 1 carcinogen[1]Source: The Lancet Oncology, “Global burden of cancers attributable to areca nut use in 2020 and projections to 2040,” thelancet.com.
Key Report Takeaways
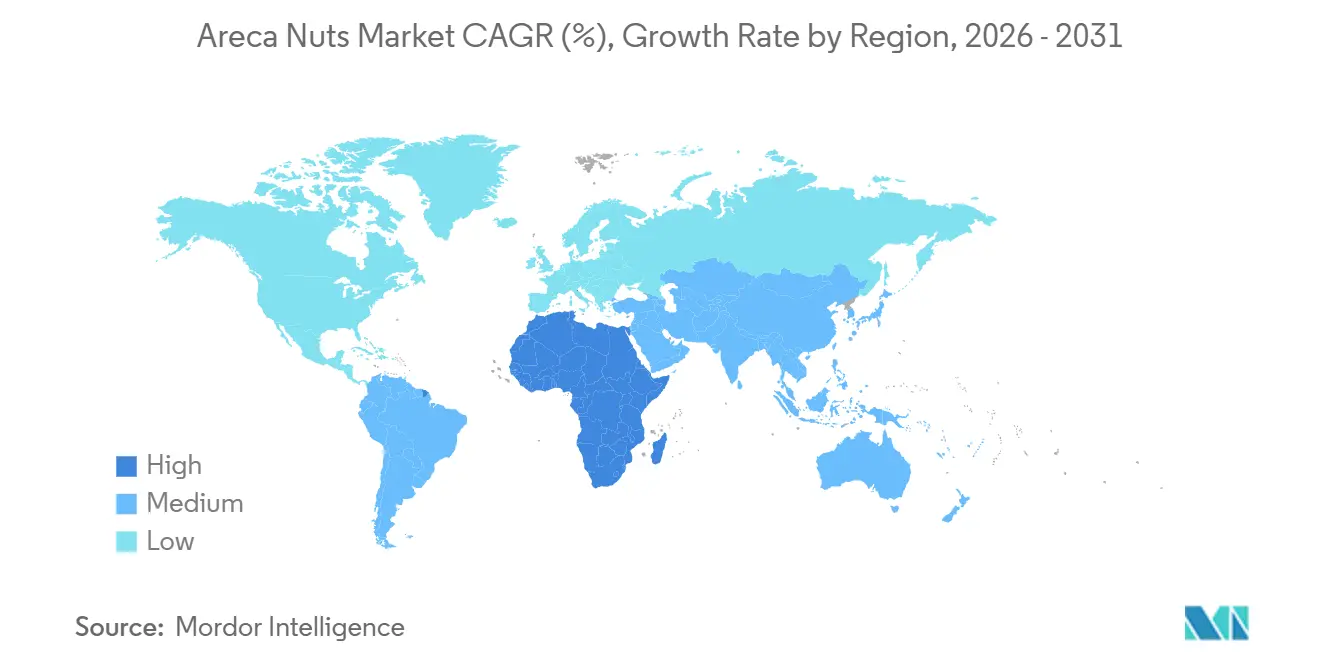
- By geography, Asia-Pacific accounted for about 88% of the Areca Nuts market size in 2025, while Africa is the fastest-growing region at a 6.1% CAGR from 2026 to 2031.
Note: Market size and forecast figures in this report are generated using Mordor Intelligence’s proprietary estimation framework, updated with the latest available data and insights as of January 2026.
Global Areca Nuts Market Trends and Insights
Drivers Impact Analysis*
| Driver | (~) % Impact on CAGR Forecast | Geographic Relevance | Impact Timeline |
|---|---|---|---|
| Enduring cultural chewing habits in South and Southeast Asia | +0.8% | India, Bangladesh, Myanmar, Indonesia, spillover to Middle East and Africa diaspora | Long term (≥ 4 years) |
| Expansion of domestic processing capacity in India and Indonesia | +0.6% | India (Karnataka, Kerala, Assam, Mizoram) and Indonesia (Jambi, West Sumatra, Southeast Sulawesi) | Medium term (2 to 4 years) |
| Protective tariff and subsidy programs in major producer countries | +0.5% | India, Indonesia, Thailand, Bangladesh, and Sri Lanka | Medium term (2 to 4 years) |
| Premium pricing for pesticide-residue-certified and organic nuts | +0.4% | India (Kerala, Karnataka), Indonesia (Agam Regency), demand from Gulf Cooperation Council, European Union, Japan | Medium term (2 to 4 years) |
| Bio-based tannin and natural-pigment demand from leather and cosmetics sectors | +0.3% | Early adoption in Europe and North America, supply from Asia-Pacific | Long term (≥ 4 years) |
| Blockchain-enabled traceability pilots among Indian cooperatives | +0.2% | Andhra Pradesh, Karnataka, Kerala clusters | Long term (≥ 4 years) |
| Source: Mordor Intelligence | |||
Enduring Cultural Chewing Habits in South and Southeast Asia
Areca nut chewing remains embedded in religious and social ceremonies across India, Bangladesh, Myanmar, and Indonesia. More than half of global output channels into chewing products, reinforcing a demand baseline that cushions the areca nut market against policy-driven shocks. Karnataka’s sun-dried white “Chali” variety commands two-thirds of domestic Indian trade because of its mild flavor, while Kerala’s boiled red nuts dominate southern mixes. Myanmar’s steamed tender product for Chinese buyers highlights innovation inside traditional usage, and Bangladesh’s Cox’s Bazar growers continue to earn robust farm-gate revenue from diaspora shipments. Even Taiwan retains significant share despite prolonged anti-chewing campaigns, underscoring habitual stickiness among older consumers.
Expansion of Domestic Processing Capacity in India and Indonesia
New slicing, flavoring, and boiling plants drive farm-gate price competition and shorten supply chains. Mizoram secured INR 7.43 crore (USD 0.89 million) from the North Eastern Council in March 2025 for two arecanut processing units aimed at raising local price realization. Areca nut from Indonesia is in great demand, where 80% of the world’s needs are exported from Indonesia, and Jambi Province contributes 34.53% of the total national exports. Southeast Sulawesi logged its first export to Iran in January 2024, illustrating how localized infrastructure opens new destinations. In India, the Campco Limited’s lower pledge loan threshold from 1 metric ton to 0.2 metric ton aggregates smaller lots, enabling cooperatives to compete with private traders.
Protective Tariff and Subsidy Programs in Major Producer Countries
Protective tariff and subsidy programs buffer farm income by setting price floors that insulate growers from cheaper imports while enabling governments to calibrate supply stability. India’s October 2025 decision by India’s Directorate General of Foreign Trade (DGFT) to apply a Minimum Import Price of INR 351 per kilogram (USD 4.21 per kilogram) and maintain a 100% basic customs duty instantly narrowed the price gap between domestic white “Chali” nuts and Bhutanese red varieties. Thailand’s export collapse after India’s tariff wall illustrates the cross-border ripple effect. Bangkok has intensified discussions within the Bay of Bengal Initiative for Multi-Sectoral Technical and Economic Cooperation (BIMSTEC) framework to secure duty relief, emphasizing how protectionist policies in a significant market can influence regional diplomacy and supply chain dynamics. Sri Lanka’s 35% value-addition mandate for re-exports forces local processors to invest in slicing and boiling lines, elevating domestic employment but compressing trader margins as capital costs rise.
Blockchain-enabled traceability pilots among Indian cooperatives
The United Nations Development Programme India Accelerator Lab piloted a blockchain ledger for chili and turmeric that tracked many farmers in Andhra Pradesh, areca cooperatives view the model as a template for residue-certified exports. A traceable areca supply chain would meet European Union Directorate-General for Health and Food Safety audit protocols and accelerate customs clearance. Cooperatives adopting Tracenet, India’s official organic database, can pool 25 to 500 growers under group certification, cutting compliance costs. Wider rollout could unlock high-margin markets and differentiate Indian shipments from lower-priced regional competitors.
Restraints Impact Analysis*
| Restraint | (~) % Impact on CAGR Forecast | Geographic Relevance | Impact Timeline |
|---|---|---|---|
| Intensifying health-warning regulations and partial sales bans | −0.7% | Europe, North America, Australia, United Arab Emirates, India, Taiwan | Short term (≤ 2 years) |
| Climate-linked disease outbreaks such as Yellow Leaf Disease and Areolate Mildew | −0.6% | India (Karnataka, Kerala, Tamil Nadu, Assam), Indonesia (Sumatra), Sri Lanka | Medium term (2 to 4 years) |
| Zero-duty Duty Free Quota Free imports eroding farm-gate prices in India | −0.5% | India producer states, source countries Bhutan, Myanmar, Bangladesh | Short term (≤ 2 years) |
| Environmental, Social, and Governance driven investor pressure given carcinogen status | −0.3% | Europe and North America institutional portfolios, export-oriented Asia-Pacific processors | Long term (≥ 4 years) |
| Source: Mordor Intelligence | |||
Intensifying Health-Warning Regulations and Partial Sales Bans
The International Agency for Research on Cancer Group 1 classification accelerates placement of pictorial warnings on packs and fuels outright bans on chewing mixes in high-income economies. The United Arab Emirates prohibits betel leaf and areca nut imports, forcing traders to reroute product through informal channels into nearby Gulf Cooperation Council markets. European Union audit protocols demand laboratory verification of absence of specific alkaloids, raising compliance expenses for exporters and excluding smallholders without testing access. Taiwan’s campaigns lowered youth prevalence but left older male chewing rates above 15% in 2025, illustrating limited effectiveness without strict enforcement.
Climate-Linked Disease Outbreaks such as Yellow Leaf Disease and Areolate Mildew
Yellow Leaf Disease incidence reached above 86% in Karnataka’s core belts during 2024, with no resistant commercial varieties available. Areolate Mildew outbreaks in Kerala and Tamil Nadu force additional fungicide sprays that elevate residue levels and risk export rejection. Central Plantation Crops Research Institute initiated a USD 1.19 million research project in March 2025 to develop integrated pest management, but adoption lags among smallholders who lack extension services. Weather variability linked to El Niño patterns increases both leafhopper and fungal pressures, making disease management costs a growing burden.
*Our forecasts treat driver/restraint impacts as directional, not additive. The impact forecasts reflect baseline growth, mix effects, and variable interactions.
Geography Analysis
Asia-Pacific generated roughly 88% of the 2025 market value, rooted in India’s twin leadership in production and imports within the areca nut market. Karnataka harvested 1 million metric tons in 2024 across 0.68 million hectares, but Yellow Leaf Disease threatens up to 96% of palms in certain belts, compelling urgent research funding. Indonesia rides productivity gains from Jambi’s Betara variety at 7.81 metric tons per hectare per year, underpinning its 38.4% export share. Nepal’s production through 2031 rebalances regional supply as Terai smallholders convert marginal land and secure Indian market access.
Africa represents the fastest-growing region at 6.1% CAGR through 2031. Demand concentrates in Tanzania and South Africa, where East African and South Asian diaspora communities purchase chewing nuts through niche ethnic retail chains[2]Source: Food and Agriculture Organization Statistics Division, “Areca Nuts Production and Trade Statistics,” , faostat.org. Middle East consumption advances with Saudi Arabia and the United Arab Emirates posting massive 2023 import spikes despite the United Arab Emirates regulatory ban that shifts formal to informal flows. Pakistan’s processors leverage this demand by forwarding sliced, flavored nuts under organic certification, capturing premium price points.
North America and Europe expand modestly, largely confined to ethnic food importers who manage strict European Union Directorate-General for Health and Food Safety traceability requirements. South America and Russia show nascent expansion, serving Central Asian or South Asian migrant clusters. Thailand’s export slump illustrates the policy sensitivity of regional trade, pressing Bangkok to negotiate relief under Asian free-trade agreements. Vietnam’s border congestion exemplifies geopolitical risk to single-buyer strategies and highlights the need for diversified destinations.


Competitive Landscape
Competitive intensity is fragmented with top five processors holding significant share of 2025 value in the areca nut market. The Campco Limited, a Karnataka cooperative with 120,000 members, generated significant revenue and captures increase share of India’s organized trade. GM Group, Viet Delta Industrial Company, PT Ruby Privatindo, and Swastika International round out the top tier, though new digital procurement platforms now let growers bypass intermediaries and fetch better prices.
Strategic moves are accelerating. The Campco Limited announced an organic manure factory on 18 acres in September 2025 to convert areca husk into bio-fertilizer and lock in farmer loyalty while lowering chemical residues that trigger European Union rejections[3]Source: ICRA Limited, “The Campco Limited Credit Rating Report,” icra.in. Pakistan’s processors are scaling organic certified slicing for Gulf Cooperation Council markets, supported by consistent supply from Afghanistan and Central Asia. Indonesia’s Southeast Sulawesi exporters initiated shipping to Iran in January 2024, demonstrating how localized infrastructure can unlock non-traditional destinations.
Technology adoption is emerging as a competitive differentiator. The United Nations Development Programme blockchain pilot in Andhra Pradesh offers a proof-of-concept for immutable traceability that can satisfy premium buyers. Indian cooperatives testing Tracenet group certification can lower costs across 25 to 500 growers, easing entry into the organic segment. Overall, companies that integrate vertically, secure certified supply chains, and pivot toward value-added extracts stand to widen margins despite tightening regulatory headwinds.
Recent Industry Developments
- January 2026: Mizoram Chief Minister Lalduhoma inaugurated a high-capacity areca nut (kuhva) processing unit established by SSB Agro in Buhchangphai village, Kolasib district. The facility is designed to support the state's 30,000 hectares of areca nut cultivation, which produced 20,000 metric tons in 2024–25, aided by government schemes.
- May 2024: An analysis by the Areca Research Centre at Keladi Shivappa Nayaka University of Agricultural and Horticultural Sciences in Shivamogga identified the Tirthahalli areca variety as the highest quality among those cultivated in India. The region's climate plays a pivotal role in producing this superior-quality areca nut.
- May 2024: Mangaluru Areca Products Pvt. Ltd. introduced a new range of processed areca nuts. These products incorporate improved curing techniques and precise grading methods, aimed at enhancing quality and increasing export opportunities.


Global Areca Nuts Market Report Scope
The Areca Nuts Market is Segmented by Geography (North America, Europe, Asia-Pacific, South America, and More). The Report Includes Production Analysis (Volume), Consumption Analysis (Value and Volume), Import Analysis (Value and Volume), Export Analysis (Value and Volume), Wholesale Price Trend Analysis and Forecast, List of Key Players, Regulatory Framework, Logistics and Infrastructure, and Seasonality Analysis. The Market Forecasts are Provided in Terms of Value (USD) and Volume (Metric Tons).
| North America | United States | Production Analysis (Area Harvested, Yield, and Production Volume) |
| Consumption Analysis (Consumption Value and Volume) | ||
| Import Market Analysis (Import Value, Volume, and Key Supplying Markets) | ||
| Export Market Analysis (Export Value, Volume, and Key Destination Markets) | ||
| Wholesale Price Trend Analysis and Forecast | ||
| Regulatory Framework | ||
| List of Key Players | ||
| Logistics and Infrastructure | ||
| Seasonality Analysis | ||
| Canada | Production Analysis (Area Harvested, Yield, and Production Volume) | |
| Consumption Analysis (Consumption Value and Volume) | ||
| Import Market Analysis (Import Value, Volume, and Key Supplying Markets) | ||
| Export Market Analysis (Export Value, Volume, and Key Destination Markets) | ||
| Wholesale Price Trend Analysis and Forecast | ||
| Regulatory Framework | ||
| List of Key Players | ||
| Logistics and Infrastructure | ||
| Seasonality Analysis | ||
| Mexico | Production Analysis (Area Harvested, Yield, and Production Volume) | |
| Consumption Analysis (Consumption Value and Volume) | ||
| Import Market Analysis (Import Value, Volume, and Key Supplying Markets) | ||
| Export Market Analysis (Export Value, Volume, and Key Destination Markets) | ||
| Wholesale Price Trend Analysis and Forecast | ||
| Regulatory Framework | ||
| List of Key Players | ||
| Logistics and Infrastructure | ||
| Seasonality Analysis | ||
| Europe | United Kingdom | Production Analysis (Area Harvested, Yield, and Production Volume) |
| Consumption Analysis (Consumption Value and Volume) | ||
| Import Market Analysis (Import Value, Volume, and Key Supplying Markets) | ||
| Export Market Analysis (Export Value, Volume, and Key Destination Markets) | ||
| Wholesale Price Trend Analysis and Forecast | ||
| Regulatory Framework | ||
| List of Key Players | ||
| Logistics and Infrastructure | ||
| Seasonality Analysis | ||
| Germany | Production Analysis (Area Harvested, Yield, and Production Volume) | |
| Consumption Analysis (Consumption Value and Volume) | ||
| Import Market Analysis (Import Value, Volume, and Key Supplying Markets) | ||
| Export Market Analysis (Export Value, Volume, and Key Destination Markets) | ||
| Wholesale Price Trend Analysis and Forecast | ||
| Regulatory Framework | ||
| List of Key Players | ||
| Logistics and Infrastructure | ||
| Seasonality Analysis | ||
| Spain | Production Analysis (Area Harvested, Yield, and Production Volume) | |
| Consumption Analysis (Consumption Value and Volume) | ||
| Import Market Analysis (Import Value, Volume, and Key Supplying Markets) | ||
| Export Market Analysis (Export Value, Volume, and Key Destination Markets) | ||
| Wholesale Price Trend Analysis and Forecast | ||
| Regulatory Framework | ||
| List of Key Players | ||
| Logistics and Infrastructure | ||
| Seasonality Analysis | ||
| Italy | Production Analysis (Area Harvested, Yield, and Production Volume) | |
| Consumption Analysis (Consumption Value and Volume) | ||
| Import Market Analysis (Import Value, Volume, and Key Supplying Markets) | ||
| Export Market Analysis (Export Value, Volume, and Key Destination Markets) | ||
| Wholesale Price Trend Analysis and Forecast | ||
| Regulatory Framework | ||
| List of Key Players | ||
| Logistics and Infrastructure | ||
| Seasonality Analysis | ||
| Asia-Pacific | China | Production Analysis (Area Harvested, Yield, and Production Volume) |
| Consumption Analysis (Consumption Value and Volume) | ||
| Import Market Analysis (Import Value, Volume, and Key Supplying Markets) | ||
| Export Market Analysis (Export Value, Volume, and Key Destination Markets) | ||
| Wholesale Price Trend Analysis and Forecast | ||
| Regulatory Framework | ||
| List of Key Players | ||
| Logistics and Infrastructure | ||
| Seasonality Analysis | ||
| India | Production Analysis (Area Harvested, Yield, and Production Volume) | |
| Consumption Analysis (Consumption Value and Volume) | ||
| Import Market Analysis (Import Value, Volume, and Key Supplying Markets) | ||
| Export Market Analysis (Export Value, Volume, and Key Destination Markets) | ||
| Wholesale Price Trend Analysis and Forecast | ||
| Regulatory Framework | ||
| List of Key Players | ||
| Logistics and Infrastructure | ||
| Seasonality Analysis | ||
| Indonesia | Production Analysis (Area Harvested, Yield, and Production Volume) | |
| Consumption Analysis (Consumption Value and Volume) | ||
| Import Market Analysis (Import Value, Volume, and Key Supplying Markets) | ||
| Export Market Analysis (Export Value, Volume, and Key Destination Markets) | ||
| Wholesale Price Trend Analysis and Forecast | ||
| Regulatory Framework | ||
| List of Key Players | ||
| Logistics and Infrastructure | ||
| Seasonality Analysis | ||
| Myanmar | Production Analysis (Area Harvested, Yield, and Production Volume) | |
| Consumption Analysis (Consumption Value and Volume) | ||
| Import Market Analysis (Import Value, Volume, and Key Supplying Markets) | ||
| Export Market Analysis (Export Value, Volume, and Key Destination Markets) | ||
| Wholesale Price Trend Analysis and Forecast | ||
| Regulatory Framework | ||
| List of Key Players | ||
| Logistics and Infrastructure | ||
| Seasonality Analysis | ||
| South America | Brazil | Production Analysis (Area Harvested, Yield, and Production Volume) |
| Consumption Analysis (Consumption Value and Volume) | ||
| Import Market Analysis (Import Value, Volume, and Key Supplying Markets) | ||
| Export Market Analysis (Export Value, Volume, and Key Destination Markets) | ||
| Wholesale Price Trend Analysis and Forecast | ||
| Regulatory Framework | ||
| List of Key Players | ||
| Logistics and Infrastructure | ||
| Seasonality Analysis | ||
| Chile | Production Analysis (Area Harvested, Yield, and Production Volume) | |
| Consumption Analysis (Consumption Value and Volume) | ||
| Import Market Analysis (Import Value, Volume, and Key Supplying Markets) | ||
| Export Market Analysis (Export Value, Volume, and Key Destination Markets) | ||
| Wholesale Price Trend Analysis and Forecast | ||
| Regulatory Framework | ||
| List of Key Players | ||
| Logistics and Infrastructure | ||
| Seasonality Analysis | ||
| Middle East | United Arab Emirates | Production Analysis (Area Harvested, Yield, and Production Volume) |
| Consumption Analysis (Consumption Value and Volume) | ||
| Import Market Analysis (Import Value, Volume, and Key Supplying Markets) | ||
| Export Market Analysis (Export Value, Volume, and Key Destination Markets) | ||
| Wholesale Price Trend Analysis and Forecast | ||
| Regulatory Framework | ||
| List of Key Players | ||
| Logistics and Infrastructure | ||
| Seasonality Analysis | ||
| Saudi Arabia | Production Analysis (Area Harvested, Yield, and Production Volume) | |
| Consumption Analysis (Consumption Value and Volume) | ||
| Import Market Analysis (Import Value, Volume, and Key Supplying Markets) | ||
| Export Market Analysis (Export Value, Volume, and Key Destination Markets) | ||
| Wholesale Price Trend Analysis and Forecast | ||
| Regulatory Framework | ||
| List of Key Players | ||
| Logistics and Infrastructure | ||
| Seasonality Analysis | ||
| Africa | South Africa | Production Analysis (Area Harvested, Yield, and Production Volume) |
| Consumption Analysis (Consumption Value and Volume) | ||
| Import Market Analysis (Import Value, Volume, and Key Supplying Markets) | ||
| Export Market Analysis (Export Value, Volume, and Key Destination Markets) | ||
| Wholesale Price Trend Analysis and Forecast | ||
| Regulatory Framework | ||
| List of Key Players | ||
| Logistics and Infrastructure | ||
| Seasonality Analysis | ||
| By Geography | North America | United States | Production Analysis (Area Harvested, Yield, and Production Volume) |
| Consumption Analysis (Consumption Value and Volume) | |||
| Import Market Analysis (Import Value, Volume, and Key Supplying Markets) | |||
| Export Market Analysis (Export Value, Volume, and Key Destination Markets) | |||
| Wholesale Price Trend Analysis and Forecast | |||
| Regulatory Framework | |||
| List of Key Players | |||
| Logistics and Infrastructure | |||
| Seasonality Analysis | |||
| Canada | Production Analysis (Area Harvested, Yield, and Production Volume) | ||
| Consumption Analysis (Consumption Value and Volume) | |||
| Import Market Analysis (Import Value, Volume, and Key Supplying Markets) | |||
| Export Market Analysis (Export Value, Volume, and Key Destination Markets) | |||
| Wholesale Price Trend Analysis and Forecast | |||
| Regulatory Framework | |||
| List of Key Players | |||
| Logistics and Infrastructure | |||
| Seasonality Analysis | |||
| Mexico | Production Analysis (Area Harvested, Yield, and Production Volume) | ||
| Consumption Analysis (Consumption Value and Volume) | |||
| Import Market Analysis (Import Value, Volume, and Key Supplying Markets) | |||
| Export Market Analysis (Export Value, Volume, and Key Destination Markets) | |||
| Wholesale Price Trend Analysis and Forecast | |||
| Regulatory Framework | |||
| List of Key Players | |||
| Logistics and Infrastructure | |||
| Seasonality Analysis | |||
| Europe | United Kingdom | Production Analysis (Area Harvested, Yield, and Production Volume) | |
| Consumption Analysis (Consumption Value and Volume) | |||
| Import Market Analysis (Import Value, Volume, and Key Supplying Markets) | |||
| Export Market Analysis (Export Value, Volume, and Key Destination Markets) | |||
| Wholesale Price Trend Analysis and Forecast | |||
| Regulatory Framework | |||
| List of Key Players | |||
| Logistics and Infrastructure | |||
| Seasonality Analysis | |||
| Germany | Production Analysis (Area Harvested, Yield, and Production Volume) | ||
| Consumption Analysis (Consumption Value and Volume) | |||
| Import Market Analysis (Import Value, Volume, and Key Supplying Markets) | |||
| Export Market Analysis (Export Value, Volume, and Key Destination Markets) | |||
| Wholesale Price Trend Analysis and Forecast | |||
| Regulatory Framework | |||
| List of Key Players | |||
| Logistics and Infrastructure | |||
| Seasonality Analysis | |||
| Spain | Production Analysis (Area Harvested, Yield, and Production Volume) | ||
| Consumption Analysis (Consumption Value and Volume) | |||
| Import Market Analysis (Import Value, Volume, and Key Supplying Markets) | |||
| Export Market Analysis (Export Value, Volume, and Key Destination Markets) | |||
| Wholesale Price Trend Analysis and Forecast | |||
| Regulatory Framework | |||
| List of Key Players | |||
| Logistics and Infrastructure | |||
| Seasonality Analysis | |||
| Italy | Production Analysis (Area Harvested, Yield, and Production Volume) | ||
| Consumption Analysis (Consumption Value and Volume) | |||
| Import Market Analysis (Import Value, Volume, and Key Supplying Markets) | |||
| Export Market Analysis (Export Value, Volume, and Key Destination Markets) | |||
| Wholesale Price Trend Analysis and Forecast | |||
| Regulatory Framework | |||
| List of Key Players | |||
| Logistics and Infrastructure | |||
| Seasonality Analysis | |||
| Asia-Pacific | China | Production Analysis (Area Harvested, Yield, and Production Volume) | |
| Consumption Analysis (Consumption Value and Volume) | |||
| Import Market Analysis (Import Value, Volume, and Key Supplying Markets) | |||
| Export Market Analysis (Export Value, Volume, and Key Destination Markets) | |||
| Wholesale Price Trend Analysis and Forecast | |||
| Regulatory Framework | |||
| List of Key Players | |||
| Logistics and Infrastructure | |||
| Seasonality Analysis | |||
| India | Production Analysis (Area Harvested, Yield, and Production Volume) | ||
| Consumption Analysis (Consumption Value and Volume) | |||
| Import Market Analysis (Import Value, Volume, and Key Supplying Markets) | |||
| Export Market Analysis (Export Value, Volume, and Key Destination Markets) | |||
| Wholesale Price Trend Analysis and Forecast | |||
| Regulatory Framework | |||
| List of Key Players | |||
| Logistics and Infrastructure | |||
| Seasonality Analysis | |||
| Indonesia | Production Analysis (Area Harvested, Yield, and Production Volume) | ||
| Consumption Analysis (Consumption Value and Volume) | |||
| Import Market Analysis (Import Value, Volume, and Key Supplying Markets) | |||
| Export Market Analysis (Export Value, Volume, and Key Destination Markets) | |||
| Wholesale Price Trend Analysis and Forecast | |||
| Regulatory Framework | |||
| List of Key Players | |||
| Logistics and Infrastructure | |||
| Seasonality Analysis | |||
| Myanmar | Production Analysis (Area Harvested, Yield, and Production Volume) | ||
| Consumption Analysis (Consumption Value and Volume) | |||
| Import Market Analysis (Import Value, Volume, and Key Supplying Markets) | |||
| Export Market Analysis (Export Value, Volume, and Key Destination Markets) | |||
| Wholesale Price Trend Analysis and Forecast | |||
| Regulatory Framework | |||
| List of Key Players | |||
| Logistics and Infrastructure | |||
| Seasonality Analysis | |||
| South America | Brazil | Production Analysis (Area Harvested, Yield, and Production Volume) | |
| Consumption Analysis (Consumption Value and Volume) | |||
| Import Market Analysis (Import Value, Volume, and Key Supplying Markets) | |||
| Export Market Analysis (Export Value, Volume, and Key Destination Markets) | |||
| Wholesale Price Trend Analysis and Forecast | |||
| Regulatory Framework | |||
| List of Key Players | |||
| Logistics and Infrastructure | |||
| Seasonality Analysis | |||
| Chile | Production Analysis (Area Harvested, Yield, and Production Volume) | ||
| Consumption Analysis (Consumption Value and Volume) | |||
| Import Market Analysis (Import Value, Volume, and Key Supplying Markets) | |||
| Export Market Analysis (Export Value, Volume, and Key Destination Markets) | |||
| Wholesale Price Trend Analysis and Forecast | |||
| Regulatory Framework | |||
| List of Key Players | |||
| Logistics and Infrastructure | |||
| Seasonality Analysis | |||
| Middle East | United Arab Emirates | Production Analysis (Area Harvested, Yield, and Production Volume) | |
| Consumption Analysis (Consumption Value and Volume) | |||
| Import Market Analysis (Import Value, Volume, and Key Supplying Markets) | |||
| Export Market Analysis (Export Value, Volume, and Key Destination Markets) | |||
| Wholesale Price Trend Analysis and Forecast | |||
| Regulatory Framework | |||
| List of Key Players | |||
| Logistics and Infrastructure | |||
| Seasonality Analysis | |||
| Saudi Arabia | Production Analysis (Area Harvested, Yield, and Production Volume) | ||
| Consumption Analysis (Consumption Value and Volume) | |||
| Import Market Analysis (Import Value, Volume, and Key Supplying Markets) | |||
| Export Market Analysis (Export Value, Volume, and Key Destination Markets) | |||
| Wholesale Price Trend Analysis and Forecast | |||
| Regulatory Framework | |||
| List of Key Players | |||
| Logistics and Infrastructure | |||
| Seasonality Analysis | |||
| Africa | South Africa | Production Analysis (Area Harvested, Yield, and Production Volume) | |
| Consumption Analysis (Consumption Value and Volume) | |||
| Import Market Analysis (Import Value, Volume, and Key Supplying Markets) | |||
| Export Market Analysis (Export Value, Volume, and Key Destination Markets) | |||
| Wholesale Price Trend Analysis and Forecast | |||
| Regulatory Framework | |||
| List of Key Players | |||
| Logistics and Infrastructure | |||
| Seasonality Analysis | |||


Key Questions Answered in the Report
How big is the Areca Nuts Market?
The Areca Nuts Market size is anticipated to reach USD 1.25 billion in 2026 and grow at a CAGR of 4.66% to reach USD 1.57 billion by 2031.
Why does India import large volumes despite being the top producer?
Importers seek Bhutanese and Myanmar nuts for specialized chewing mixes, creating quality-driven demand even after protective tariffs.
Which is the fastest growing region in Areca Nuts Market?
Africa is estimated to grow at the fastest CAGR with 6.1% over the forecast period (2026-2031).
What premium opportunities exist beyond chewing products?
Certified organic nuts command 20% price premiums in the Gulf Cooperation Council, and tannin extraction for leather and cosmetics offers high-margin diversification.
Page last updated on:


