Market Overview
| Study Period | 2021 - 2031 |
|---|---|
| Forecast Data Period | 2026 - 2031 |
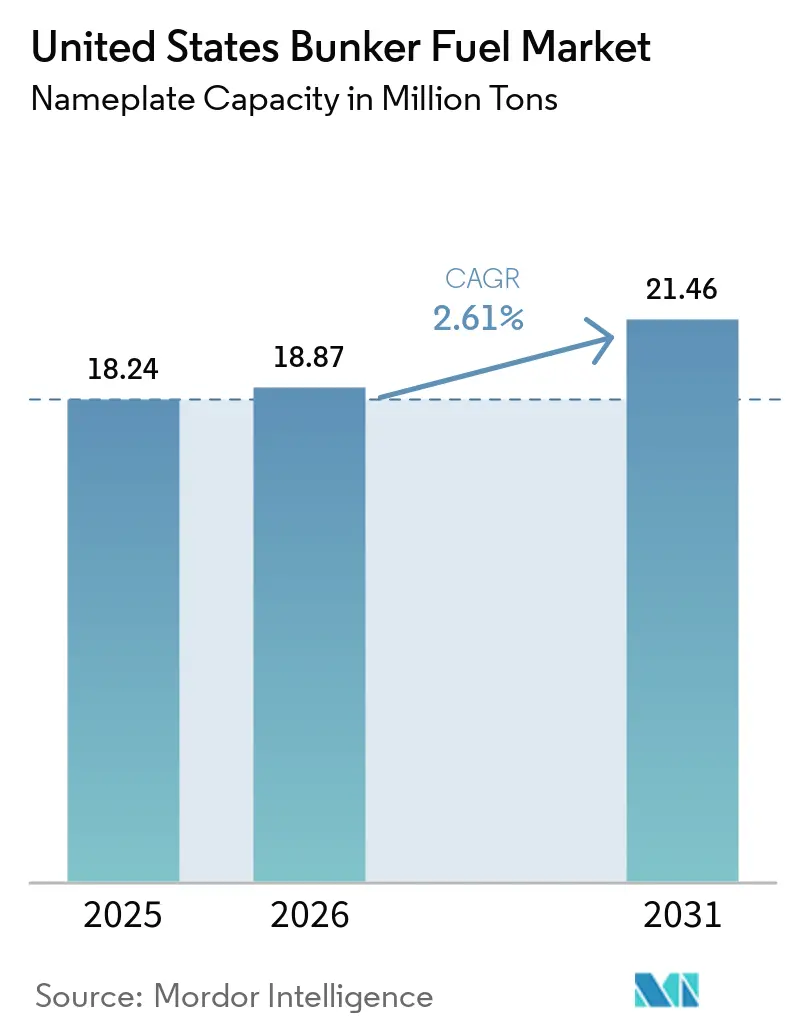
| Base Year Market Size (2025) | 18.24 Million tons |
| Market Volume (2026) | 18.87 Million tons |
| Market Volume (2031) | 21.46 Million tons |
| Growth Rate (2026 - 2031) | 2.61% CAGR |
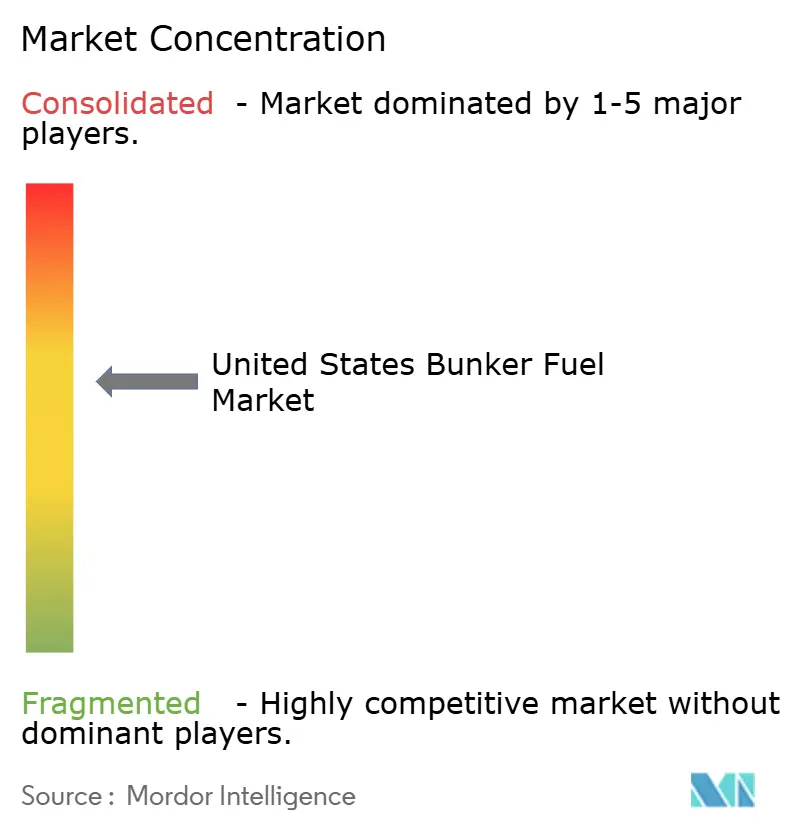
| Market Concentration | Medium |
Major Players *Disclaimer: Major Players sorted in no particular order Image © Mordor Intelligence. Reuse requires attribution under CC BY 4.0. | |
United States Bunker Fuel Market Analysis by Mordor Intelligence
The United States Bunker Fuel Market size in terms of nameplate capacity was valued at 18.24 million tons in 2025 and is estimated to grow from 18.87 million tons in 2026 to reach 21.46 million tons by 2031, at a CAGR of 2.61% during the forecast period (2026-2031). Every major regulatory stream, IMO sulfur limits, state carbon programs, and new federal tax credits now converge to nudge operators away from legacy fuels and toward alternatives that promise lower life-cycle emissions and more predictable compliance costs. Very-low-sulfur fuel oil (VLSFO) remains the primary compliance choice, yet expanding liquefied natural gas (LNG) infrastructure at Houston, Los Angeles, and Jacksonville is beginning to reset demand expectations in favor of gas-based options. Ship-to-ship lightering, still dominant in the Gulf of Mexico, continues to underpin 45% of national bunkering volumes, but purpose-built articulated tug-barges are shortening transfer windows and lowering delivered LNG costs in multiple coastal corridors. Simultaneously, California’s Low Carbon Fuel Standard (LCFS), combined with Inflation Reduction Act incentives for green hydrogen and captured carbon, is bringing USD 2 billion of green-methanol capacity to the Gulf Coast, creating a future supply hub for zero-carbon bunkers.
Key Report Takeaways
- By fuel type, VLSFO led with 40.63% of the United States bunker fuel market share in 2025, while LNG is projected to expand at a 9.1% CAGR through 2031.
- By bunkering method, ship-to-ship transfers accounted for 45.11% of the United States bunker fuel market size in 2025, and LNG barge-to-ship operations are forecast to grow at an 8.6% CAGR between 2026 and 2031.
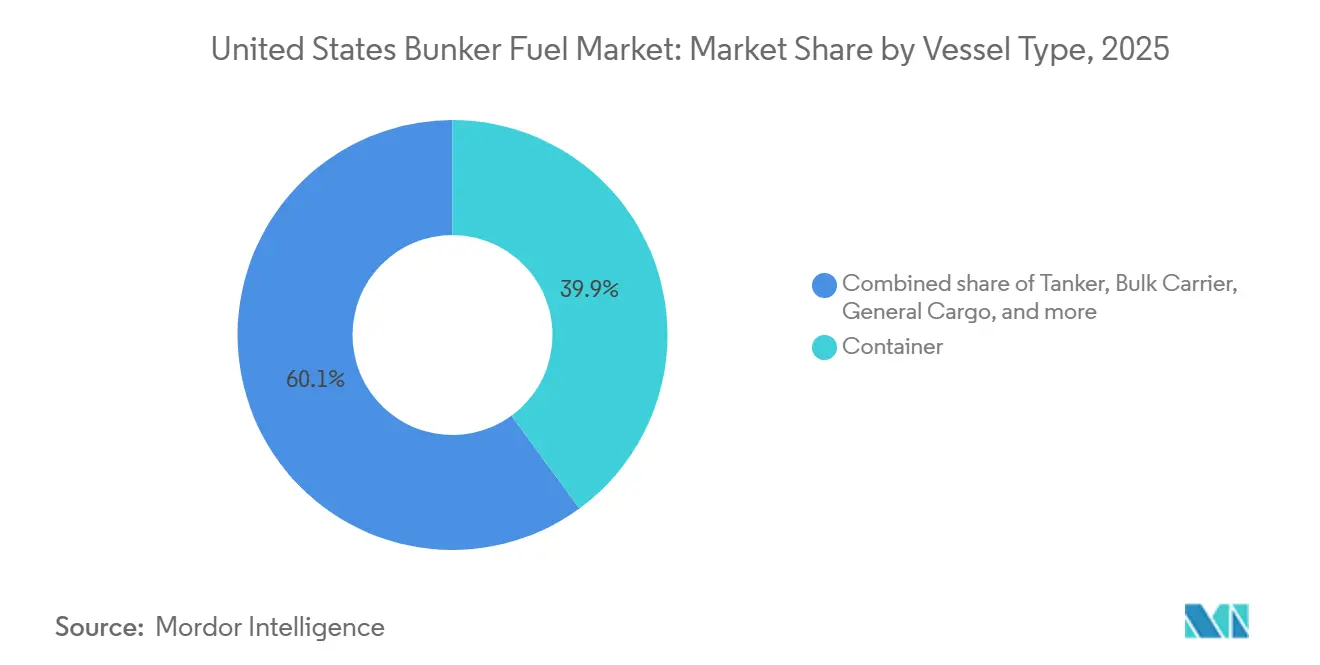
- By vessel type, container vessels captured 39.94% of the United States bunker fuel market size in 2025, whereas bulk carriers are expected to post a 3.7% CAGR through 2031.
Note: Market size and forecast figures in this report are generated using Mordor Intelligence’s proprietary estimation framework, updated with the latest available data and insights as of January 2026.
United States Bunker Fuel Market Trends and Insights
Drivers Impact Analysis*
| Driver | (~) % Impact on CAGR Forecast | Geographic Relevance | Impact Timeline |
|---|---|---|---|
| IMO 2020 sulfur-cap compliance surge | 0.5% | National, with concentration in Gulf Coast and West Coast ports | Short term (≤ 2 years) |
| Expansion of U.S. LNG bunkering infrastructure | 0.8% | Gulf Coast (Houston, Corpus Christi), West Coast (Los Angeles, Long Beach), Southeast (Jacksonville) | Medium term (2-4 years) |
| Growing U.S. tanker & container traffic | 0.4% | National, led by Los Angeles-Long Beach complex and Houston Ship Channel | Medium term (2-4 years) |
| Cruise-line demand for low-sulfur fuels | 0.2% | Southeast (Miami, Port Canaveral, Galveston) and Alaska seasonal routes | Short term (≤ 2 years) |
| Renewable bio-blend bunkers driven by California LCFS | 0.3% | California ports (Los Angeles, Long Beach, Oakland, San Diego) | Medium term (2-4 years) |
| IRA tax credits catalyzing green-methanol supply | 0.6% | Gulf Coast production hubs with spillover to East Coast distribution | Long term (≥ 4 years) |
| Source: Mordor Intelligence | |||
IMO 2020 sulfur-cap compliance surge
Refinery configuration gaps on the East Coast forced supply realignment toward Gulf plants that possess residue-upgrading hardware, creating longer lead times for spot purchases.[1]U.S. Energy Information Administration, “Short-Term Energy Outlook,” eia.gov The narrowing HSFO–VLSFO spread, now near USD 50 per metric ton, has erased the investment case for new scrubber retrofits, locking more operators into compliant fuels. Scrubber-equipped vessels already on the water continue to consume HSFO, but stricter wash-water restrictions in California and Connecticut are curbing open-loop systems and reducing geographic flexibility. Detentions for sulfur violations rose 18% in 2025 as U.S. Coast Guard inspectors intensified sampling at major container and tanker gateways.[2]U.S. Coast Guard, “Port-State Control Annual Report 2025,” uscg.mil Collectively, these factors stabilize the compliance premium that underpins VLSFO demand inside the United States bunker fuel market.
Expansion of U.S. LNG Bunkering Infrastructure
Federal and state grants exceeding USD 65 million have catalyzed groundbreaking for shore-based LNG facilities at Los Angeles and Jacksonville, supporting dual-fuel container and cruise tonnage arriving from 2026 onward. Houston Ship Channel suppliers exploit existing liquefaction terminals for offshore ship-to-ship transfers, shaving 15% from delivered LNG costs relative to barge deliveries. The first 12,000-cubic-meter Jones Act-compliant LNG bunker barge entered service at Jacksonville in March 2025 and cut fueling time by 40%, setting a new benchmark for coastal efficiency. Methane-slip concerns prompted the Environmental Protection Agency to propose on-engine monitoring that could add USD 0.5 million to newbuilds, but OEMs are rolling out closed-loop combustion systems that claim 70% slip reduction. Early LNG adoption by Carnival Corporation and Royal Caribbean for twelve forthcoming cruise ships secures a demand anchor that de-risks additional infrastructure commitments.
Growing U.S. Tanker and Container Traffic
Los Angeles–Long Beach throughput climbed to 18.2 million TEUs in 2025, a 6.3% rebound tied to near-shoring of finished-goods assembly in Mexico. Larger ultra-large container vessels (ULCVs) improve per-box efficiency yet still raise absolute bunker volumes when measured against total cargo moved, preserving upside for the United States bunker fuel market. Diesel and gasoline exports out of Corpus Christi and Port Arthur rose 9% over 2024 levels, pushing product tanker demand for VLSFO and, increasingly, LNG. Reconfigured Neopanamax canal transits now channel more Asian cargo directly into the Gulf, redistributing fuel demand away from the West Coast and tightening inventories around Houston. Jones Act cabotage movements, supported by 1.8 million metric tons of annual VLSFO demand, provide a baseline that moderates volatility during global trade shocks.
Renewable Bio-Blend Bunkers Driven by California LCFS
Average LCFS credits of USD 105 per ton CO₂ boosted bio-blend cost competitiveness by USD 30–40 per metric ton at Los Angeles and Long Beach in 2025.[3]California Air Resources Board, “Low Carbon Fuel Standard Credit Report 2025,” arb.ca.gov World Fuel Services and Neste began routine HVO deliveries at San Diego, targeting liners eager to cut Scope 3 emissions for retail shippers. Chevron’s El Segundo refinery now co-processes soybean oil and tallow, producing drop-in bunkers that conform to ASTM D975 and earn both LCFS and federal RIN credits. Feedstock shortfalls - because California meets only 15% of its own renewable diesel demand - compel imports of used cooking oil from the Midwest, widening logistics spreads, and exposing price risk to rail bottlenecks. Proposed LCFS eligibility for international voyages could triple the addressable market and catalyze fresh supplier entry.
Restraints Impact Analysis*
| Restraint | (~) % Impact on CAGR Forecast | Geographic Relevance | Impact Timeline |
|---|---|---|---|
| High capital cost of LNG bunkering assets | -0.4% | National, with acute pressure on mid-sized ports (Savannah, Charleston, Mobile) | Medium term (2-4 years) |
| Crude-price volatility impacting fuel economics | -0.3% | National, with heightened exposure in Gulf Coast refining centers | Short term (≤ 2 years) |
| Retrofit scrubbers reducing LS-fuel consumption | -0.2% | National, concentrated among tanker and bulk-carrier fleets | Short term (≤ 2 years) |
| Prospective carbon-levy shifting investment away | -0.3% | National, with strategic uncertainty affecting long-cycle infrastructure decisions | Long term (≥ 4 years) |
| Source: Mordor Intelligence | |||
High Capital Cost of LNG Bunkering Assets
Purpose-built LNG barges cost USD 40–60 million while shore installations exceed USD 80 million, capital levels that smaller ports struggle to underwrite without volume certainty. Only three Jones Act-compliant LNG barges were in service by early 2026, creating supply gaps on coastal trades and forcing truck-to-ship transfers that inflate delivered prices by up to 30%. Financing terms have tightened as lenders factor in ammonia and hydrogen disruption risk, pushing equity requirements above 40% and hurdle rates toward 15%. Houston deferred a USD 90 million LNG terminal in late 2025 over demand uncertainty, signaling continued caution among port authorities. Until more long-term offtake contracts materialize, LNG infrastructure growth outside core hubs will lag broader market needs.
Crude-Price Volatility Impacting Fuel Economics
Brent swings between USD 70 and 95 per barrel in 2025 have distorted hedging models and forced suppliers to shorten contract tenors from 18 to 9 months. The VLSFO–MGO spread widened to USD 120 per metric ton during Gulf Coast refinery outages, then collapsed to USD 60 by year-end, leaving traders with underwater stocks. LNG prices decoupled from oil, averaging USD 2.50 per MMBtu at Henry Hub, encouraging dual-fuel operators to switch away from distillate when spot oil spikes. Variable spreads pushed buyers toward monthly index-linked formulas that transfer risk downstream, curbing supplier margins in the United States bunker fuel market. Persistent volatility deters infrastructure investment that depends on stable throughput fees.
*Our forecasts treat driver/restraint impacts as directional, not additive. The impact forecasts reflect baseline growth, mix effects, and variable interactions.
Segment Analysis
By Fuel Type: LNG Ascends as VLSFO Plateaus
VLSFO accounted for 40.63% of the United States bunker fuel market size in 2025, anchoring compliance demand for the broader fleet. LNG is forecast to expand at 9.1% annually, supported by dual-fuel newbuild deliveries and three new bunker barges scheduled before 2028, giving operators a viable pathway to meet 2030 emissions targets. MGO and ULSFO retain niche roles among offshore support vessels where engine simplicity outweighs the cost premium. HSFO demand has stabilized around scrubber-equipped tankers and bulk carriers but faces geographic shrinkage as coastal discharge rules tighten. Methanol and ammonia remain pre-commercial yet have more than USD 3 billion in announced capacity along the Gulf Coast, signaling a potential reshuffling of the United States bunker fuel market landscape after 2028.
LNG’s energy-density disadvantage is partially offset by lower delivered costs linked to abundant domestic gas. VLSFO growth is slowing as owners weigh long-term carbon liability against short-term capital flexibility, a tension likely to define fleet-wide procurement through the forecast horizon. Green methanol gains credibility following Maersk’s 200,000-metric-ton offtake deal, which sets a pricing benchmark for additional contracts.[4]A.P. Møller-Mærsk, “Green Methanol Offtake Agreement Announcement,” maersk.com Bio-blends qualify for LCFS credits that subsidize a competitive delivered cost on the West Coast, yet feedstock scarcity caps immediate volume. The multi-fuel reality underscores the need for suppliers to maintain diversified fuel portfolios within the United States bunker fuel market.


By Bunkering Method: Offshore Transfers Dominate, Barges Gain
Ship-to-ship lightering represented 45.11% of national bunkering activity in 2025, led by deepwater zones off Houston and Delaware Bay that handle large crude and product tankers preparing for transatlantic voyages. Port-to-ship pipeline and truck deliveries remain essential for small-call volumes yet lack economies of scale for ever larger container ships that now average 1,400 cubic meters per fueling. LNG barge-to-ship is the fastest-growing method at 8.6% CAGR to 2031, driven by articulated tug-barges that reduce transfer times by a third, improving berth utilization at Los Angeles and Jacksonville. Portable ISO tanks cover remote Alaska and Great Lakes calls, but account for under 5% of volume due to handling complexity.
The U.S. Coast Guard’s 2025 safety update mandates dual-barrier containment and real-time vapor monitoring, raising barge construction costs but lowering incident risk. Shell has ordered a second 10,000-cubic-meter LNG barge for Los Angeles, underscoring confidence in barge-based growth. Pipeline spurs under construction at Long Beach will permit simultaneous cargo handling and bunkering, saving operators valuable port time. Offshore lightering volumes remain robust yet could taper if IMO carbon pricing penalizes high-sulfur fuel use on scrubber-equipped tankers. Consequently, suppliers diversify delivery modes to safeguard their share in the evolving United States bunker fuel market.
By Vessel Type: Containers Lead, Bulk Carriers Accelerate
Containers captured 39.94% of the United States bunker fuel market size in 2025 as Asia-U.S. West Coast trades relied on predictable weekly loops that enable tight fuel-procurement schedules. Tankers occupy second place thanks to shale-driven crude and product exports, maintaining steady demand at Gulf Coast terminals. Bulk carriers are poised for the fastest growth at 3.7% CAGR through 2031 as higher grain exports and coal recovery support Panamax and Kamsarmax deployments, many outfitted with dual-fuel engines. Cruise vessels remain niche in tonnage but high in per-call volume, particularly at Miami and Galveston, where LNG trials are scaling. Offshore support and specialized vessels stick to MGO due to operational simplicity, yet face efficiency erosion as battery-hybrid systems enter service.
ULCV deployment pushes individual call volumes above 2,500 cubic meters, encouraging on-site pipeline projects at West Coast ports. Jones Act tankers continue burning VLSFO, creating a demand floor insulated from global freight cycles. Bulk-carrier owners such as Star Bulk and Eagle Bulk have announced 18 dual-fuel newbuilds that lock in regional LNG demand through 2028. Passenger and ro-pax ferries along Alaska and Puerto Rico routes are adding shore power, trimming at-berth fuel use by 40% while preserving consumption underway. Collectively, vessel-type dynamics reinforce a multi-fuel equilibrium that defines the United States bunker fuel market.
Geography Analysis
The Gulf Coast dominates supply with roughly half of U.S. refining capacity and three LNG liquefaction plants that underpin flexible bunker options, generating about 9 million metric tons of annual demand in 2025. Houston’s offshore lightering handles 3.5 million metric tons of ship-to-ship transfers and is set to add methanol capacity backed by IRA credits that could reposition the corridor as a zero-carbon export hub by 2028. Corpus Christi and Port Arthur benefit from rising product exports to Latin America, supporting both VLSFO and emergent LNG demand among product tankers.
West Coast demand measured 5.2 million metric tons in 2025, anchored by trans-Pacific container loops that call weekly at Los Angeles-Long Beach. LCFS credits north of USD 100 per ton CO₂ create a subsidy that favors bio-blend supply chains, drawing World Fuel Services and Neste into joint deliveries at San Diego. Federal grants fund a new shore LNG facility that will open in 2027, cutting delivered gas prices and reinforcing the United States' bunker fuel market pivot toward lower-carbon choices on the Pacific coast.
East Coast consumption of around 4.1 million metric tons is fragmented among New York-New Jersey, Savannah, Charleston, and three cruise-heavy Florida ports. New York relies on truck and pipeline port-to-ship deliveries because deepwater anchorage is scarce, adding 10–15% to delivered cost. Savannah’s double-digit container growth strains current bunkering capacity, pushing the Georgia Ports Authority to study mobile LNG solutions, though implementation now slips beyond 2027. Jacksonville’s 12,000-cubic-meter LNG barge has already diverted feeder vessels away from Savannah by cutting refueling time by 40%, demonstrating how infrastructure advantages can quickly shift regional shares within the United States bunker fuel market.
Competitive Landscape
Integrated majors, ExxonMobil, Shell, Chevron, BP, and TotalEnergies, control roughly 55% of coastal infrastructure through refineries, blend terminals, and dedicated storage, anchoring supply security for high-volume buyers. Independent traders such as World Fuel Services, Peninsula Petroleum, Trafigura, and Glencore win share through flexible pricing and just-in-time delivery networks that bypass legacy storage constraints, a strategy that resonates with container lines and tramp owners seeking working-capital efficiency. Competition now hinges on alternative-fuel readiness; for example, Shell commissioned a second LNG barge at Los Angeles in January 2026, locking in dual-fuel container customers and cruise lines aiming for net-zero pledges.
TotalEnergies partnered with Neste in August 2025 to blend renewable marine fuels at Houston and Corpus Christi, creating a vertically integrated chain from feedstock to delivery that undercuts spot-market premiums. Mid-sized ports offer white-space opportunity because LNG and methanol infrastructure lags demand projections; Crowley Maritime and Seacor secured newbuild slots for two Jones Act LNG barges to fill this gap by 2028. Digital verification is another battleground as Maersk pilots blockchain fuel-quality tools that automate compliance reporting, potentially setting a new baseline for supplier transparency.
Technology race extends to engine makers; Wärtsilä and MAN are rolling out closed-loop systems that cut methane slip by up to 70%, a leap that could tilt LNG economics against methanol and ammonia pathways. Bio-fuel specialists Gevo and Infinium target drop-in markets where vessel owners resist propulsion retrofits, offering margins to suppliers willing to aggregate niche volumes. Overall, moderate concentration and rapid fuel diversification mean competitive positioning will increasingly rest on the breadth of multi-fuel portfolios within the United States bunker fuel market.
United States Bunker Fuel Industry Leaders
Exxon Mobil Corporation
Royal Dutch Shell PLC
Chevron Corporation
BP Plc
Chevron Corporation
- *Disclaimer: Major Players sorted in no particular order

Recent Industry Developments
- March 2026: The United States completed its first ship-to-ship methanol bunkering operation at Port Houston. This operation delivered approximately 2,000 metric tons of methanol to a dual-fuel container vessel, representing a key advancement in the development of alternative marine fuel infrastructure in the U.S. Gulf Coast region.
- July 2025: Loa Carbon, a climate tech firm based in New York, has inked a letter of intent (LOI) with Galveston LNG Bunker Port (GLBP) from Texas. Under this agreement, Loa Carbon will supply renewable e-methane to GLBP for the liquefaction process.
- July 2025: Captains of the Port (COTPs) have updated guidelines for bunkering vessels with liquefied natural gas (LNG) and other alternative marine fuels, thanks to a new policy letter, CG-OES Policy Letter No. 01-25, released by the U.S. Coast Guard Office of Operating and Environmental Standards (CG-OES).
- February 2025: The Department of Energy (DOE) has clarified in its Modified Order (Order 5233-A) that it will no longer classify ship-to-ship transfers of liquefied natural gas (LNG), when used as fuel for marine vessels, as an "export."


United States Bunker Fuel Market Report Scope
Bunker fuel, often referred to as bunker oil, is a heavy, low-grade fuel primarily used to power large ships and select aircraft. The term "bunker" harks back to early steamships, where storage areas for coal were termed bunkers. Derived as a residual product from crude oil refining, bunker fuel is typically thick and tar-like, known in the industry as Heavy Fuel Oil (HFO). This viscosity necessitates heating for pumping. Traditionally high in sulfur content, the industry is witnessing a shift towards cleaner and lighter marine fuels.
The United States bunker fuel market is segmented by fuel type, bunkering method, and vessel type. By fuel type, the market is segmented into high-sulfur fuel oil (HSFO), very-low-sulfur fuel oil (VLSFO), ultra-low-sulfur fuel oil (ULSFO), marine gas oil (MGO), liquefied natural gas (LNG), methanol, bio-/synthetic fuels, ammonia, and other fuel types. By bunkering method, the market is segmented into ship-to-ship, port-to-ship, LNG barge-to-ship, and portable tanks and containers. By vessel type, the market is segmented into container vessels, tankers, bulk carriers, general cargo vessels, passenger/Ro-Pax vessels, and offshore and specialized vessels. For each segment, the market sizing and forecasts are provided on the basis of volume (million tons).
By Fuel Type
| High-Sulfur Fuel Oil (HSFO) |
| Very-Low-Sulfur Fuel Oil (VLSFO) |
| Ultra-Low-Sulfur Fuel Oil (ULSFO) |
| Marine Gas Oil (MGO) |
| Liquefied Natural Gas (LNG) |
| Methanol |
| Bio-/Synthetic Fuels |
| Ammonia |
| Other Fuel Types |
By Bunkering Method
| Ship-to-Ship |
| Port-to-Ship (Truck/Pipeline) |
| LNG Barge-to-Ship |
| Portable Tanks and Containers |
By Vessel Type
| Container |
| Tanker |
| Bulk Carrier |
| General Cargo |
| Passenger/Ro-Pax |
| Offshore and Specialized |
| By Fuel Type | High-Sulfur Fuel Oil (HSFO) |
| Very-Low-Sulfur Fuel Oil (VLSFO) | |
| Ultra-Low-Sulfur Fuel Oil (ULSFO) | |
| Marine Gas Oil (MGO) | |
| Liquefied Natural Gas (LNG) | |
| Methanol | |
| Bio-/Synthetic Fuels | |
| Ammonia | |
| Other Fuel Types | |
| By Bunkering Method | Ship-to-Ship |
| Port-to-Ship (Truck/Pipeline) | |
| LNG Barge-to-Ship | |
| Portable Tanks and Containers | |
| By Vessel Type | Container |
| Tanker | |
| Bulk Carrier | |
| General Cargo | |
| Passenger/Ro-Pax | |
| Offshore and Specialized |


Key Questions Answered in the Report
How large is the United States bunker fuel market in 2026 and what growth is expected?
The market is expected to reach 18.87 million tons in 2026 and is forecast to rise to 21.46 million tons by 2031, registering a 2.61% CAGR driven by stricter emissions rules and the build-out of LNG supply.
Which fuel currently holds the biggest share of bunkers sold at U.S. ports?
Very-low-sulfur fuel oil leads with 40.63% of national volume, reflecting its role as the default IMO-2020 compliance option.
Why is LNG gaining momentum as a marine fuel along U.S. coasts?
Three new bunker barges, federal and state grants for cryogenic terminals, and dual-fuel newbuild orders across container and cruise fleets underpin a 9.1% projected annual growth rate for LNG through 2031.
What is the main infrastructure challenge for secondary ports such as Savannah and Charleston?
High capital costs, often USD 40–60 million for a dedicated LNG barge, limit access to alternative fuels, leaving these ports dependent on costlier truck-to-ship deliveries.
How does California’s LCFS influence marine-fuel purchasing decisions?
Credits averaging USD 105 per t-CO₂e in 2025 effectively discount bio-blend bunkers by USD 30-40 per metric ton and have prompted major suppliers to introduce hydrotreated vegetable-oil blends at Los Angeles, Long Beach, and San Diego.
Page last updated on:


