Cloud Storage Market Size and Share
Market Overview
| Study Period | 2020 - 2031 |
|---|---|
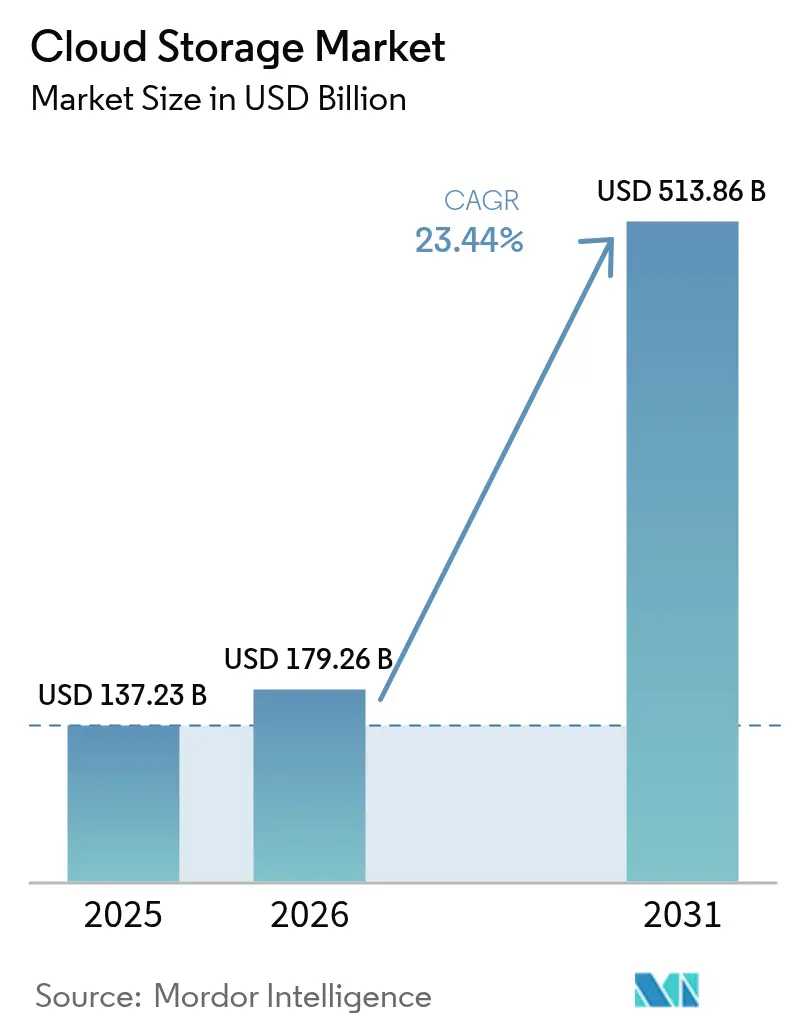
| Market Size (2026) | USD 179.26 Billion |
| Market Size (2031) | USD 513.86 Billion |
| Growth Rate (2026 - 2031) | 23.44% CAGR |
| Fastest Growing Market | Asia Pacific |
| Largest Market | North America |
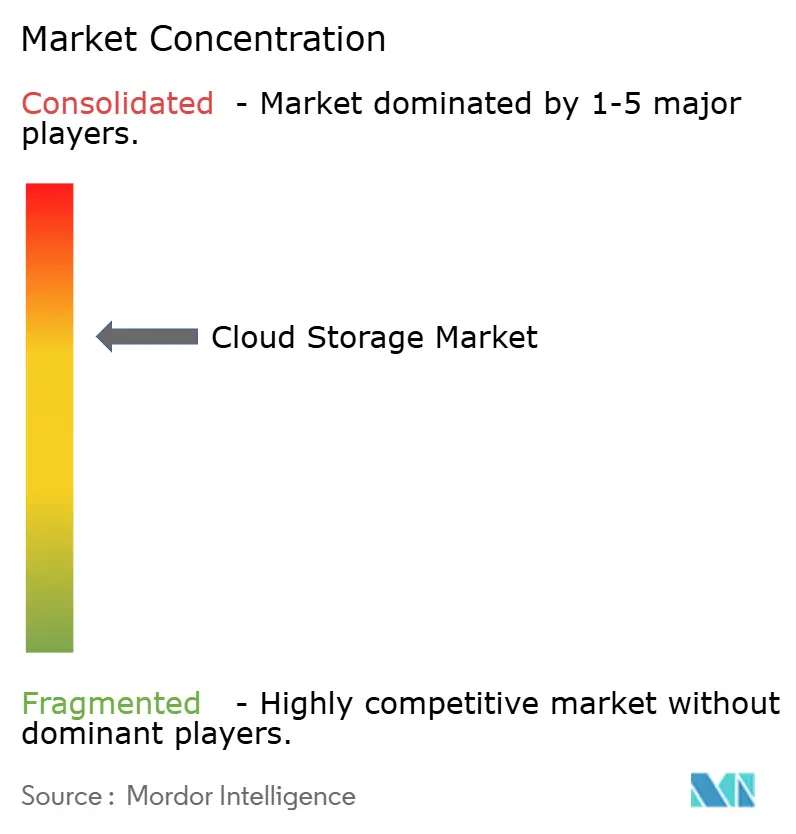
| Market Concentration | Medium |
Major Players *Disclaimer: Major Players sorted in no particular order Image © Mordor Intelligence. Reuse requires attribution under CC BY 4.0. | |
Cloud Storage Market Analysis by Mordor Intelligence
The cloud storage market size is expected to increase from USD 179.26 billion in 2026 to reach USD 513.86 billion by 2031, growing at a CAGR of 23.44% over 2026-2031. Momentum has accelerated because generative-AI pipelines are turning storage from a back-office expense into a first-order competitive resource. Regional sovereign-cloud mandates, notably in Canada and the European Union, are redirecting public-sector data flows toward in-country infrastructure, forcing hyperscalers and local providers alike to add capacity quickly. Edge-to-cloud workflows in media, gaming, and manufacturing are shrinking acceptable latency windows, which is pushing enterprises to adopt hybrid topologies that co-locate data near the point of ingestion. Pricing transparency has become a differentiator, as backlash against egress fees nudges buyers toward providers that bundle ingress, storage, and retrieval into a single tariff. Carbon-aware workload scheduling is another emergent buying criterion, rewarding operators that publish region-level emissions and automate cold-data migration to renewables-powered facilities.
Key Report Takeaways
- By storage type, object storage commanded 46.19%, while hybrid cloud storage is expected to grow at the fastest CAGR of 23.91 to 2031.
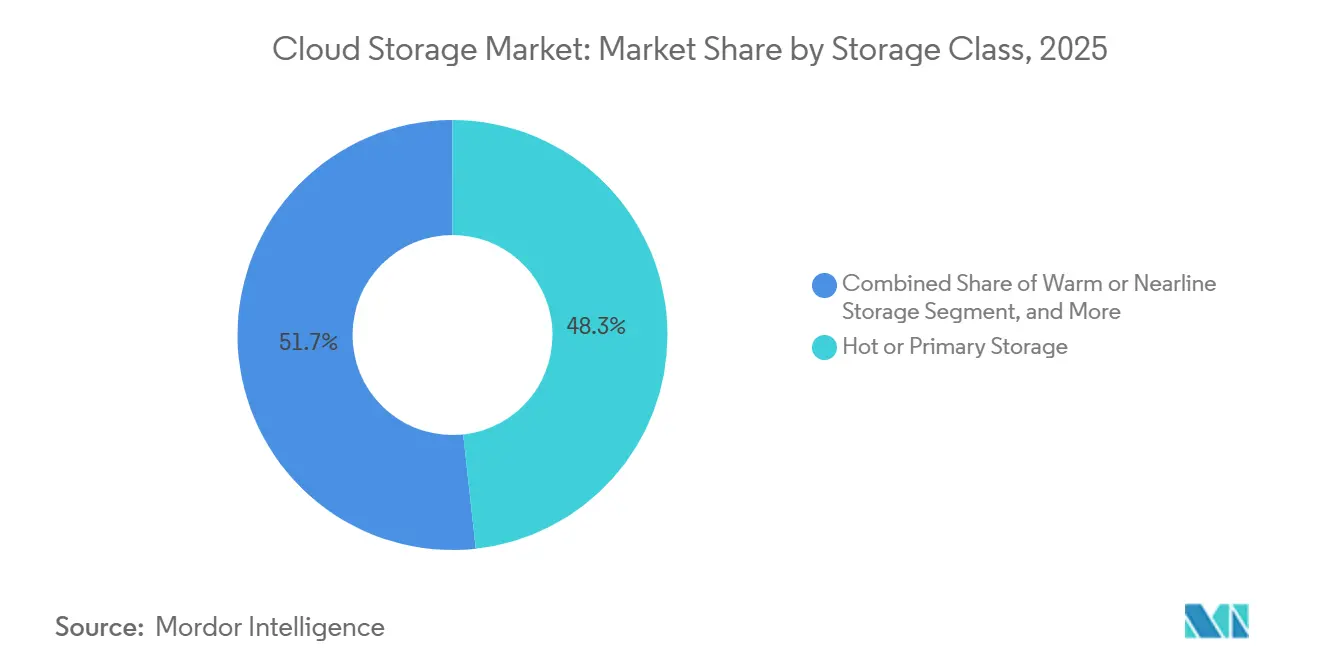
- By storage class, hot storage accounted for 48.28% of the cloud storage market size in 2025, whereas cold storage is advancing at a 23.85% CAGR to 2031.
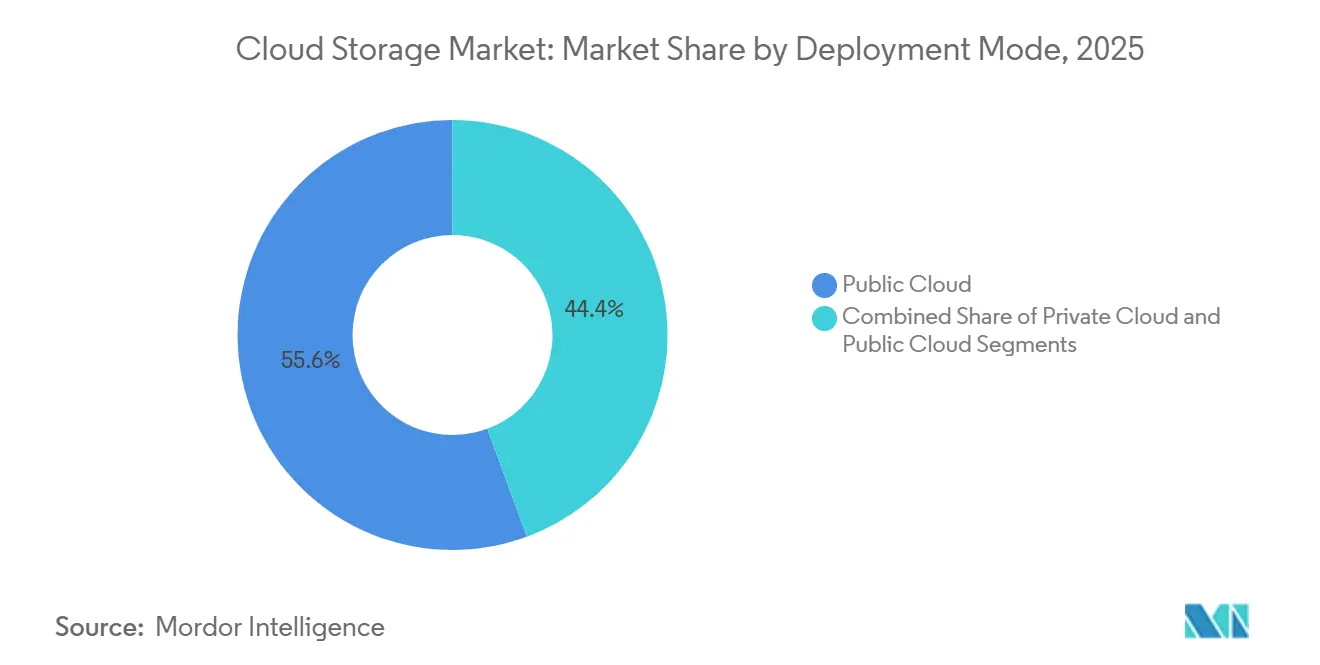
- By deployment mode, hybrid architectures are growing at a 23.91% CAGR, the fastest among all modes through 2031.
- By enterprise size, large enterprises held 64.92% revenue share in 2025, while SMEs are projected to post a 26.04% CAGR through 2031.
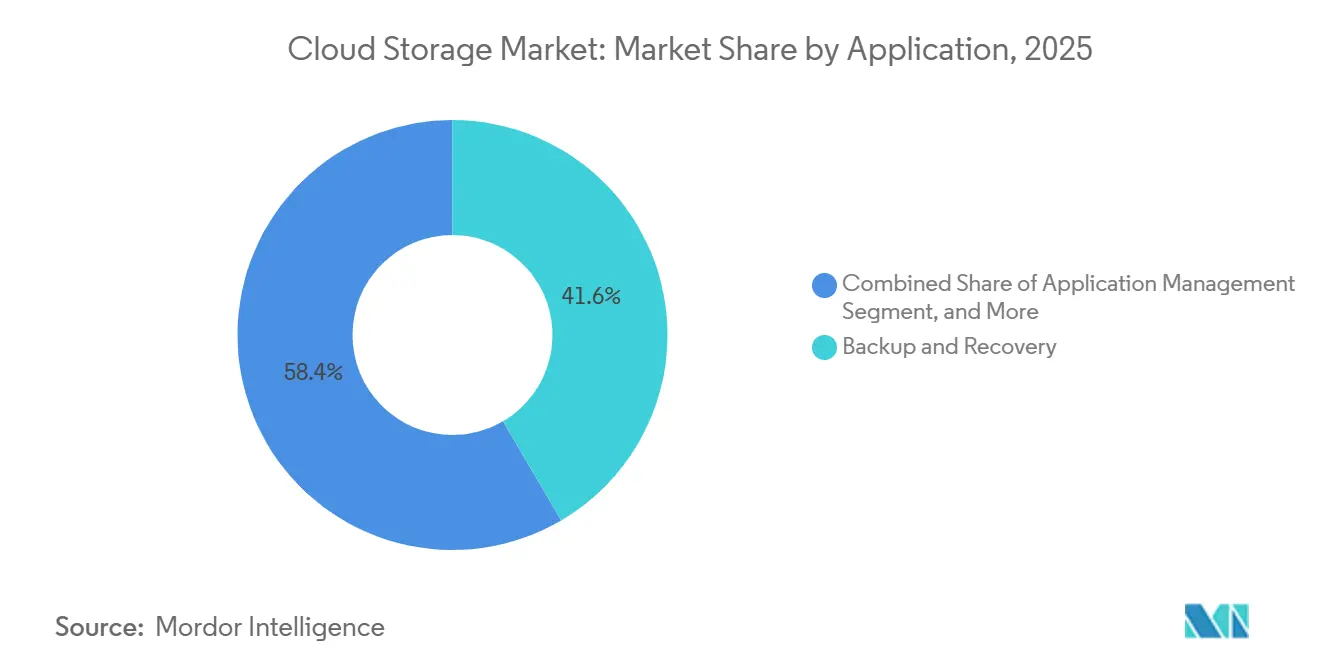
- By application, backup and recovery led with 41.56% share in 2025, yet business analytics and AI training are forecast to expand at 26.11% CAGR by 2031.
- By end-user industry, IT and telecom represented 22.83% share in 2025, while healthcare and life sciences are set to grow at 26.25% CAGR to 2031.
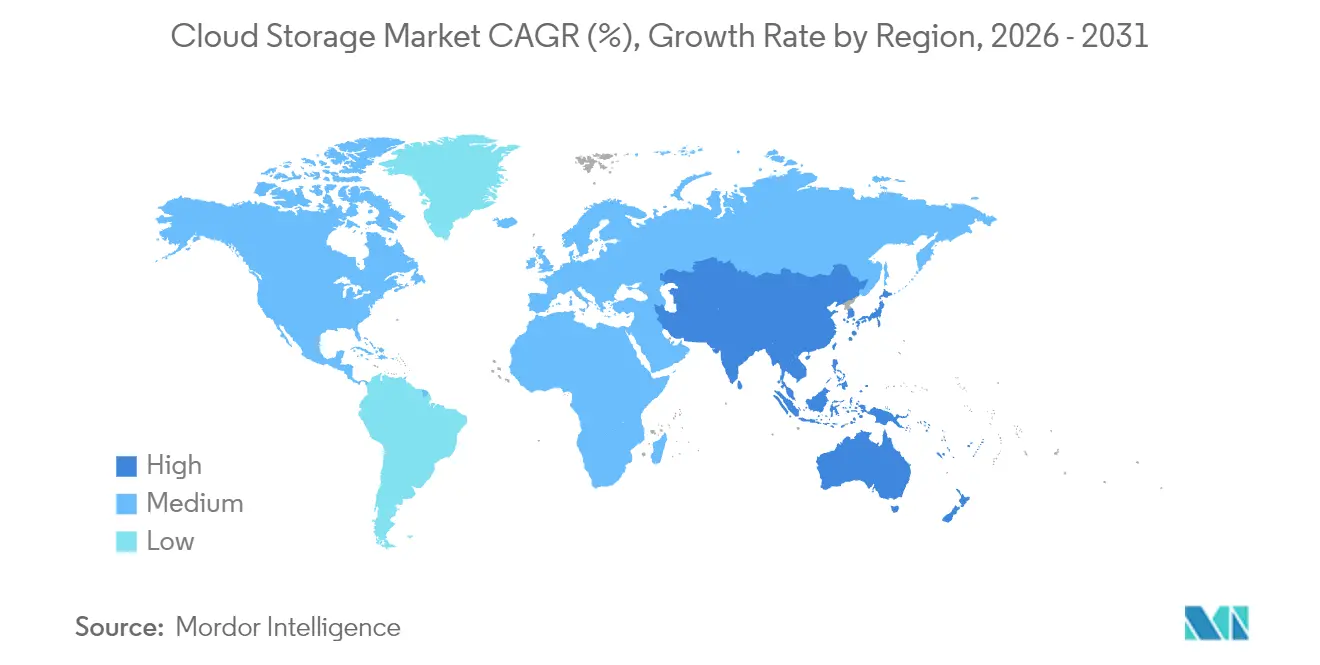
- By geography, North America ranked first with 37.79% revenue share in 2025; Asia-Pacific is on track for a 23.81% CAGR, the highest regionally to 2031.
Note: Market size and forecast figures in this report are generated using Mordor Intelligence’s proprietary estimation framework, updated with the latest available data and insights as of 2026.
Global Cloud Storage Market Trends and Insights
Drivers Impact Analysis*
| Driver | (~) % Impact on CAGR Forecast | Geographic Relevance | Impact Timeline |
|---|---|---|---|
| Gen-AI-Led Data Explosion in Knowledge-Worker Apps (2025+) | +6.20% | Global, with concentration in North America and Asia-Pacific | Medium term (2-4 years) |
| Government Stimulus for Sovereign Cloud Frameworks | +4.80% | Europe, Canada, Middle East, with emerging adoption in ASEAN | Long term (≥4 years) |
| Edge-to-Cloud Workflow Acceleration in Media and Gaming | +3.90% | North America, Europe, Asia-Pacific (South Korea, Japan) | Short term (≤2 years) |
| ESG-Driven Storage Optimization and Carbon-Aware Workloads | +3.10% | Europe, North America, with pilot programs in Asia-Pacific | Medium term (2-4 years) |
| Increase in Cloud Adoption Across Organizations | +2.90% | Global | Short term (≤2 years) |
| Rising Demand for Low-Cost, High-Speed Storage Access | +2.50% | Global, with acute demand in SME segments across all regions | Short term (≤2 years) |
| Source: Mordor Intelligence | |||
Gen-AI-Led Data Explosion in Knowledge-Worker Apps
Generative-AI workloads are rewriting storage demand curves, with training sets for large language models already surpassing 10 petabytes. Microsoft disclosed that Azure AI services consumed 40% more capacity year-over-year because enterprises are fine-tuning models on proprietary text, image, and voice corpora.[1]Microsoft Corp., “2025 Annual Report,” microsoft.com Knowledge-worker platforms such as GitHub Copilot and Notion AI save intermediate embeddings continuously, creating a new class of “hot-archive” data that must remain instantly retrievable yet priced like cold storage. The economics of pure hot tiers are breaking, so architects are adopting hybrid classes that marry NVMe performance with object economics, a pattern formalized in AWS S3 Express One Zone.[2]Amazon Web Services, “S3 Express One Zone,” aws.amazon.com Container-native apps amplify the trend because every micro-service writes logs and checkpoints to object buckets by default. Together these forces lift flash consumption, spur tiering automation, and accelerate adoption of multi-zone erasure coding to keep latency in check.
Government Stimulus for Sovereign Cloud Frameworks
Sovereign-cloud frameworks are fragmenting global storage into national silos. Canada’s Cloud Adoption Strategy obliges public agencies to prioritize domestically operated regions, rerouting sizable budgets to in-country providers.[3] The EU-backed Gaia-X consortium is codifying federated standards that permit cross-border flows within Europe while excluding non-European firms from sensitive workloads. Austria’s OeCloud rule and France’s SecNumCloud label replicate the blueprint, forcing hyperscalers to build local capacity or partner with telcos. Sovereign spending creates protected revenue pools for incumbents, but it also complicates multi-region replication because encryption keys and audit logs must stay within borders. The mandates therefore shift procurement toward hybrid architectures where sensitive data lands in sovereign zones and analytic bursts execute in public cloud sandboxes.
Edge-to-Cloud Workflow Acceleration in Media and Gaming
Media studios now ingest terabytes of 8K footage, volumetric captures, and real-time ray-traced assets daily. Netflix revealed that its production teams upload 2 petabytes of raw footage each month to S3, where ML models tag scenes automatically.[4]Netflix Inc., “2025 Shareholder Letter,” ir.netflix.net Gaming firms like Epic Games generate 100-gigabyte asset files per scene within Unreal Engine 5, demanding versioned object storage with near-zero lag. Artists in Los Angeles, London, and Mumbai need concurrent access, so providers deploy edge caches and smart pre-fetching layers through Cloudflare R2 and Fastly Compute@Edge. The same pattern spills into manufacturing as BMW streams sensor data from German plants to Azure Blob for predictive maintenance. Latency budgets below 20 milliseconds are turning storage locality into a design constraint, thereby bolstering demand for regional capacity and GPU-adjacent flash tiers.
ESG-Driven Storage Optimization and Carbon-Aware Workloads
Carbon accounting has shifted from marketing to procurement KPI. Google’s TrueCarbon assigns emissions scores to every storage region and migrates data to renewables-powered facilities automatically. Microsoft’s Sustainability Calculator lets customers weigh cost against metric-ton CO₂e, thereby integrating environmental targets into capacity planning. The EU Corporate Sustainability Reporting Directive now obliges large companies to disclose Scope 3 emissions, pushing IT buyers to demand provider-verified numbers. Inline deduplication and compression improve both density and watt-per-terabyte metrics; Pure Storage reports 5:1 data reduction, translating to a 50% energy cut for the same logical capacity. Together, regulatory pressure and technology gains make low-carbon storage a board-level purchasing criterion.
Restraints Impact Analysis*
| Restraint | (~) % Impact on CAGR Forecast | Geographic Relevance | Impact Timeline |
|---|---|---|---|
| Escalating Egress-Fee Backlash and Vendor Lock-In Risk | -2.80% | Global, with acute friction in North America and Europe | Short term (≤2 years) |
| Persistent Data-Sovereignty Complexity | -2.30% | Europe, Middle East, Asia-Pacific (India, China, ASEAN) | Long term (≥4 years) |
| Multi-Cloud Data-Sprawl Security Gaps | -1.70% | Global, with heightened risk in BFSI and healthcare sectors | Medium term (2-4 years) |
| Limited Last-Mile Bandwidth in Frontier Markets | -1.40% | Africa, South America, rural Asia-Pacific | Long term (≥4 years) |
| Source: Mordor Intelligence | |||
Escalating Egress-Fee Backlash and Vendor Lock-In Risk
Enterprises increasingly find that egress charges exceed storage fees. Cloudflare’s 2025 “egress tax” campaign highlighted invoices where clients paid USD 90,000 to retrieve a single petabyte. The U.K. Competition and Markets Authority opened an inquiry into hyperscaler pricing, citing egress as a barrier to multi-cloud choice. Google responded by dropping egress charges for migrations off its cloud, a move AWS and Microsoft have not matched. Proprietary APIs deepen lock-in, so challengers like Wasabi offer S3-compatible endpoints with zero exit fees. The uproar is causing some enterprises to architect data footprint-minimization strategies that co-locate compute wherever the data already resides, dampening cross-region replication spend.
Persistent Data-Sovereignty Complexity
The European Data Protection Board issued 14 new transfer guidelines in 2025 alone, narrowing permissible cross-border flows. India’s Digital Personal Data Protection Act requires that sensitive categories stay on Indian soil, so hyperscalers are funding local regions at an accelerated clip. China’s Data Security Law imposes similar residency, compelling Alibaba and Tencent to allocate capacity domestically. Financial institutions shoulder the heaviest compliance load; a 2025 PwC survey found 60% of banks duplicating storage clusters for each regulatory zone. Parallel environments inflate overhead, fragment observability, and raise incident-response complexity, thereby muting achievable economies of scale and nudging growth downward.
*Our forecasts treat driver/restraint impacts as directional, not additive. The impact forecasts reflect baseline growth, mix effects, and variable interactions.
Segment Analysis
By Deployment Mode: Hybrid Cloud Balances Sovereignty and Scale
Hybrid configurations captured a growing slice of the cloud storage market in 2026 because they let firms keep regulated data on premises while bursting compute to hyperscalers. Banking and healthcare leaders maintain on-prem snapshots of core systems to satisfy regulators, yet push AI model training into public GPUs overnight, demonstrating why hybrid models are advancing at a 23.91% CAGR. These blends limit vendor lock-in by making Kubernetes the abstraction layer and allow tiering rules to move infrequently used blobs into cheaper sovereign zones.
Capital-intensive private clouds trail because hardware refresh cycles outpace budget cycles, while pure public deployments face scrutiny from finance chiefs alarmed by opaque egress bills. Telcos embrace hybrid design for 5G network slicing, caching subscriber state at the edge but centralizing billing records. Manufacturing follows suit by syncing plant telemetry to local clusters before shipping aggregates to analytics lakes. Collectively, these use cases keep hybrid firmly positioned as the most versatile solution, ensuring it remains pivotal to the cloud storage market through 2031.


By Storage Type: Object Dominates but Block Gains Momentum in Containers
Object storage held 46.19% of the cloud storage market share in 2025 thanks to S3-compatible APIs that power data lakes, media libraries, and backup repositories. However, block storage is accelerating at a 23.78% CAGR, lifted by containerized databases that demand persistent volumes. CSI drivers from NetApp and Pure Storage bring enterprise features such as snapshots into Kubernetes, letting developers treat persistence like code.
File storage stays relevant for legacy NFS workloads and AI training that prefers POSIX semantics. The rise of hybrid offerings, exemplified by AWS FSx for Lustre merging file speed with object economics, blurs category lines. NVMe-over-Fabrics brings sub-millisecond latency to block, shrinking the performance delta from local SSDs. As micro-services proliferate, block’s share will climb, yet object’s scale and immutability keep it the backbone of the cloud storage market for the foreseeable horizon.
By Storage Class: Cold Storage Becomes the Ransomware Backstop
Hot tiers owned 48.28% of revenue in 2025 because real-time analytics dominate enterprise priorities, but cold storage is now the fastest climber, propelled by ransomware recovery and compliance. Immutable archives satisfy SEC Rule 17a-4 and HIPAA, ensuring that encrypted snapshots stay tamper-proof for years. AWS Glacier Deep Archive costs USD 0.00099 per gigabyte-month, a 23-fold delta from hot S3 Standard, making it irresistible for retention policies exceeding five years.
Intelligent tiering automates migration across hot, warm, and cold layers, so data slides to the cheapest viable tier without human intervention. Veeam found firms with immutable cold backups recovered 30% faster post-attack, strengthening the business case. Consequently, cold storage’s rapid expansion underpins a fundamental shift in how risk officers budget data protection, embedding it deeply within the cloud storage market size calculus.
By Enterprise Size: SMEs Narrow the Capability Gap
Large organizations still generated 64.92% of 2025 revenue, but SMEs are expanding at a 26.04% CAGR because pay-as-you-go models erase capital hurdles. Credits from AWS Activate and Google Cloud for Startups let new ventures prototype at near-zero cost, while Wasabi’s flat-rate subscription resonates with budget-constrained teams. Dropbox Business and Backblaze further democratize enterprise-grade durability by rolling it into consumer-like interfaces.
Even so, mega-corps such as Walmart run private clouds exceeding 100 petabytes to feed supply-chain algorithms, a scale SMEs will not replicate soon. Multicloud governance and custom hardware remain enterprise luxuries. Yet the ongoing commoditization of petabyte-scale capacity means SMEs will continue trimming the capability delta, ensuring that their faster growth materially affects the overall cloud storage market.
By Application: AI Training Displaces Passive Backup
Backup and recovery retained 41.56% share in 2025, but AI training and analytics workloads now post the highest expansion at 26.11% CAGR. Training language models needs high-throughput file systems to keep GPUs busy; Google’s Hyperdisk ML offers 2.4 million IOPS specifically for this use case. Versioned datasets and lineage metadata turn storage from a sink cost into an operational asset.
Collaboration suites such as Microsoft Teams log thousands of file versions daily, inflating transactional I/O. Containerized application management sparks demand for clone-on-write snapshots that let developers spin test environments instantly. Archiving remains a compliance must but is increasingly automated through lifecycle policies. As enterprises pivot toward insight extraction, active workloads will steadily erode the historical dominance of passive backup within the cloud storage market.
By End-User Industry: Healthcare Leaps Ahead on Genomics
IT and telecom led with 22.83% contribution in 2025 because operators both sell and consume storage. Healthcare, however, is set for the steepest climb at 26.25% CAGR. Whole-genome sequencing creates 200 gigabytes per patient, and precision-medicine programs now sequence thousands annually, exploding cold archive demand while also driving hot-tier analytics for AI diagnostics.
Financial services rely on cold tiers to meet Basel III record-keeping, whereas media and entertainment drive hot object usage for production pipelines. Government and public sector adoption follows sovereign mandates that favour local vendors. Manufacturing and retail feed digital twins and recommendation engines, respectively, both requiring mixed hot and warm tiers. This mosaic of needs sustains diversified revenue streams and ensures the cloud storage market remains resilient across macro cycles.
Geography Analysis
North America retained 37.79% of global spend in 2025, buoyed by hyperscaler headquarters and early enterprise adoption. The United States dominates data center footprints, while Canada’s sovereign rules channel public workloads toward domestic operators. Mexico’s growth is linked to near-shoring investments that replicate manufacturing telemetry into regional clouds.
Asia-Pacific is the fastest-climbing geography, charting a 23.81% CAGR. India’s Digital India push and China’s USD 50 billion sovereign AI fund both swell capacity demand. ASEAN states such as Singapore and Indonesia attract new builds as multinationals seek geopolitical diversity. Japan, led by Fujitsu and NEC, adopts hybrid deployments to meld strict corporate governance with cloud elasticity.
Europe’s trajectory is shaped by GDPR and Gaia-X, which foster demand for in-region storage clusters. Germany, the United Kingdom, and France anchor spending, while Russia’s isolated market relies on Yandex Cloud. South America’s growth clusters around Brazil and Argentina, where data protection laws emulate GDPR. The Middle East invests in sovereign hyperscale zones to advance diversification, and South Africa emerges as Africa’s regional hub despite bandwidth challenges elsewhere on the continent.

Competitive Landscape
The cloud storage market is moderately concentrated, AWS, Microsoft, and Google control roughly 60% but face squeeze from regional incumbents and egress-free challengers. Hyperscalers leverage integrated stacks that bundle compute, AI accelerators, and proprietary silicon such as AWS Graviton and Google TPU to deepen stickiness. Margin pressure emerges as customers protest exit fees, prompting some vendors to trial inclusive pricing or local region rebates to stave off churn.
Regional players carve niches by aligning with sovereign mandates and publishing transparent cost structures. Wasabi and Backblaze win media and gaming contracts on zero-egress promises, while Cloudflare monetizes its global edge by embedding storage alongside its content delivery network. Open-source platforms like MinIO and Ceph find traction inside private clouds, giving enterprises leverage in vendor negotiations.
Technology advances concentrate on throughput and latency. AWS S3 Express One Zone co-locates storage and compute for millisecond reads, Pure Storage FlashBlade unites NVMe and scale-out to hit multigigabyte-per-second rates for AI pipelines, and Microsoft adds NFSv3 to Blob Storage to ease migrations from legacy NAS. Compliance certifications such as FedRAMP High and ISO 27001 are table stakes, so providers differentiate with automated governance dashboards that streamline audit prep.
Cloud Storage Industry Leaders
Google LLC (Alphabet Inc.)
Amazon Web Services Inc.
Dropbox Inc
Dell EMC (Dell Technologies Inc.)
Hewlett Packard Enterprise Company
- *Disclaimer: Major Players sorted in no particular order

Recent Industry Developments
- January 2026: Siemens AG allocated EUR 500 million (USD 540 million) to expand its Amberg plant, integrating quantum-safe encryption and edge artificial intelligence to lift throughput 25%.
- December 2025: ABB Ltd bought a 70% stake in a Chinese Industrial Internet of Things software firm for USD 180 million, extending electronics and automotive solutions.
- November 2025: Schneider Electric SE released EcoStruxure Hybrid DCS, enabling on-premises control with cloud analytics, cutting total cost of ownership 20-30%.
- October 2025: Rockwell Automation Inc. and Microsoft embedded Azure AI models into FactoryTalk for predictive maintenance.


Global Cloud Storage Market Report Scope
The Cloud Storage Market Report is Segmented by Deployment Mode (Private Cloud, Public Cloud, Hybrid Cloud), Storage Type (File Storage, Object Storage, Block Storage), Storage Class (Hot or Primary Storage, Warm or Nearline Storage, Cold or Archive Storage), Enterprise Size (SMEs, Large Enterprises), Application (Backup and Recovery, Data Management and Archiving, Application Management, Collaboration and Content Services, Business Analytics and AI Training), End-User Industry (BFSI, Healthcare and Life Sciences, Government and Public Sector, Manufacturing, Retail and E-Commerce, IT and Telecom, Media and Entertainment, Other End-User Industries), and Geography (North America, South America, Europe, Asia-Pacific, Middle East, Africa). The Market Forecasts are Provided in Terms of Value (USD).
| Paper and Paperboard | |
| Plastic | Polypropylene (PP) |
| HDPE and LDPE | |
| PET | |
| PVC | |
| PS | |
| Other Plastics | |
| Metal | |
| Container Glass |
| Paper and Paperboard Product | Folding Carton and Rigid Boxes | |
| Corrugated Boxes and Containers | ||
| Single-Use Paper Products | ||
| Other Paper and Paperboard Types | ||
| Plastic Product | Rigid Plastics | Bottles and Jars |
| Caps and Closures | ||
| Bulk-Grade Products | ||
| Other Rigid Plastics | ||
| Flexible Plastics | Pouches | |
| Bags | ||
| Films and Wraps | ||
| Other Flexible Plastics | ||
| Metal Product | Cans | |
| Caps and Closures | ||
| Aerosol Containers | ||
| Other Metal Products | ||
| Container Glass Product | Bottles | |
| Jars | ||
| Rigid Packaging Format |
| Flexible Packaging Format |
| Food |
| Beverage |
| Pharmaceutical and Medical |
| Personal Care and Cosmetics |
| Industrial and Chemical |
| Agriculture |
| Automotive |
| Other End-User Industries |
| By Material Type | Paper and Paperboard | ||
| Plastic | Polypropylene (PP) | ||
| HDPE and LDPE | |||
| PET | |||
| PVC | |||
| PS | |||
| Other Plastics | |||
| Metal | |||
| Container Glass | |||
| By Product Type | Paper and Paperboard Product | Folding Carton and Rigid Boxes | |
| Corrugated Boxes and Containers | |||
| Single-Use Paper Products | |||
| Other Paper and Paperboard Types | |||
| Plastic Product | Rigid Plastics | Bottles and Jars | |
| Caps and Closures | |||
| Bulk-Grade Products | |||
| Other Rigid Plastics | |||
| Flexible Plastics | Pouches | ||
| Bags | |||
| Films and Wraps | |||
| Other Flexible Plastics | |||
| Metal Product | Cans | ||
| Caps and Closures | |||
| Aerosol Containers | |||
| Other Metal Products | |||
| Container Glass Product | Bottles | ||
| Jars | |||
| By Packaging Format | Rigid Packaging Format | ||
| Flexible Packaging Format | |||
| By End-User Industry | Food | ||
| Beverage | |||
| Pharmaceutical and Medical | |||
| Personal Care and Cosmetics | |||
| Industrial and Chemical | |||
| Agriculture | |||
| Automotive | |||
| Other End-User Industries | |||


Key Questions Answered in the Report
How fast is the cloud storage market expected to grow between 2026 and 2031?
The market is forecast to expand from USD 179.26 billion in 2026 to USD 513.86 billion by 2031, translating to a 23.44% CAGR.
Which storage class is growing the quickest?
Cold or archive storage is advancing at a 23.85% CAGR, driven by ransomware protection and regulatory archiving.
Why are hybrid cloud deployments accelerating?
Hybrid balances data-sovereignty compliance with public-cloud elasticity, leading to the fastest CAGR of 23.91% among deployment modes.
What is driving storage demand in healthcare?
Genomics sequencing and AI diagnostics generate large datasets, propelling healthcare to a 26.25% CAGR through 2031.
How are egress fees affecting buying decisions?
Rising backlash against high exit costs is steering enterprises toward providers that offer zero-egress or bundled pricing models.
Which region will post the highest growth?
Asia-Pacific is set for the quickest rise with a 23.81% CAGR, supported by policy initiatives in India, China, and ASEAN economies.
Page last updated on:


