Cloud Monitoring Market Size and Share
Market Overview
| Study Period | 2020 - 2031 |
|---|---|
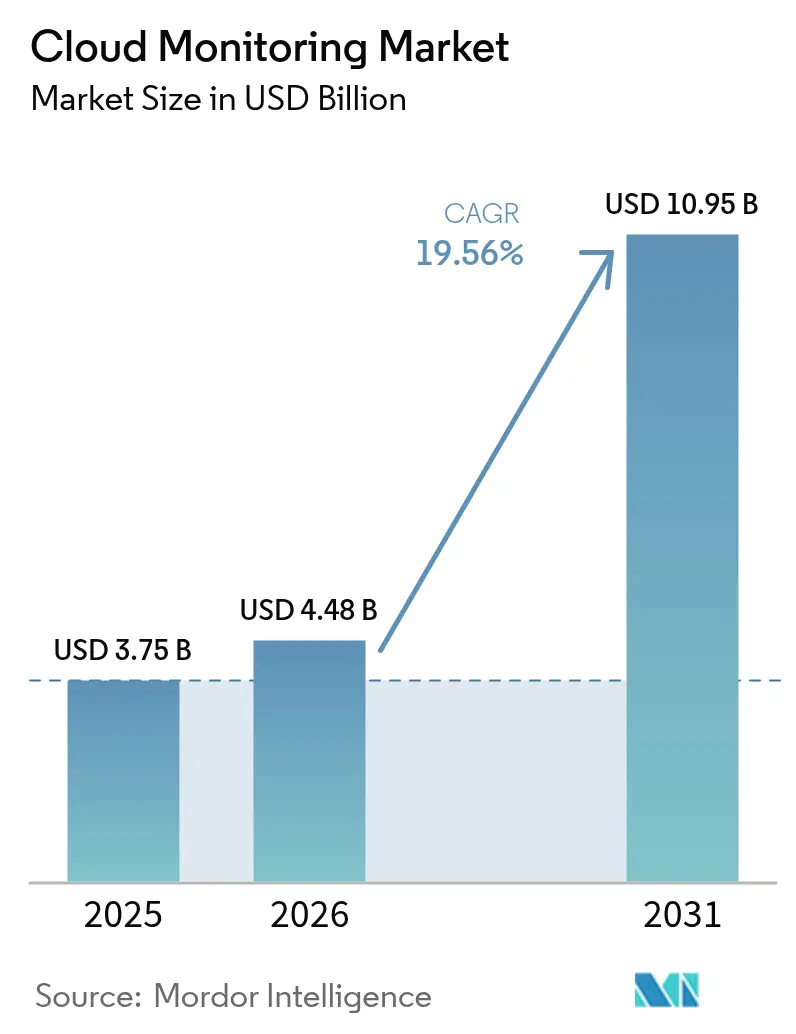
| Market Size (2026) | USD 4.48 Billion |
| Market Size (2031) | USD 10.95 Billion |
| Growth Rate (2026 - 2031) | 19.56% CAGR |
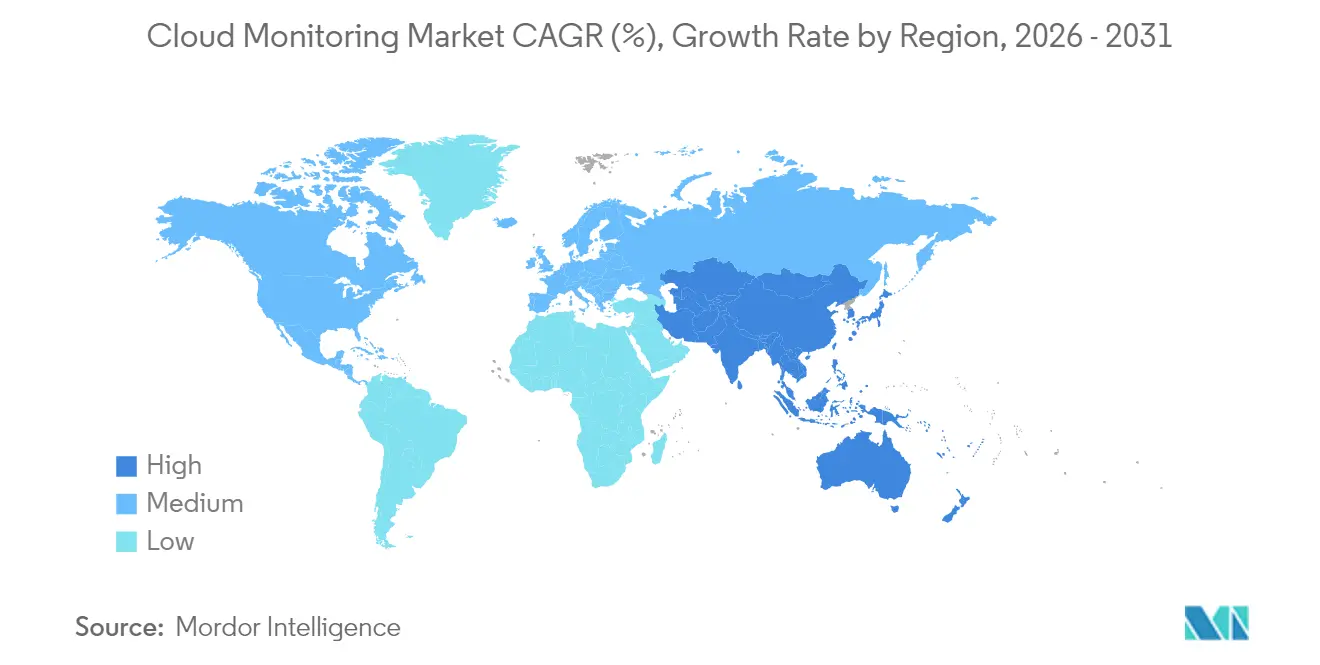
| Fastest Growing Market | Asia Pacific |
| Largest Market | North America |
| Market Concentration | Medium |
Major Players *Disclaimer: Major Players sorted in no particular order Image © Mordor Intelligence. Reuse requires attribution under CC BY 4.0. | |
Cloud Monitoring Market Analysis by Mordor Intelligence
The Cloud Monitoring Market size is expected to grow from USD 3.75 billion in 2025 to USD 4.48 billion in 2026 and is forecast to reach USD 10.95 billion by 2031 at 19.56% CAGR over 2026-2031.
Accelerated multi-cloud adoption, AI workload visibility, FinOps accountability, and data-sovereignty mandates are reshaping vendor roadmaps. Enterprises are replacing point monitoring tools with unified platforms that ingest logs, metrics, traces, user experience, and cost signals in real time. OpenTelemetry’s rapid standardization is lowering integration friction, while AI-driven anomaly detection shortens the mean time to resolution. Spending is shifting from pure infrastructure metrics toward full-stack intelligence that ties technical health to revenue impact. Competitive intensity remains moderate as hyperscale clouds embed native tooling, yet still partner with independent vendors to address hybrid estates.
Key Report Takeaways
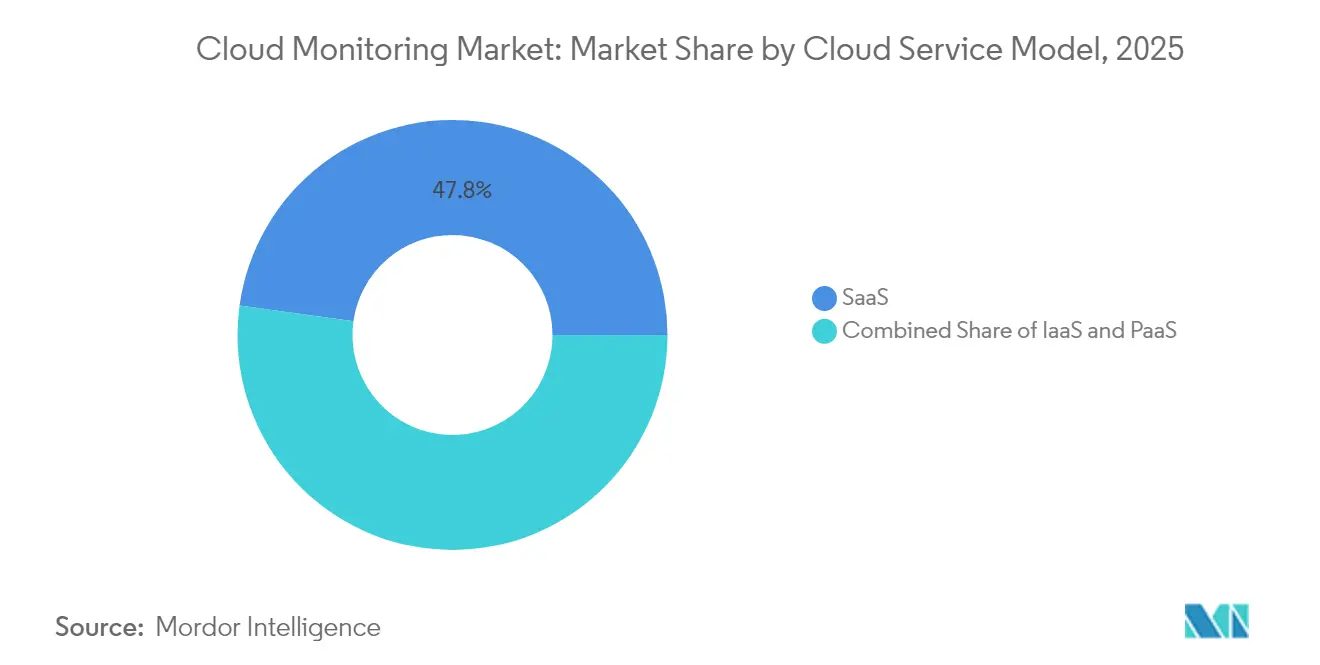
- By cloud service model, SaaS offerings held 47.80% of the cloud observability market share in 2025; PaaS solutions are forecast to grow at 28.45% CAGR to 2031.
- By component, solutions accounted for 61.30% of the cloud observability market size in 2025, while services are expanding at 18.85% CAGR through 2031.
- By deployment mode, public cloud retained 56.40% revenue share in 2025; hybrid and multi-cloud options are set to post a 23.95% CAGR to 2031.
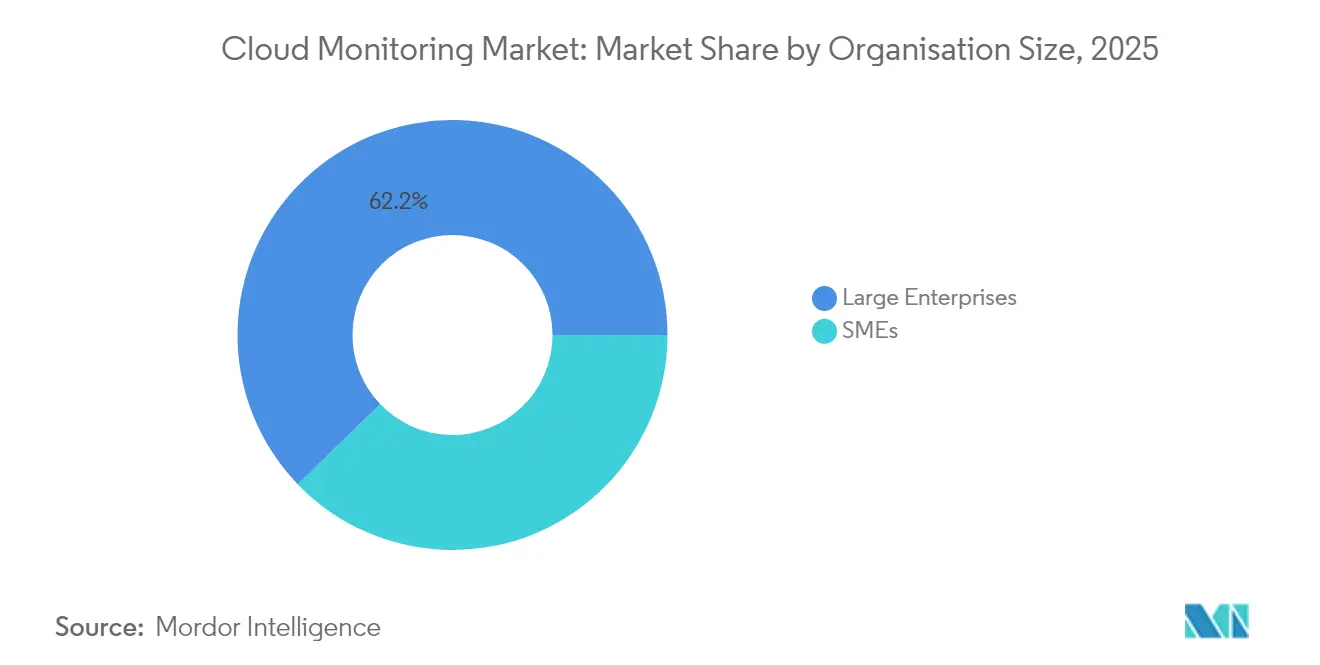
- By organization size, large enterprises contributed 62.20% of 2025 revenue, whereas SMEs are the fastest-growing segment at 18.05% CAGR.
- By end-user industry, IT & telecommunications led with 28.60% share in 2025; retail & e-commerce is projected to climb at 17.25% CAGR to 2031.
- By region, North America commanded 40.60% revenue in 2025; Asia Pacific is the quickest-expanding geography at 20.85% CAGR to 2031.
Note: Market size and forecast figures in this report are generated using Mordor Intelligence’s proprietary estimation framework, updated with the latest available data and insights as of 2026.
Global Cloud Monitoring Market Trends and Insights
Drivers Impact Analysis*
| Driver | % Impact on CAGR Forecast | Geographic Relevance | Impact Timeline |
|---|---|---|---|
| Accelerated multi-cloud and hybrid-cloud adoption | +4.20% | Global, with a concentration in North America & Europe | Medium term (2-4 years) |
| DevOps/SRE culture and need for real-time observability | +3.80% | Global, led by North America, is expanding in APAC | Short term (≤ 2 years) |
| AI/ML workload explosion requiring GPU-level monitoring | +3.50% | North America & APAC core, spill-over to Europe | Medium term (2-4 years) |
| FinOps accountability and cost-to-value optimisation pressure | +2.90% | Global, with early adoption in North America | Short term (≤ 2 years) |
| Sustainability dashboards for cloud-carbon reporting | +1.80% | Europe-led, expanding to North America & APAC | Long term (≥ 4 years) |
| Sovereign-cloud and data-localisation mandates | +2.10% | Europe & APAC core, selective adoption in other regions | Medium term (2-4 years) |
| Source: Mordor Intelligence | |||
Accelerated Multi-Cloud and Hybrid-Cloud Adoption
Multi-cloud usage crossed a tipping point, with 43% of financial-services firms already distributing workloads across two or more hyperscalers in 2024. Each provider exports unique metrics, so operations teams face telemetry sprawl and blind spots. Unified platforms that normalise data across AWS, Azure, and Google Cloud are therefore replacing single-cloud monitors. Adoption of OpenTelemetry agents rose sharply because vendor-neutral instrumentation eases estate-wide coverage. Organisations also need correlated cost, performance, and compliance views when the same transaction spans on-premises and cloud nodes. These pressures elevate hybrid-cloud observability from optional to indispensable capability, pushing the cloud observability market toward deeper end-to-end context.
DevOps/SRE Culture and Real-Time Observability
Site Reliability Engineering is mainstreamed in large enterprises, cutting mean outage costs that exceed USD 1 million per hour[1]Buddy Brewer, “The Economics of Observability,” New Relic, newrelic.com. Teams now embed golden signals and service-level objectives into CI/CD pipelines so that defects surface before production rollouts. Full-stack insight lowers downtime by 79% versus siloed toolchains. AI-driven anomaly detection augments humans by surfacing precursors to incidents across logs and traces. Faster feedback loops also boost developer productivity, turning observability into a direct business enabler. The cloud observability market, therefore, benefits from budgets shifting left toward engineering teams rather than traditional IT operations.
AI/ML Workload Explosion Requiring GPU-Level Monitoring
Language-model training and real-time inference push GPU clusters to cost hundreds of dollars per hour, demanding granular utilisation metrics. Vendors now expose tensor-core heat, memory bandwidth, and energy draw within the same dashboards that track latency. Datadog’s purchase of Metaplane extended coverage to data-pipeline quality, proving that model accuracy and infrastructure health must be observed together. Edge cases, such as AI agents acting autonomously, need continuous policy-compliance checks. These specialised requirements expand the addressable base for the cloud observability market far beyond classic application performance monitoring.
FinOps Accountability and Cost-to-Value Optimisation Pressure
Observability ingestion can consume 15-25% of cloud spend, so finance leaders demand ROI proof. New platforms apply intelligent sampling and retention tuning to shrink storage without losing critical context. FinOps dashboards now attribute spend down to feature or customer level, enabling charge-back and optimisation decisions. Consumption-based licensing models are replacing host-based pricing that penalized Kubernetes density. This fiscal discipline aligns vendor success with customer savings, enhancing stickiness across all tiers of the cloud observability market.
Restraints Impact Analysis*
| Restraint | % Impact on CAGR Forecast | Geographic Relevance | Impact Timeline |
|---|---|---|---|
| Limited visibility in containerised, serverless stacks | -2.80% | Global, particularly affecting cloud-native organizations | Short term (≤ 2 years) |
| Rising TCO of full-stack observability platforms | -3.20% | Global, with higher impact in cost-sensitive regions | Medium term (2-4 years) |
| Skills gap for observability engineering | -2.10% | Global, acute in APAC & emerging markets | Long term (≥ 4 years) |
| Hyperscaler API-rate limits, throttling, deep telemetry | -1.90% | Global, affecting high-volume data analytics users | Short term (≤ 2 years) |
| Source: Mordor Intelligence | |||
Limited Visibility in Containerised, Serverless Stacks
Containers may live for seconds, while serverless functions spin up without agents, leaving gaps that legacy monitors cannot fill. Kubernetes adds torrent-level metadata, so brute-force collection inflates storage bills. Distributed tracing that stitches request paths across microservices, combined with eBPF-based low-overhead instrumentation, is emerging as the remedy. OpenTelemetry is pivotal yet still complex to deploy, explaining slower adoption among resource-constrained SMEs. Until turnkey instrumentation matures, observability gaps in ephemeral environments will drag on the cloud observability market CAGR.
Rising TCO of Full-Stack Observability Platforms
Enterprises now store petabytes of telemetry for compliance audits, escalating storage and egress fees that can overtake license costs[2]Martin Mao, “Taming Telemetry Volume at Scale,” Chronosphere, chronosphere.io . Proprietary pricing, often mixing host count and data volume, frustrates budget forecasting. In response, customers adopt open-source back-ends such as ClickHouse or Loki while retaining vendor UI layers or negotiate data tiering that keeps cold logs in cheaper object stores. Vendors are racing to deliver auto-tuning pipelines that drop low-value noise before it ever hits disk. Cost control innovations must keep pace, or some buyers will delay rollouts, capping worst-case revenue upside for the cloud observability market.
*Our forecasts treat driver/restraint impacts as directional, not additive. The impact forecasts reflect baseline growth, mix effects, and variable interactions.
Segment Analysis
By Cloud Service Model: SaaS Dominance Meets PaaS Innovation
SaaS platforms anchored 47.80% of 2025 revenue, underscoring demand for turnkey deployments that remove infrastructure overhead. PaaS solutions shape the fastest lane, growing 28.45% CAGR as users crave deeper code-level insight without managing collectors. IaaS tools retain relevance for hybrid estates that need on-premises collectors close to regulated data. The cloud observability market size for SaaS is forecast to widen by USD 2.92 billion between 2026 and 2031 as lagging industries migrate to managed services.
PaaS momentum reflects platform-engineering teams embedding observability into internal developer portals. Big-tech vendors integrate tracing, chaos testing, and KPI dashboards directly into build pipelines, reducing cognitive load. Combined with OpenTelemetry auto-instrumentation, this synergy accelerates time to value. Consequently, the cloud observability market records almost one-third of net-new bookings from PaaS deals targeting AI model observability and cost analytics.


By Component: Solutions Lead While Services Accelerate
Solution suites captured 61.30% revenue in 2025, covering data lakes, correlation engines, and UX analytics. Services consulting, onboarding, and managed observability grow 18.85% CAGR as enterprises struggle to hire observability engineers. Integrator demand is highest in regulated verticals where instrumentation must map to control frameworks.
Vendor roadmaps now bundle advisory hours, certified training, and quick-start packs that shorten proof-of-value cycles. LogicMonitor’s USD 800 million funding earmarked for services expansion signals how professional expertise becomes a key moat. As frameworks evolve, recurring service contracts will comprise a larger slice of the overall cloud observability market revenue, deepening partner ecosystems.
By Deployment Mode: Public Cloud Leadership with Hybrid Surge
Public-cloud deployments represented 56.40% income in 2025, thanks to latency-free data flow within single VPCs. Hybrid and multi-cloud options, however, record 23.95% CAGR as organisations hedge against lock-in and pursue workload portability. The cloud observability market share for multi-cloud stacks will surpass 30.50% by 2031 if current deal velocity holds.
Data-sovereignty rules in Europe and Asia force some workloads on-premises or in sovereign regions, increasing the need for topology-agnostic visibility. Cisco’s acquisition of Splunk highlights demand for platforms spanning data centres, edge, and clouds. Seamless license portability and federated dashboards now appear on every enterprise RFP, anchoring hybrid appeal.
By Organisation Size: Enterprise Stability Versus SME Dynamism
Enterprises supplied 62.20% of 2025 billings, driven by vast telemetry volume and bespoke analytics. SMEs, empowered by usage-based pricing, deliver 18.05% CAGR as they embed observability on day one of product builds. The cloud observability market size for SMEs is projected to reach USD 2.18 billion by 2031.
Startup developers choose SaaS tiers that auto-scale, shifting budget from headcount to managed tooling. As SMEs mature, they often keep the same vendor, lifting lifetime value. Vendors respond with tiered SKUs and community editions that convert freemium users at low acquisition cost, sustaining segment momentum.
By End-User Industry: IT Leadership with Retail Acceleration
IT and telecom retained a 28.60% share due to complex micro-service estates and stringent SLAs. Retail & e-commerce posts 17.25% CAGR as one-second page delays erode cart revenue. The cloud observability market size for retail could top USD 1.33 billion by 2031 if current digital-commerce growth holds.
In BFSI, real-time fraud analytics and regulatory audit trails drive deep tracing adoption. Healthcare pursues HIPAA-aligned dashboards that encrypt telemetry at rest. Manufacturing links plant-floor sensors to cloud diagnostics for predictive maintenance. Cross-industry expansion underlines the cloud observability market breadth, with vertical modules tailoring terminology and compliance widgets.
Geography Analysis
North America commanded 40.60% of 2025 revenue, reflecting decades-long DevOps maturity and heavy AI investment. Financial institutions cite median outage losses of USD 10.44 million per year, justifying premium tooling. Sovereign-cloud talk is muted, yet privacy laws still nudge data residency features. Growth moderates to low teens after 2027 as replacement cycles saturate, but AI observability upgrades sustain license expansion.
Asia Pacific is the fastest mover at 20.85% CAGR, propelled by cloud-first start-ups and government digital drives. India’s public cloud outlay could reach USD 25.5 billion by 2028. Observability ROI tops 114% in Singapore and Indonesia, showcasing high payoff for downtime reduction. China’s 6.192 trillion-yuan cloud sector, led by Alibaba Cloud’s 43% hold, fuels local-language dashboards and in-country data lakes.
Europe records mid-teens CAGR as GDPR and upcoming AI Act cement data-protection demands. Accenture notes 37% of enterprises investing in sovereign cloud, with 44% planning more within two years. Vendors partner with regional hosts to ensure EU-located logging pipelines. Energy dashboards gain traction as climate reporting merges with performance metrics. These regional nuances collectively propel the cloud observability market toward diverse compliance-aware deployments.

Competitive Landscape
The market remains moderately fragmented. Datadog posted USD 762 million Q1 2025 sales, up 25% YoY, while Dynatrace reached USD 1.647 billion ARR, up 16%. Cisco’s USD 28 billion Splunk buyout signals convergence between security and observability, raising entry barriers. Meanwhile, challenger Chronosphere touts cost-efficient time-series ingest built on open-source M3.
Strategic differentiation concentrates on AI workload probes, FinOps metrics, and policy-ready data controls. Datadog’s Metaplane pick-up expands data lineage views critical for model governance. ClickHouse’s HyperDX deal inserts high-speed columnar storage under an OpenTelemetry-native UI. Hyperscalers bundle native monitoring yet still certify third-party partners for hybrid reach, protecting independent vendors.
Patents around distributed sampling and GPU telemetry deepen protective moats. Vendors file for automated anomaly-explanation engines that summarise root cause narratives. Ecosystem partnerships with enterprise resource planning, incident-response chatops, and ticketing systems enhance stickiness. The competitive chessboard will likely tilt toward platform suites that integrate security, cost, and sustainability signals without forcing data egress, reinforcing customer lock-in, yet lowering integration toil.
Cloud Monitoring Industry Leaders
AWS
Broadcom Inc. (CA Technologies)
IDERA Inc.
LogicMonitor Inc.
Oracle Corporation
- *Disclaimer: Major Players sorted in no particular order


Recent Industry Developments
- April 2025: Datadog acquired Metaplane to add AI-powered data-observability features.
- April 2025: Cisco closed its USD 28 billion purchase of Splunk, forming a security-observability powerhouse.
- March 2025: ClickHouse bought HyperDX to blend high-speed analytics with end-to-end telemetry.
- February 2025: BMC Software announced the acquisition of Netreo, adding full-stack observability to BMC Helix.


Global Cloud Monitoring Market Report Scope
Cloud monitoring is the process of monitoring, reviewing, and managing the operational processes and workflow within a cloud-based IT infrastructure. IT monitoring ensures that a cloud infrastructure or platform is performing efficiently. In addition to cloud monitoring and providing cloud infrastructure/solution/service, cloud monitoring data also helps assess the entire infrastructure's performance on an optimal level. Properties such as response rate reports and server uptime can assist in evaluating customer/user experience.
The cloud monitoring market is segmented by the model (IaaS, SaaS, and PaaS), by end-user industry (BFSI, retail, IT and telecommunications, healthcare, government, manufacturing, and other end-user industries), by geography (North America (United States and Canada), Europe (United Kingdom, Germany, France, Spain, and Rest of Europe), Asia-Pacific (China, Japan, Singapore, Australia, and Rest of Asia-Pacific), Latin America (Mexico, Brazil, and Rest of Latin America), and Middle East and Africa (United Arab Emirates, Saudi Arabia, and Rest of Middle East and Africa)).
The market sizes and forecasts are provided in terms of value in USD for all the above segments.
| IaaS |
| PaaS |
| SaaS |
| Solution |
| Services |
| Public Cloud |
| Private Cloud |
| Hybrid/Multi-Cloud |
| SMEs |
| Large Enterprises |
| BFSI |
| Retail and e-Commerce |
| IT and Telecommunications |
| Healthcare and Life Sciences |
| Government and Public Sector |
| Manufacturing |
| Others (Media, Energy, Education) |
| North America | United States |
| Canada | |
| Mexico | |
| South America | Brazil |
| Argentina | |
| Rest of South America | |
| Europe | United Kingdom |
| Germany | |
| France | |
| Spain | |
| Russia | |
| Rest of Europe | |
| Asia Pacific | China |
| Japan | |
| India | |
| South Korea | |
| Rest Asia Pacific | |
| Middle East and Africa | United Arab Emirates |
| Saudi Arabia | |
| South Africa | |
| Rest of Middle East and Africa |
| By Cloud Service Model | IaaS | |
| PaaS | ||
| SaaS | ||
| By Component | Solution | |
| Services | ||
| By Deployment Mode | Public Cloud | |
| Private Cloud | ||
| Hybrid/Multi-Cloud | ||
| By Organisation Size | SMEs | |
| Large Enterprises | ||
| By End-User Industry | BFSI | |
| Retail and e-Commerce | ||
| IT and Telecommunications | ||
| Healthcare and Life Sciences | ||
| Government and Public Sector | ||
| Manufacturing | ||
| Others (Media, Energy, Education) | ||
| By Geography | North America | United States |
| Canada | ||
| Mexico | ||
| South America | Brazil | |
| Argentina | ||
| Rest of South America | ||
| Europe | United Kingdom | |
| Germany | ||
| France | ||
| Spain | ||
| Russia | ||
| Rest of Europe | ||
| Asia Pacific | China | |
| Japan | ||
| India | ||
| South Korea | ||
| Rest Asia Pacific | ||
| Middle East and Africa | United Arab Emirates | |
| Saudi Arabia | ||
| South Africa | ||
| Rest of Middle East and Africa | ||


Key Questions Answered in the Report
What is the projected value of the cloud observability market by 2031?
It is forecast to reach USD 10.95 billion by 2031 based on a 19.56% CAGR.
Which region is growing fastest in cloud observability adoption?
Asia Pacific leads with a 20.85% CAGR, spurred by rapid digital-transformation programs and cloud-first start-ups.
Why are PaaS observability tools gaining traction?
They offer deeper code-level insight and quick integration with platform-engineering workflows, expanding at 28.45% CAGR through 2031.
How does FinOps influence observability spending?
FinOps practices demand granular cost attribution, prompting vendors to add usage-based pricing and optimisation dashboards that align monitoring spend with business value.
What is driving vendor consolidation in this market?
The need to unify security, AI workload monitoring, and compliance features pushes larger vendors to acquire niche specialists, exemplified by Cisco’s Splunk and Datadog’s Metaplane deals.
What challenges limit observability in serverless environments?
Ephemeral runtimes and agentless execution create data blind spots, requiring distributed tracing and eBPF instrumentation to maintain end-to-end visibility.
Page last updated on:


