Cloud Microservices Market Size and Share
Market Overview
| Study Period | 2020 - 2031 |
|---|---|
| Market Size (2026) | USD 2.31 Billion |
| Market Size (2031) | USD 5.38 Billion |
| Growth Rate (2026 - 2031) | 18.42% CAGR |
| Fastest Growing Market | Asia Pacific |
| Largest Market | North America |
| Market Concentration | Medium |
Major Players *Disclaimer: Major Players sorted in no particular order Image © Mordor Intelligence. Reuse requires attribution under CC BY 4.0. | |

Cloud Microservices Market Analysis by Mordor Intelligence
The cloud microservices market size reached USD 2.31 billion in 2026 and is projected to climb to USD 5.38 billion by 2031, reflecting an 18.42% CAGR. Momentum stems from enterprises refactoring monolithic applications into domain-driven services that shorten release cycles and trim operational friction. Financial institutions are dismantling legacy cores into API-first banking modules to satisfy open-banking mandates, while healthcare systems are rolling out FHIR-compliant services to exchange patient data across fragmented records. Platform products held 55.46% revenue share in 2025, yet demand for professional services is expanding faster at 18.88% CAGR as organizations seek integration expertise alongside software tooling. Large enterprises controlled 61.73% share in 2025, but small and medium enterprises are accelerating adoption at 20.53% CAGR because managed Kubernetes offerings lower the entry barrier. Public cloud captured 57.92% of 2025 spending, although hybrid and multi-cloud deployments are advancing at 20.08% CAGR as firms hedge vendor lock-in and manage egress fees that can top 10% of total cloud outlay. Regionally, North America led with 41.33% share in 2025, supported by hyperscaler density and mature DevOps talent, while Asia-Pacific is set to grow fastest at 22.12% CAGR on the back of sovereign-cloud policies in China and India’s digital-public-infrastructure programs. Competition remains fragmented: hyperscalers dominate platform revenue, niche vendors such as Kong and HashiCorp lead service-mesh and secrets-management niches, and 96% of enterprises were using or evaluating Kubernetes in 2025, up from 88% in 2024.
Key Report Takeaways
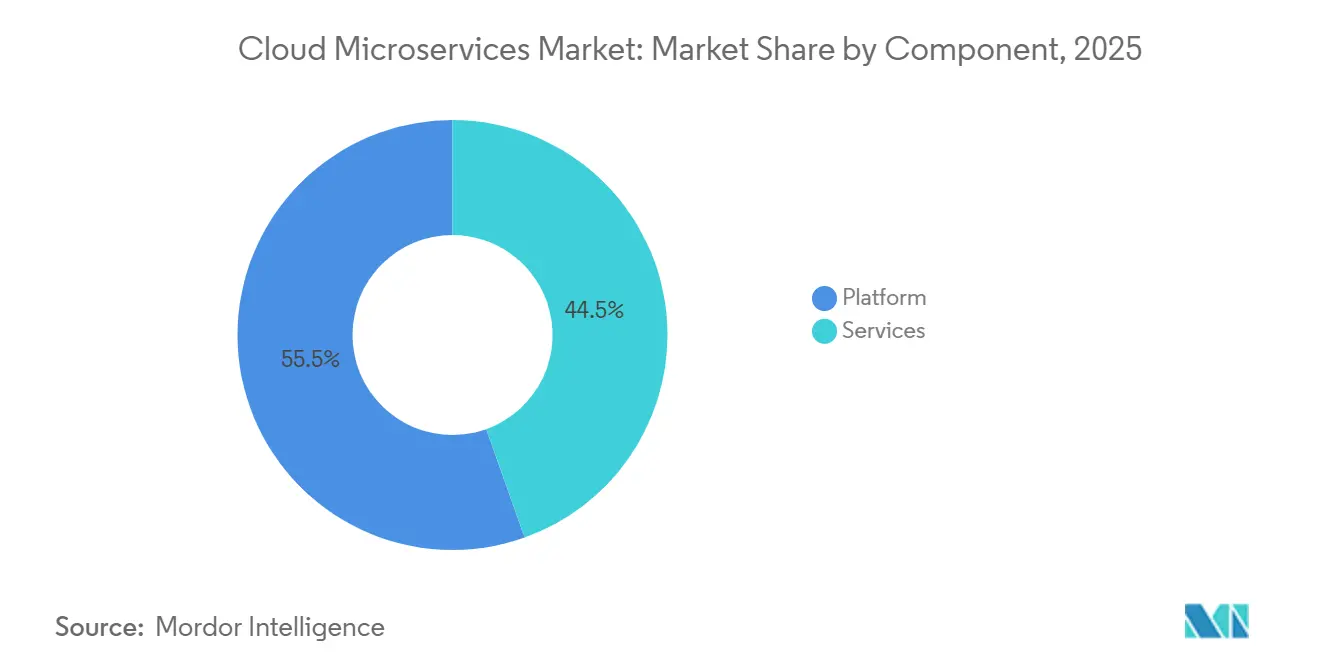
- By component, platform offerings accounted for 55.46% revenue share in 2025; services are forecast to expand at 18.88% CAGR through 2031.
- By enterprise size, large enterprises held 61.73% share in 2025; small and medium enterprises are projected to grow at 20.53% CAGR to 2031.
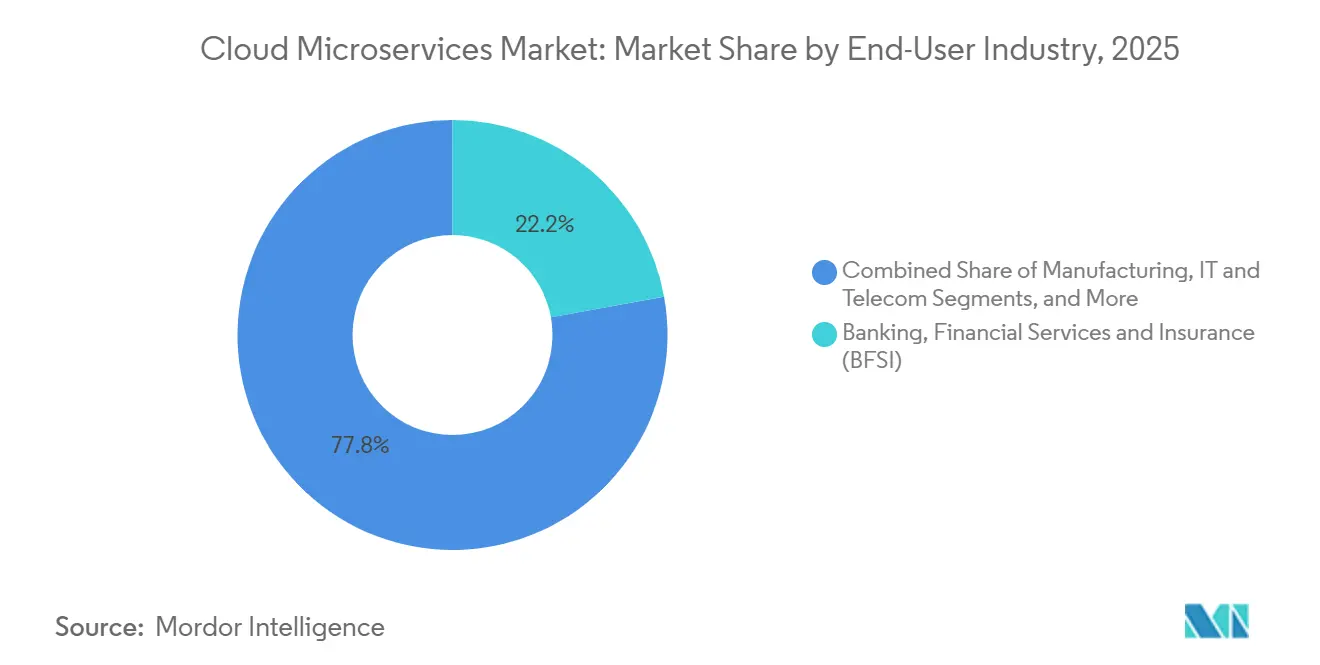
- By end-user industry, banking, financial services and insurance led with 22.16% share in 2025; healthcare and life sciences are expected to rise at 21.65% CAGR during the forecast period.
- By cloud type, public cloud deployments represented 57.92% share in 2025; hybrid and multi-cloud architectures are anticipated to increase at 20.08% CAGR through 2031.
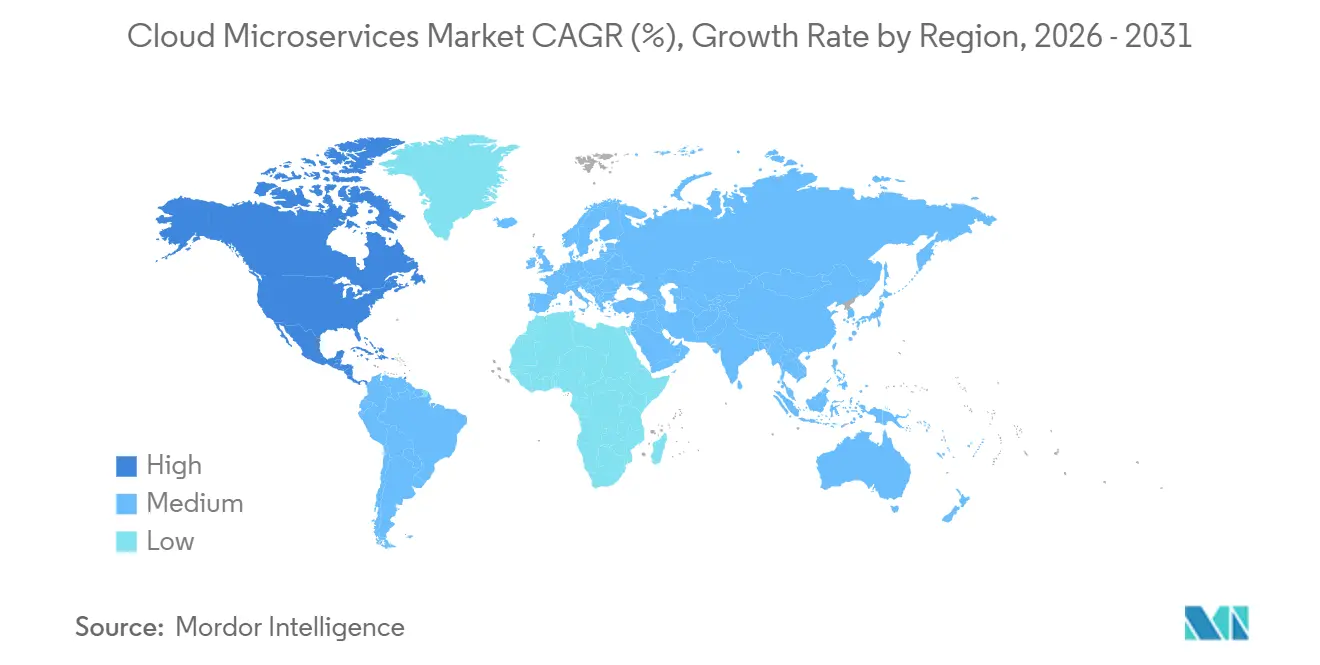
- By geography, North America commanded 41.33% share in 2025; Asia-Pacific is poised to register the fastest growth at 22.12% CAGR to 2031.
Note: Market size and forecast figures in this report are generated using Mordor Intelligence’s proprietary estimation framework, updated with the latest available data and insights as of January 2026.
Global Cloud Microservices Market Trends and Insights
Drivers Impact Analysis*
| Driver | (~)% Impact on CAGR Forecast | Geographic Relevance | Impact Timeline |
|---|---|---|---|
| Rapid Proliferation of Microservices-first Application Design Among Digital-native Firms | +3.2% | Global, with concentration in North America and Asia-Pacific | Short term (≤ 2 years) |
| Rising Enterprise Transition from Monolith to Domain-driven Design for Faster Release Cycles | +4.1% | Global, particularly Europe and North America | Medium term (2-4 years) |
| Mainstream Adoption of Kubernetes-based Service Mesh Accelerators | +3.8% | Global, led by North America, Europe, and Asia-Pacific core markets | Medium term (2-4 years) |
| Cloud-provider Managed Microservices Platforms Lowering Total Cost of Ownership | +3.5% | Global, with strong uptake in North America, Europe, and emerging Asia-Pacific | Short term (≤ 2 years) |
| Edge-native Microservices for Low-latency IoT Workloads | +1.9% | Asia-Pacific manufacturing hubs, North America industrial corridors | Long term (≥ 4 years) |
| Industry-specific Microservices Blueprints Driving Vertical Uptake | +1.7% | Global, concentrated in BFSI and healthcare verticals | Medium term (2-4 years) |
| Source: Mordor Intelligence | |||
Rising Enterprise Transition From Monolith To Domain-Driven Design For Faster Release Cycles
Large organizations are segmenting monolithic codebases into bounded contexts that mirror business capabilities, which reduces coordination overhead and permits independent releases. A European retail bank disclosed that microservices migration cut deployment lead time from six weeks to three days, allowing rapid product launches tied to interest-rate shifts. Manufacturing firms have applied the same pattern to production scheduling so shop-floor changes no longer require multi-department coordination. Red Hat’s 2025 survey showed 68% of IT leaders viewing microservices as critical for continuous delivery, up from 54% in 2024. These gains come with upfront costs, because teams must agree on service boundaries and enforce consistent API contracts.
Mainstream Adoption Of Kubernetes-Based Service Mesh Accelerators
Service meshes now package mTLS, traffic shaping and tracing into a reusable control plane that lifts operational burdens from developers. Google Cloud added automatic sidecar injection to Traffic Director in March 2025, removing manual YAML edits that once deterred adoption. Financial institutions are relying on meshes to meet zero-trust mandates embedded in the Digital Operational Resilience Act. The Linux Foundation found that 58% of enterprises running more than 50 services had a mesh in production in 2025, versus 41% a year earlier. Centralizing policy enforcement reduces configuration drift and improves incident response, which supports the broader growth of the cloud microservices market.
Cloud-Provider Managed Microservices Platforms Lowering Total Cost Of Ownership
Hyperscalers now bundle orchestration, serverless compute and observability into single offerings, trimming the need for internal site-reliability teams. Microsoft said Azure Container Apps revenue rose 140% year-over-year in fiscal 2025, fueled by migrations away from self-managed clusters.[1]Microsoft Investor Relations. “Fiscal 2025 Earnings Call Transcript.” July 2025. microsoft.com A 451 Research study estimated that managed Kubernetes cuts operating expenses by up to 40%, mostly through labor savings. These savings are attracting cost-sensitive adopters in Europe and emerging Asia-Pacific. The trade-off is reduced configurability, yet providers are steadily opening advanced networking and security controls to close that gap.
Rapid Proliferation Of Microservices-First Application Design Among Digital-Native Firms
Start-ups are embedding microservices principles from day one, avoiding the technical debt that plagues legacy stacks. Stripe runs hundreds of discrete services for authorization, settlement and dispute resolution, enabling multiple production deployments daily without downtime. E-commerce platforms break catalogs into product, inventory and pricing services so each can scale independently during peak events. The Cloud Native Computing Foundation reported that 71% of firms with fewer than 500 employees ran microservices in production in 2025, up 12 points from 2024. Faster A/B testing and shorter feedback loops accelerate product iteration, reinforcing competitive advantage for digital natives.
Restraints Impact Analysis*
| Restraint | (~)% Impact on CAGR Forecast | Geographic Relevance | Impact Timeline |
|---|---|---|---|
| Service-to-service Security, Observability and Data Sprawl Complexities | -2.8% | Global, particularly acute in regulated industries across North America and Europe | Short term (≤ 2 years) |
| Skills Gap in Distributed Systems Engineering | -2.4% | Global, most severe in emerging markets and mid-tier cities | Medium term (2-4 years) |
| Rising Egress Costs in Multi-cloud Service Meshes | -1.3% | Global, with concentration in multi-cloud deployments across North America and Europe | Medium term (2-4 years) |
| Regulatory Uncertainty Over Cross-border Micro-transactions APIs | -0.9% | Europe, Asia-Pacific, and cross-border financial services | Long term (≥ 4 years) |
| Source: Mordor Intelligence | |||
Service-To-Service Security, Observability And Data Sprawl Complexities
Each microservice introduces new east-west traffic paths that must be authenticated, authorized and encrypted. The Cloud Security Alliance found that 64% of organizations suffered at least one incident tied to misconfigured inter-service authentication in 2025.[2]Cloud Security Alliance. “Cloud Security Incidents: 2025 Survey Results.” March 2025. cloudsecurityalliance.org Tool sprawl worsens visibility because separate platforms collect logs, metrics and traces, hindering root-cause analysis. Only 38% of firms achieved unified observability across all services, according to the OpenTelemetry 2025 survey. Data replicas cached for latency reasons further complicate compliance with residency rules, especially for cloud microservices market vendors serving regulated sectors such as healthcare and finance.
Skills Gap In Distributed Systems Engineering
Microservices demand expertise in eventual consistency and compensating transactions, skills still rare in the labor market. The Linux Foundation reported that 72% of hiring managers labeled distributed-systems engineering the toughest role to fill in 2025, with median time-to-hire surpassing 90 days in North America. Fewer than 30% of U.S. computer-science programs include coursework on container orchestration or service-mesh design, the Association for Computing Machinery noted in its 2025 curriculum review. Small and medium enterprises struggle most because they cannot match hyperscaler salaries, forcing reliance on external integrators. Emerging markets face an even deeper shortfall as adoption outpaces talent development, which slows broader growth of the cloud microservices market.
*Our forecasts treat driver/restraint impacts as directional, not additive. The impact forecasts reflect baseline growth, mix effects, and variable interactions.
Segment Analysis
By Component: Platforms Underpin Revenue While Services Monetize Complexity
Platform products accounted for 55.46% of 2025 revenue, underscoring their role as the control plane for container orchestration, API management and serverless execution within the cloud microservices market. Kubernetes distributions from Red Hat, VMware and Rancher enforce workload scheduling and resource quotas, while gateways from Kong, MuleSoft and Apigee manage routing and throttling. The cloud microservices market size for platforms is anchored by subscription models that produce sticky recurring revenue and high switching costs. Services, which cover consulting, implementation and managed operations, are projected to rise at an 18.88% CAGR to 2031 as organizations seek help in decomposing monoliths and governing new service boundaries.
The services line benefits from outcome-based pricing and from the emergence of providers that shoulder day-to-day site-reliability tasks. Tata Consultancy Services reported 34% year-over-year growth in cloud-native application engagements during fiscal 2025.[3]Tata Consultancy Services. “Cloud-Native Application Services Growth Detailed in Fiscal 2025 Results.” April 2025. tcs.com Platform vendors are bundling advisory and support offerings, blurring the divide between license and services income. Despite faster growth, services remain more exposed to economic cycles than platforms, yet long-term contracts tied to uptime and service-level objectives are improving predictability. Together, the two segments reinforce the structural expansion of the cloud microservices market by matching software capabilities with hands-on expertise.


By Enterprise Size: Managed Platforms Unlock Small-Firm Uptake
Large organizations held 61.73% share in 2025, reflecting deep budgets and access to specialized engineering talent needed to run hundreds of services across multiple clouds. They deploy advanced observability and policy-driven security, which further enlarges the cloud microservices market. Small and medium enterprises are forecast to expand at a 20.53% CAGR through 2031 because managed Kubernetes and serverless offerings remove the need for in-house cluster operations.
Services such as AWS Elastic Container Service and Google Cloud Run automate scaling and patching, giving SMEs parity with larger rivals on deployment cadence. A study by the U.S. Small Business Administration found that cloud-native SMEs launched new features 40% faster than peers on traditional hosting. Barriers persist, including limited budgets for observability and higher exposure to egress fees, which can reach 15% of total cloud spend for multi-region designs. Open-source lightweight distributions like K3s appeal to cost-conscious firms but require more hands-on skills, revealing a spectrum of trade-offs that continue to shape cloud microservices market adoption patterns.
By End-User Industry: Healthcare Leads Growth on Data-Sharing Rules
Banking, financial services and insurance captured 22.16% of 2025 revenue as open-banking regulations forced institutions to expose account and payment APIs. The segment illustrates how compliance mandates can expand the cloud microservices market share. Healthcare and life sciences are expected to grow fastest at 21.65% CAGR between 2026 and 2031 because Fast Healthcare Interoperability Resources standards require fine-grained patient-data exchange. The cloud microservices industry sees hospitals unbundling electronic-record modules into discrete services that scale independently and support real-time analytics.
Retail and e-commerce platforms split checkout, tax and shipping code into separate services to handle Black Friday surges without over-provisioning the entire stack. Manufacturers run edge-native workloads near factory equipment to crunch sensor readings for predictive maintenance, while telecom operators containerize network functions to enable dynamic 5G scaling. Public-sector agencies are modernizing citizen-facing systems, and fourteen U.S. federal departments had shifted at least one mission-critical workload to microservices by 2025. Each vertical exemplifies distinct drivers yet all reinforce the broader expansion of the cloud microservices market.

By Cloud Type: Hybrid Designs Mitigate Lock-In and Compliance Risk
Public cloud deployments represented 57.92% of 2025 spending because hyperscaler elasticity fits variable workloads such as API gateways. The cloud microservices market size for hybrid and multi-cloud models is poised to expand at 20.08% CAGR through 2031 as enterprises diversify providers to avoid lock-in and to place sensitive data in specific geographies.
Private cloud remains vital in healthcare and finance, where data sovereignty rules dictate on-premises control. VMware found that 44% of Kubernetes users operated on-premises expressly for compliance needs. Hybrid architectures introduce networking and observability complexity, prompting adoption of meshes like Istio and Consul to enforce uniform policy. Edge nodes add another layer, housing latency-sensitive microservices for autonomous vehicles and augmented-reality feeds. Taken together, the deployment mix cements multi-environment expertise as a core capability within the cloud microservices market.
Geography Analysis
North America generated 41.33% of 2025 revenue, supported by dense hyperscaler footprints and experienced DevOps labor pools. Federal agencies allotted USD 8.2 billion to cloud modernization and required microservices architectures in new digital projects, which fortified regional demand. Canada saw momentum from digital banking upgrades, and Mexico leveraged microservices for near-shoring supply-chain visibility. Close proximity to vendor headquarters once gave early access to emerging features, yet that advantage is narrowing as global regions mature.
Asia-Pacific is projected to advance at a 22.12% CAGR through 2031, the highest regional pace in the cloud microservices market. India’s Unified Payments Interface handles more than 10 billion monthly transactions on a microservices foundation, while China promotes indigenous Kubernetes distributions to meet data-localization law. Start-ups in Indonesia and Vietnam deploy microservices from inception, bypassing legacy constraints. Talent shortages and fragmented regulations pose headwinds, but sovereign-cloud mandates and 5G rollouts sustain long-run growth.
Europe adopts microservices under the rigor of the General Data Protection Regulation and the Digital Operational Resilience Act, driving interest in private and hybrid clouds tied to the Gaia-X framework. Germany, the United Kingdom and France spearhead spending, especially across automotive and banking. South America lags but gains traction as Brazilian banks unbundle cores for open-banking compliance, while Argentina pilots microservices in digital wallets. In the Middle East and Africa, Saudi Arabia and the United Arab Emirates enforce cloud-first policies to diversify economies, and Nigerian fintech firms leverage microservices to extend mobile money reach despite bandwidth constraints. Each region contributes distinct regulations and infrastructure profiles that collectively enlarge the global cloud microservices market.

Regulatory Landscape
Cloud microservices deployments increasingly fall under cloud-security and digital-sovereignty requirements that shape architecture choices such as workload isolation, auditability, and portability across providers. In the European Union, the Data Act (Regulation (EU) 2023/2854) entered into force in September 2025 and includes cloud switching and interoperability obligations for data processing services. This increases the focus on standardized APIs, exit tooling, and multi-cloud operability for microservices platforms and service meshes.
In 2026, government-driven cloud security baselining and continuous monitoring tightened for regulated and public-sector buyers. The United States issued National Security Presidential Memorandum NSPM-12 in June 2026, directing the Committee on National Security Systems (CNSS) to define secure cloud configuration baselines for National Security Systems. NIST published SP 800-172 Revision 3 in May 2026, with enhanced security requirements for protecting Controlled Unclassified Information in nonfederal systems. FedRAMP also advanced 2026 monitoring and cloud-native security indicator requirements, and a June 2026 GAO performance audit increased scrutiny of agency cloud security practices, reinforcing demand for demonstrable controls across microservice-to-microservice traffic, identity, and runtime policy enforcement.
Value Chain Analysis
The value chain for cloud microservices spans infrastructure and virtualization primitives (IaaS, hardware and data center networks), cloud-native execution layers (managed Kubernetes, serverless containers, microVM-based isolation), and control-plane software that makes distributed services operable (service mesh, API gateways, secrets management, CI/CD and observability). Hyperscalers and major platform vendors monetize the platform layer through managed offerings, while ecosystem projects under bodies such as the Cloud Native Computing Foundation help standardize portability across clouds and on-premises footprints.
Downstream, global system integrators and managed service providers convert platform capabilities into production outcomes through application modernization, domain-driven decomposition, and ongoing SRE operations, especially in regulated industries. Recent supply-side moves show how the chain is adapting to security, latency, and multi-environment requirements: AWS introduced Lambda MicroVMs in June 2026 for VM-level isolation within serverless execution, and added zone-aware routing to Amazon ECS Service Connect in July 2026 to reduce cross-zone costs and latency in service-to-service traffic. Partnerships are also tightening the services-to-platform loop, including IBM and Google Cloud establishing a new Google Cloud practice (June 2026) and Rackspace Technology and Palantir launching an operating framework for regulated enterprises across private cloud, sovereign cloud, and on-premises environments (July 2026).
Competitive Landscape
The cloud microservices market remains moderately fragmented. Amazon Web Services, Microsoft and Google capture about 60% of managed-container and serverless revenue by bundling compute, storage and networking with global availability. Mid-tier specialists such as Kong, HashiCorp and Solo.io command niches in service mesh, secrets management and API security, differentiating on portability and performance. Vendor-neutral bodies like the Cloud Native Computing Foundation accelerate parity by shepherding open-source standards that all providers must support.
Strategic behavior spans vertical integration and horizontal specialization. IBM’s acquisition of Apptio bolstered its Red Hat OpenShift stack with cost-optimization analytics, while Oracle added confidential-computing enclaves to its Kubernetes engine to court regulated workloads. Edge-native microservices for industrial IoT and WebAssembly runtimes for faster cold-starts mark emerging white spaces. Technology innovation is central, evidenced by a 2025 Google patent that applies machine learning to predict service failures from telemetry streams. Overall, competitive intensity is anchored in feature depth, ecosystem breadth and the ability to reduce operational toil for buyers of cloud microservices market offerings.
Cloud Microservices Industry Leaders
Amazon Web Services Inc.
Microsoft Corporation
IBM Corporation
Salesforce.com Inc.
Google LLC
- *Disclaimer: Major Players sorted in no particular order


Market Opportunities and Future Outlook
Security, identity, and API governance create clear whitespace for platforms and services that simplify compliance across large microservices estates. NIST updated Guidelines for API Protection for Cloud-Native Systems in March 2026, focusing on risk-based API controls and runtime protections that map to gateway policy, service-to-service authorization, and observability requirements. In parallel, the IETF Workload Identity (WIMSE) architecture work points to buyer demand for standardized ways to convey workload identity and security context across heterogeneous clusters and clouds, supporting products and managed offerings that package identity, policy, and telemetry into repeatable reference implementations.
Standardization and platform engineering practices also open spend for interoperable architectures and vendor-neutral operating models across public, private, and sovereign environments. EN ISO/IEC 22123-3:2026 (Cloud Computing Reference Architecture) provides shared terminology for roles and interoperability, supporting procurement and audit discussions for enterprises decomposing monoliths into microservices. CNCF reporting in Q1 2026 indicates platform engineering has become mainstream for many teams (88% of backend developers using standardized DevOps and platform engineering environments), raising the bar for integrated developer experience across build, deploy, policy, and incident response. As agentic workflows rise, CNCF discussions on cloud-native agentic standards point to demand for microservices platforms that can provide standardized interoperability, security, and observability for high-volume, tool-calling services, which in turn reinforces opportunities in managed service mesh, workflow orchestration, and policy automation offerings.
Recent Industry Developments
- July 2026: Amazon Web Services expanded AWS Security Hub to support Microsoft Azure environments, adding cross-cloud posture visibility and centralized monitoring for vulnerabilities across workloads. This supports multi-cloud governance for enterprises running microservices across competing clouds and reduces the operational friction of managing separate security consoles.
- June 2026: Amazon Web Services introduced AWS Lambda MicroVMs, adding VM-level isolation and state preservation as a serverless compute option suited to running untrusted or AI-generated code. Stronger isolation at the execution layer supports microservices teams that need tighter runtime controls without adopting fully self-managed Kubernetes footprints.
- December 2025: Microsoft released Azure Container Apps with integrated Dapr runtime, adding built-in workflow orchestration and state management. The deeper runtime integration reduces the amount of custom plumbing needed to build and operate microservices, increasing the appeal of managed platforms for teams modernizing monolithic applications.


Research Methodology Framework and Report Scope
Market Definition and Coverage
For this study, the cloud microservices market is defined as revenue earned from cloud delivered microservices platforms and related services that help design, deploy, integrate, and operate applications built as small independent services.
Scope exclusions: Pure on premises microservices software and non cloud application development work that is not tied to microservices delivery are not counted.
Segmentation Overview
- By Component
- Platform
- Services
- By Enterprise Size
- Small and Medium Enterprises (SMEs)
- Large Enterprises
- By End-User Industry
- Banking, Financial Services and Insurance (BFSI)
- Retail and E-commerce
- Manufacturing
- IT and Telecom
- Healthcare and Life Sciences
- Government and Public Sector
- Other End-User Industries
- By Cloud Type
- Public Cloud
- Private Cloud
- Hybrid and Multi-Cloud
- By Geography
- North America
- United States
- Canada
- Mexico
- South America
- Brazil
- Argentina
- Rest of South America
- Europe
- Germany
- United Kingdom
- France
- Italy
- Spain
- Rest of Europe
- Asia-Pacific
- China
- Japan
- India
- South Korea
- ASEAN
- Rest of Asia-Pacific
- Middle East
- Saudi Arabia
- United Arab Emirates
- Rest of Middle East
- Africa
- South Africa
- Nigeria
- Rest of Africa
- North America
Data Sources, Market Sizing, and Validation
Desk Research
Desk work starts by mapping what buyers typically purchase when they move to microservices on cloud, and where that spend sits inside broader cloud budgets. We review public sources such as NIST publications on cloud concepts, the US Bureau of Labor Statistics for developer and IT labor signals, OECD digital economy indicators, and ITU connectivity statistics to understand demand basics and delivery constraints.
We also refer to sources such as company annual reports, earnings call transcripts, investor presentations, reputable tech press coverage, and relevant peer reviewed articles to spot shifts in adoption patterns (for example, containerization, API use, and managed cloud services reliance). Where needed, we use paid subscriptions for company financials and intelligence, news and financials, and patent databases to validate business lines and time the ramp of new offerings. These desk research sources are illustrative only, and many other public references were also used for data collection, validation, and clarification.
Primary Interviews and Surveys
Primary work is used to pressure test assumptions that desk sources cannot fully confirm, such as how microservices spend is split between platform and services, and how this varies by cloud type and enterprise size. We speak with supply side and demand side experts across APAC, EMEA, and the Americas so adoption timing, pricing movement, and procurement behavior are grounded in what teams are actually buying and renewing.
Distribution of primary research fieldwork respondents
| Company type | Respondent position | Region |
|---|---|---|
| Top tier: 28% | CXOs: 13% | APAC: 40% |
| Mid tier: 57% | Functional/Unit leaders: 42% | EMEA: 36% |
| Smaller Players: 15% | Managers: 45% | Americas: 24% |
Market-Sizing & Forecasting
Sizing is built using top-down and bottom-up logic, where cloud adoption indicators and enterprise application modernization activity are first converted into a realistic addressable spend pool, and then checked through sampled vendor pricing and volume signals. In practice, the top-down side uses a demand-pool build that is aligned to platform plus services revenue linked to cloud microservices, which is then reconciled with selective supplier roll ups and channel checks so totals do not drift.
Key inputs used in the model include the pace of cloud migration and modernization programs, the share of application development shifting to microservices, container and orchestration adoption as a readiness signal, services attach rates for integration and operations work, and average contract value movement by enterprise size. When gaps show up in bottom-up approximations (for example, limited disclosure for private firms), we bridge using peer group benchmarks and confirmed price bands before rolling up to region totals.
Forecasting is done using scenario analysis supported by a light multivariate regression on leading indicators like cloud spending growth, hiring demand for cloud native roles, and macro IT budget sentiment. Assumptions are rechecked with interview feedback so the forecast reflects expected adoption speed in public, private, and hybrid or multi-cloud environments.
Data Validation & Update Cycle
Validation is handled through repeated cross checks between the model output and independent market signals, such as whether implied spending per adopting enterprise stays within interview confirmed ranges. Large variances are flagged, and the underlying drivers are reviewed, which often leads to rechecking currency conversions, timing of contract recognition, or the split between platform and services.
Before sign-off, the work goes through multi step internal review so assumptions, math, and year alignment are consistent across geographies and end user industries. The report is refreshed annually, and interim updates are made when material events occur that can shift pricing, adoption, or cloud delivery patterns. Right before delivery, a final pass is completed so clients receive an up to date view based on the latest available inputs.
Mordor Intelligence's Cloud Microservices Market Size Versus Other Published Estimates
Published market values for cloud microservices can look different even when the topic name is the same, because the inclusion rules and the timing of the measured year are not always aligned. Differences also show up when firms rely on broader cloud spending proxies without confirming how much of that spend is truly microservices platform and related services.
The biggest gap drivers in this market usually come from what gets counted as microservices revenue, how platform versus services are treated, and whether hybrid or multi-cloud workloads are fully included. Other common causes are the choice of base year, the way average contract value is projected forward, and whether the model is refreshed after major changes in cloud pricing or enterprise adoption cycles.
Benchmark comparison
| Source | Market Size | Gaps in Research Methodology |
|---|---|---|
| Mordor Intelligence | USD 2.31 B (2026) | |
| Global Consultancy A | USD 2.33 B (2025) | Uses a different base year and tends to blend broader microservices software activity with cloud specific revenue, which can shift totals when services and platform lines are not separated cleanly. |
| Industry Publisher B | USD 2.21 B (2025) | Reports a prior year value and may apply more conservative contract value progression, which lowers the near term number when renewals and services attach rates are assumed to rise slowly. |
The table shows a spread that is mainly explained by year alignment and what is included in the counted revenue, and in Mordor Intelligence's model the value is tied to cloud delivered microservices platform plus related services, which avoids folding in non cloud microservices work. Once scope and year are lined up, the remaining differences usually come from pricing progression and how quickly adoption is assumed to expand across enterprise sizes. This approach keeps the result traceable to a few clear inputs that can be rechecked during updates.


Key Questions Answered in the Report
How fast will the cloud microservices market grow between 2026 and 2031?
The market is projected to expand at an 18.42% CAGR, rising from USD 2.31 billion in 2026 to USD 5.38 billion by 2031.
Which segment is expected to post the highest growth rate?
Services, which include consulting, implementation and managed operations, are forecast to rise at 18.88% CAGR as firms look for external expertise.
Why are hybrid and multi-cloud deployments gaining momentum?
Enterprises seek to avoid lock-in, comply with residency laws and trim costs by distributing workloads across providers, driving a 20.08% CAGR for hybrid and multi-cloud architectures.
Which region will lead future revenue gains?
Asia-Pacific is set to record the fastest growth, with a 22.12% CAGR through 2031, backed by sovereign-cloud mandates and large-scale digital-payments systems.
What is the main challenge limiting adoption?
A shortage of distributed-systems engineers and the complexity of securing and observing hundreds of inter-service communications slow broader rollout.
Page last updated on:


