
Cloud Access Security Brokers Market Size and Share
Market Overview
| Study Period | 2020 - 2031 |
|---|---|
| Market Size (2026) | USD 13.12 Billion |
| Market Size (2031) | USD 30.27 Billion |
| Growth Rate (2026 - 2031) | 18.21 % |
| Fastest Growing Market | Asia-Pacific |
| Largest Market | North America |
| Market Concentration | Medium |
Major Players *Disclaimer: Major Players sorted in no particular order Image © Mordor Intelligence. Reuse requires attribution under CC BY 4.0. | |
Cloud Access Security Brokers Market Analysis by Mordor Intelligence
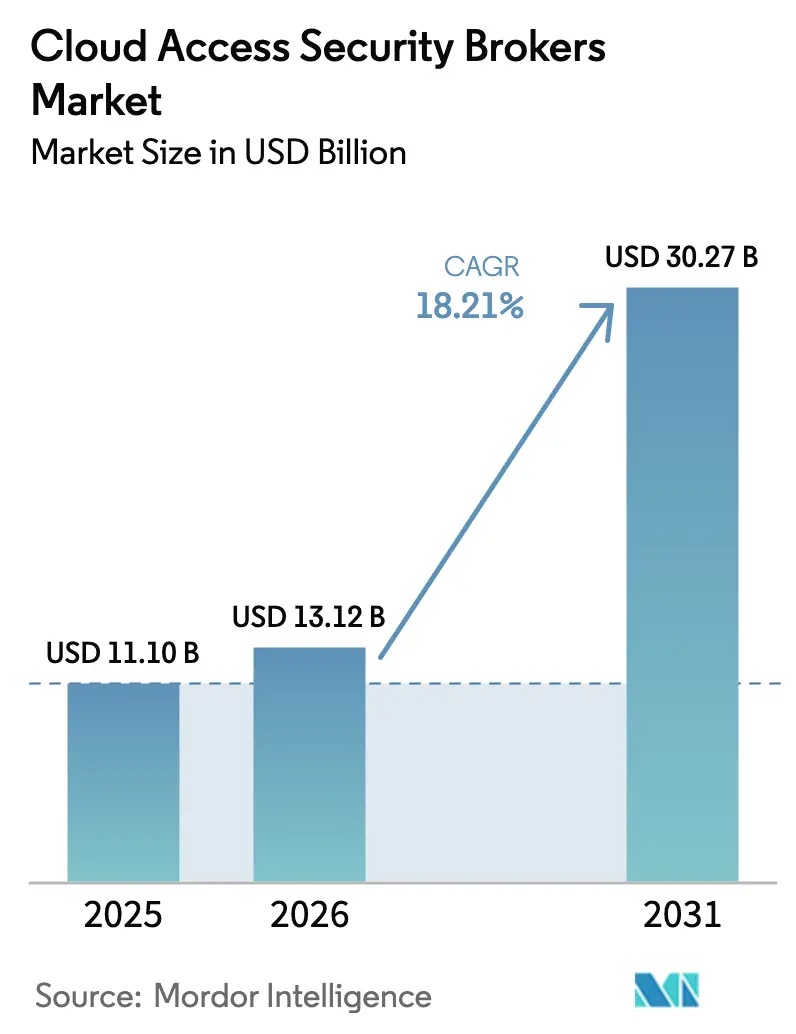
The Cloud Access Security Brokers market size is expected to grow from USD 11.10 billion in 2025 to USD 13.12 billion in 2026 and is forecast to reach USD 30.27 billion by 2031 at 18.21% CAGR over 2026-2031.
Enterprises are moving away from perimeter-centric defenses as the EU NIS2 directive and US Executive Order 14144 enforce Zero Trust requirements, while the adoption of generative AI elevates data governance risk. Vendors now build CASB functionality directly into secure access service edge (SASE) platforms, positioning the Cloud Access Security Brokers market as a core layer in holistic security stacks rather than an adjunct toolset. Growth also stems from higher cyber-insurance premiums that reward organizations able to document continuous cloud controls, as well as API-first integrations that simplify coverage of SaaS, IaaS, and PaaS estates. While Software-as-a-Service (SaaS) protection still dominates revenue, the accelerating shift of production workloads to cloud infrastructure signals a decisive pivot toward securing multicloud environments at scale. Intensifying competition, marked by acquisitions such as Zscaler–Avalor and CrowdStrike–Flow Security, is consolidating capabilities around data security posture management and generative-AI governance.
Key Report Takeaways
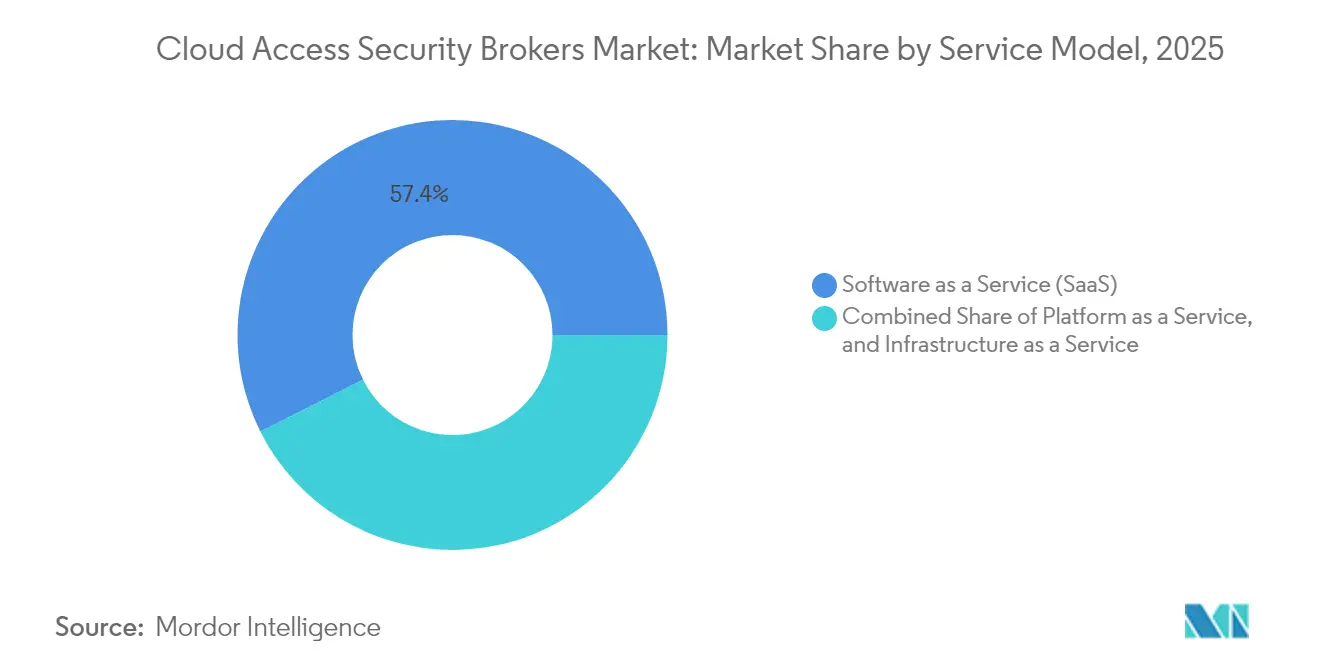
- By service model, SaaS protection led with a 57.40% revenue share of the Cloud Access Security Brokers market in 2025, whereas IaaS security is projected to rise at a 19.85% CAGR through 2031.
- By organization size, large enterprises held 62.30% of the market share in 2025, while small and medium enterprises recorded the fastest growth at an 17.65% CAGR to 2031.
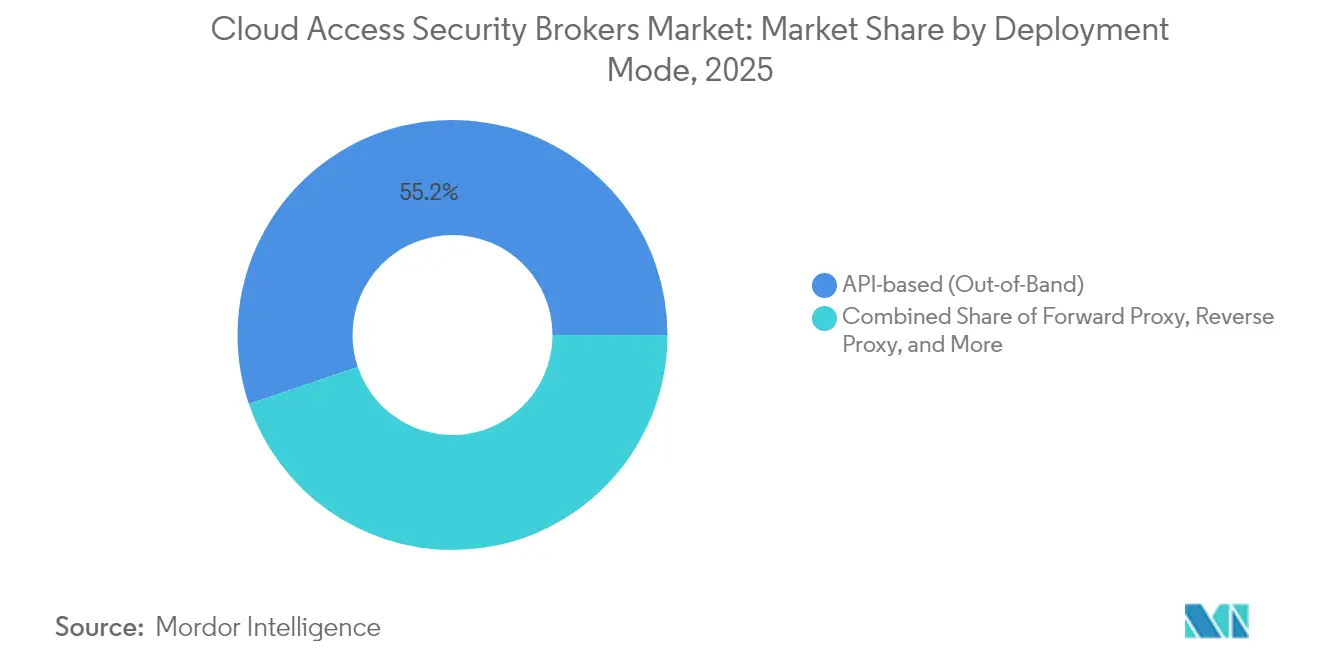
- By deployment mode, API-based implementations accounted for 55.20% of the Cloud Access Security Brokers market size in 2025, and multimode hybrid deployments are forecast to expand at a 21.75% CAGR.
- By end-user, banking, financial services, and insurance captured 21.60% of 2025 revenue, whereas manufacturing is on course for a 20.45% CAGR through 2031.
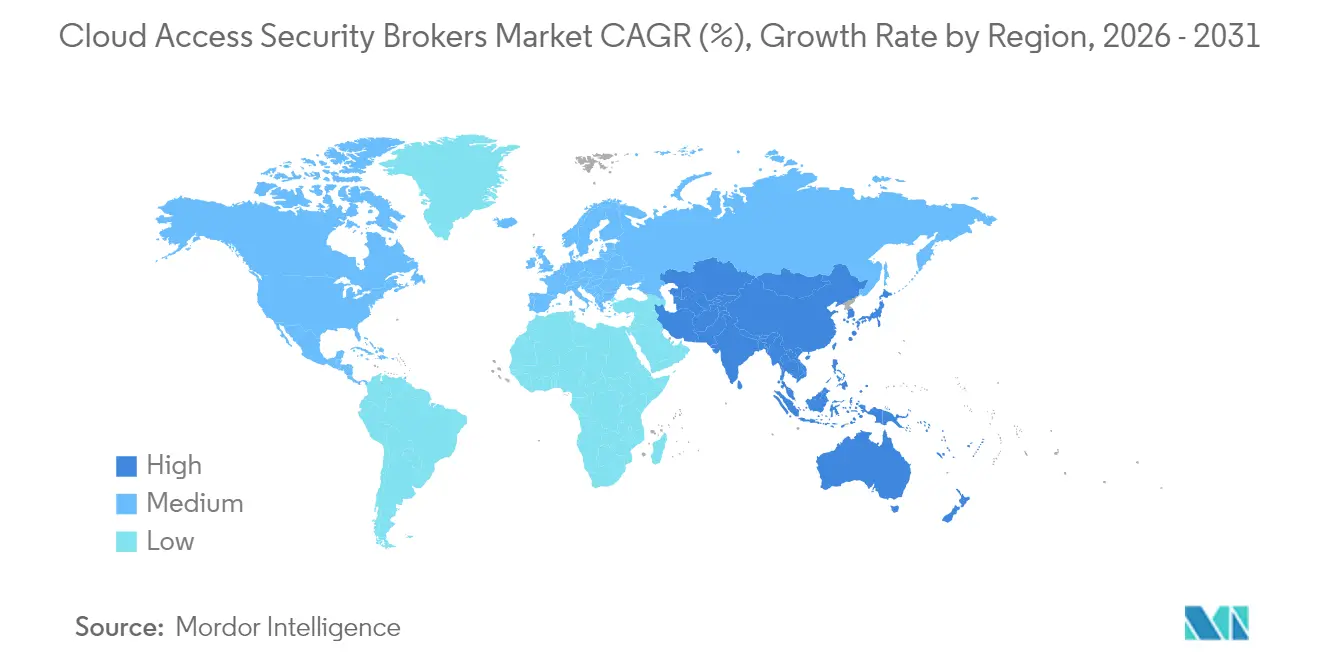
- By geography, North America contributed 36.60% of 2025 revenue, but Asia Pacific is set to post the highest regional CAGR at 19.15% to 2031.
Note: Market size and forecast figures in this report are generated using Mordor Intelligence’s proprietary estimation framework, updated with the latest available data and insights as of 2026.
Market Trends and Insights
Drivers Impact Analysis of Cloud Access Security Brokers Market*
| Driver | (~) % Impact on CAGR Forecast | Geographic Relevance | Impact Timeline |
|---|---|---|---|
| Rapid growth of SaaS adoption across verticals | +3.2% | Global, with acceleration in APAC and Latin America | Medium term (2-4 years) |
| Mandates for Zero-Trust and data residency compliance | +4.1% | North America & EU leading, APAC following | Short term (≤ 2 years) |
| Surging API-first CASB integrations inside SASE stacks | +2.8% | Global, concentrated in enterprise segments | Medium term (2-4 years) |
| Higher cyber-insurance premiums driving CASB uptake | +1.9% | North America & EU primarily | Short term (≤ 2 years) |
| Convergence of DSPM with CASB | +2.3% | Global, led by data-intensive industries | Long term (≥ 4 years) |
| Industry-specific pre-trained policy packs | +1.4% | Regulated industries globally | Medium term (2-4 years) |
| Source: Mordor Intelligence | |||
Rapid Growth of SaaS Adoption Across Verticals
Enterprise SaaS footprints now span collaboration, CRM, and low-code development environments, creating visibility gaps that legacy firewalls cannot close. Manufacturers such as Nexteer Automotive deploy inline CASB controls to secure Office 365 workloads while preserving GDPR compliance, demonstrating cross-industry urgency to govern SaaS data flows. Healthcare providers shift electronic health records to multi-cloud designs, demanding granular policy enforcement to meet HIPAA obligations. Financial institutions tighten oversight of third-party SaaS plug-ins, making audit-ready reporting a prerequisite for vendor onboarding. Collectively, these factors heighten baseline demand across the Cloud Access Security Brokers market.
Mandates for Zero-Trust and Data Residency Compliance
Regulators elevate Zero Trust from best practice to an enforced standard. The EU NIS2 directive applies penalties up to EUR 10 million for supply-chain lapses, compelling organisations to install continuous cloud-access controls. Japan’s forthcoming five-level cybersecurity rating further codifies real-time monitoring, and Singapore’s MAS guidance points financial firms toward CASB tooling aligned with identity-centric design. In the United States, Executive Order 14144 obliges federal agencies to verify every cloud request, accelerating public-sector adoption. These overlapping mandates anchor long-term growth across the market.
Surging API-First CASB Integrations Inside SASE Stacks
Unified SASE subscriptions climbed sharply in 2025 as organisations swapped multiple point products for a converged cloud edge model. Fortinet reported USD 1.15 billion in unified-SASE ARR, exemplifying commercial appetite for blended CASB, SWG, and ZTNA functions[1]Fortinet, “Q1 2025 Earnings Release,” fortinet.com. Netskope’s tie-in with OpenAI’s ChatGPT Enterprise Compliance API shows how providers embed data-detection rules for generative-AI workflows. At the platform layer, Cisco’s pending integration of Splunk log analytics positions it to deliver full-stack cloud telemetry through a single console. API-first orchestration, therefore, lifts adoption barriers and sustains momentum for the Cloud Access Security Brokers market.
Higher Cyber-Insurance Premiums Driving CASB Uptake
Underwriters now demand proof of continuous cloud oversight before issuing policies and have raised premiums in line with exposure risk. Firms suffering incidents report average insurance-related budget jumps of 26% and channel funds directly toward CASB roll-outs that supply automated evidence of policy compliance. Banks in particular allocate 12% of IT budgets to security, up from 9.7% in 2020, and reserve sizable allocations for cloud-access governance platforms. As actuarial models mature, insurers explicitly reward organisations that implement CASB-driven data-loss prevention, turning insurance pricing into a structural growth lever for the market.
Restraints Impact Analysis of Cloud Access Security Brokers Market*
| Restraint | (~) % Impact on CAGR Forecast | Geographic Relevance | Impact Timeline |
|---|---|---|---|
| Configuration drift and shadow policies in multi-clouds | -2.1% | Global, acute in large enterprises | Short term (≤ 2 years) |
| High false-positive rates hurting SOC productivity | -1.8% | Global, particularly in resource-constrained organizations | Medium term (2-4 years) |
| Persistent skills gap in cloud-native security | -1.3% | Global, severe in emerging markets | Long term (≥ 4 years) |
| Vendor lock-in fears with single-vendor SASE suites | -0.9% | Enterprise segments globally | Medium term (2-4 years) |
| Source: Mordor Intelligence | |||
Configuration Drift and Shadow Policies in Multi-Clouds
Running parallel policies across AWS, Azure, and Google Cloud increases the odds of misaligned rules that weaken enforcement. Shadow IT compounds exposure as staff adopt unsanctioned SaaS tools, leaving data outside central oversight. Japan’s 2024 security report ranks supply-chain exposures as its second-highest threat, underscoring how third-party clouds widen the attack surface[2]Information-Technology Promotion Agency, “2024 Security Assessment,” ipa.go.jp. Auditors now flag inconsistent data-loss policies during compliance reviews, and security leaders cite drift management as a top barrier to scaling CASB deployments within the Cloud Access Security Brokers market.
High False-Positive Rates Hurting SOC Productivity
SOC teams already battle alert overload; overly aggressive CASB rules can double ticket volumes and mask real-world threats. The Cloud Security Alliance notes a perception gap between vendor claims and operational reality, driving user frustration. Machine-learning engines need constant tuning to adapt to unique behaviour patterns, draining limited human resources. Unless accuracy improves, some buyers delay full-scope projects, moderating near-term growth in the Cloud Access Security Brokers market.
*Our forecasts treat driver/restraint impacts as directional, not additive. The impact forecasts reflect baseline growth, mix effects, and variable interactions.
Cloud Access Security Brokers Market Segment Analysis
By Service Model:
IaaS Acceleration Challenges, SaaS DominanceIaaS protection is tracking a 19.85% CAGR to 2031, whereas SaaS still represented 57.40% of revenue in 2025, reflecting legacy purchase cycles that favoured application-centric monitoring. This divergence indicates that the Cloud Access Security Brokers market size for infrastructure workloads will expand significantly as enterprises harden Kubernetes clusters and serverless functions on public clouds.
The Cloud Access Security Brokers market continues to shift toward platforms that blend CASB, CSPM, and entitlement management so DevOps teams can embed guardrails inside CI/CD pipelines. Cisco’s acquisition of DeepFactor shows large vendors stitching runtime security into their stacks, signaling renewed competition to win the next wave of IaaS-centric deals.



By Organization Size:
SME Cloud-First Strategies Accelerate AdoptionSMEs posted an 17.65% CAGR forecast despite large enterprises retaining 62.30% revenue in 2025, proving cloud delivery can equalise access to enterprise-grade safeguards. Many SMEs leapfrog on-premises tooling and instead subscribe directly to converged SASE offerings that bundle CASB, reducing total ownership cost.
As adoption broadens, the Cloud Access Security Brokers industry must streamline onboarding and offer managed services that offset skills shortages. Success stories such as Grasshopper Bank show how automating compliance testing with cloud-native controls trims 50 hours per partner integration and boosts regulator confidence.
By Deployment Mode:
Hybrid Approaches Gain Enterprise TractionAPI-based detection accounted for 55.20% of 2025 revenue, yet multimode hybrids are expected to climb at a 21.75% CAGR. Enterprises increasingly route high-risk applications through inline proxies for immediate enforcement while retaining API feeds for retrospective analysis. The Cloud Access Security Brokers market share for multimode offerings is therefore likely to close the gap on API-only tools before 2031.
Edge computing and 5G drive further diversification as controls move closer to the user. Fortinet’s FortiSASE inline-CASB demonstrates how distributed enforcement can maintain user experience while upholding uniform policy. Vendors that flexibly orchestrate policy across proxies, APIs, and agents will set the adoption pace.
By End-User:
Manufacturing Digitization Drives Vertical ExpansionBFSI retained 21.60% of 2025 spending, but manufacturing shows the highest momentum with a projected 20.45% CAGR. Factories are modernising supply-chain collaboration platforms and integrating operational technology with cloud analytics, prompting demand for context-aware controls. The Cloud Access Security Brokers market size for industrial users is therefore primed for outsized gains through 2031.
Healthcare remains another priority segment as telehealth growth elevates HIPAA compliance risk. Sentara Healthcare’s partnership with Fortinet underscores a sector-specific focus on patient data sovereignty. Vendors delivering pre-built policy packs for regulated records will strengthen their share in these expanding niches of the Cloud Access Security Brokers market.
Geography Analysis
North America Cloud Access Security Brokers Market
North America held 36.60% of 2025 revenue thanks to mature cloud adoption and well-defined regulatory triggers such as Executive Order 14144, which compels all federal agencies to implement Zero Trust controls by 2025. Public-sector procurement drives early adoption, and Canadian organisations install CASB to handle cross-border data flows under provincial privacy statutes. Mexico’s rising technology investment adds regional demand, particularly among multinationals orchestrating unified policies across NAFTA corridors.
Europe Cloud Access Security Brokers Market
Europe accelerates investment under the dual impetus of NIS2 and GDPR. The Cloud Access Security Brokers market size for EU-based firms is poised to climb as penalties up to EUR 10 million push compliance teams toward automated monitoring. Post-Brexit UK entities fine-tune data-residency rules, while France and Germany seek sovereign cloud alignments that favour providers offering local processing.
APAC Cloud Access Security Brokers Market
Asia Pacific is the fastest-growing theatre at a 19.15% CAGR, fuelled by sovereign-cloud mandates and sweeping digital-transformation agendas. Japan’s Active Cyber Defense Bill and METI’s security rating scheme ratify continuous monitoring as a corporate responsibility. China’s cross-border transfer controls spur adoption of data-classification modules, and India’s expanding fintech ecosystem requires audit-ready cloud access logs. Singapore’s MAS guidelines keep financial hubs at the forefront of Zero Trust implementations, deepening regional contribution to the Cloud Access Security Brokers market.

Regulatory Landscape
Regulatory pressure continues to translate cloud security governance into auditable controls, reinforcing CASB as a compliance layer across SaaS, IaaS, and PaaS access. In Europe, NIS2 and GDPR drive continuous monitoring and data protection expectations, while EU-level work on cloud cybersecurity certification, including EUCS discussions tied to sovereignty and ICT supply-chain risk, is pushing buyers toward vendors and service providers that can demonstrate cloud control coverage.
In 2026, control frameworks and incident reporting requirements further tighten operational expectations for cloud security monitoring. Germany's BSI released C5:2026 as an updated cloud compliance criteria catalogue aligned with EUCS directions, and US public-sector pathways emphasize continuous monitoring through FedRAMP requirements. In critical infrastructure, CIRCIA rulemaking activity (including CISA town halls concluding in June 2026) points to faster, more standardized cyber-incident reporting. That raises the need for consistent cloud access logs, DLP evidence, and policy enforcement, capabilities that CASB platforms and SASE suites commonly support.
Value Chain Analysis
The CASB value chain begins with cloud identity and access signals (IdP, MFA, device posture) and extends through enforcement and visibility layers delivered via API-based (out-of-band) connections and inline proxy modes. API integrations provide discovery, policy evaluation, and historical auditing across SaaS applications, while inline controls support real-time prevention for high-risk sessions, data exfiltration, and sensitive workflow actions. These enforcement modes increasingly map to common control expectations referenced in standards such as NIST SP 800-53 Rev. 5 (including access control and system and communications protection control families).
Upstream dependencies include hyperscalers and SaaS platforms that expose event and configuration APIs, along with network-edge and service-provider fabrics that host inspection points for SASE-delivered CASB. Downstream delivery spans direct enterprise subscriptions and partner-led managed services that bundle CASB with SWG and ZTNA, reflected by managed SASE partnerships in the ecosystem. Product differentiation and integration intensity also rise around governance for generative AI and agentic workflows, where vendors place policy at the boundary between model interactions and business actions (including integrations positioned around agentic AI decision-to-action transitions).
Competitive Landscape
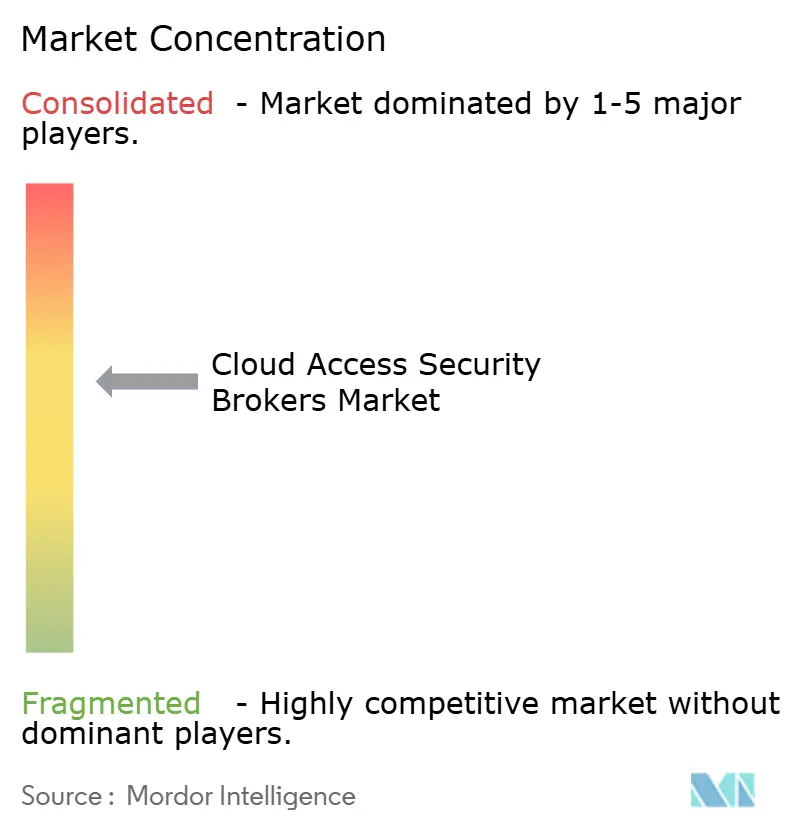
The Cloud Access Security Brokers market remains moderately concentrated. Netskope surpassed USD 500 million in ARR and recently secured an additional USD 401 million debt facility to accelerate SASE rollouts. Palo Alto Networks reported USD 4.5 billion in next-generation security ARR, underscoring the appetite for integrated platforms.
M&A activity soared as legacy network vendors bought cloud-native expertise. Zscaler’s USD 350 million Avalor purchase expands vulnerability analytics, while CrowdStrike’s USD 200 million Flow Security acquisition adds data-flow visibility. Cisco’s multi-billion-dollar bid for Splunk illustrates the premium attached to telemetry unification.
Emerging specialists target white-space niches such as generative-AI policy enforcement and OT data governance. Cyera’s USD 300 million funding round and Cato Networks’ AI-powered shadow-AI dashboard reflect investor conviction in differentiated use cases. Vendors able to meld identity, data, and network layers into a single policy graph are expected to capture outsized growth.
Cloud Access Security Brokers Industry Leaders
Netskope
Imperva
Palo Alto Networks (Prisma Access)
Cloudflare
Cisco (Cloudlock)
- *Disclaimer: Major Players sorted in no particular order
Cloud Access Security Brokers Market Companies Covered in this Report
- Netskope, Inc.
- Microsoft Corporation
- Cisco Systems, Inc.
- Palo Alto Networks, Inc.
- Skyhigh Security (formerly McAfee Enterprise)
- Forcepoint LLC
- Proofpoint, Inc.
- Oracle Corporation
- International Business Machines Corporation
- Broadcom Inc. (Symantec Enterprise Division)
- Check Point Software Technologies Ltd.
- Trend Micro Incorporated
- Lookout, Inc.
- Imperva, Inc.
- Zscaler, Inc.
- Cloudflare, Inc.
- CyberArk Software Ltd.
- Rapid7, Inc.
- Akamai Technologies, Inc.
- Trellix (formerly FireEye and McAfee Enterprise)

Market Opportunities and Future Outlook
Generative-AI governance has emerged as a specific whitespace where CASB expands beyond traditional SaaS DLP into runtime controls for prompts, responses, and tool actions. In July 2026, Palo Alto Networks announced general availability of Prisma AIRS AI Gateway to provide a unified control plane for LLMs, agents, and MCP calls, while Netskope highlighted AI guardrails and gateway capabilities for runtime inspection. This product direction supports CASB-aligned controls that unify AI usage discovery, sensitive data protection, and policy enforcement across sanctioned and unsanctioned AI services.
Sovereignty, export controls, and regulated-cloud procurement also create expansion headroom for vendors that operationalize regional compliance through policy and infrastructure. BSI C5:2026 and ongoing EU cloud certification work tighten buyer scrutiny on where security processing and telemetry are handled, while FedRAMP requirements keep continuous monitoring central for government workloads. Commercially, vendors are bundling these compliance needs into delivery models that reduce operational burden, including managed SASE, and are using capabilities that reduce time-to-control across multicloud estates, helping adoption extend beyond large enterprises into resource-constrained organizations.
Recent Industry Developments in Cloud Access Security Brokers Market
- June 2026: Netskope unveils AI Command Center delivering comprehensive AI discovery, risk intelligence, and correlated-agentic response. The launch expands AI driven risk discovery and automated response for CASB and SASE, strengthening autonomous triage and coordinated security workflows across cloud access security and network security platforms.
- June 2026: Netskope joins Anthropic Project Glasswing to leverage Mythos Preview AI model for code vulnerability detection. The collaboration gives AI enabled vulnerability detection for cloud security and differentiates Netskope’s offering with advanced AI capabilities.
- May 2026: Netskope expands partnership with Deloitte to deliver managed SASE services including CASB, ZTNA, SWG, and SD-WAN. The partnership accelerates move to managed security services and broadens market reach.


Cloud Access Security Brokers Market Report Scope and Research Methodology
Market Definition and Coverage
This market covers revenue earned from cloud access security broker solutions and related services that help organizations see and control cloud usage, enforce security policies, and protect data moving between users and cloud applications.
Scope exclusions: This sizing excludes broader network security stacks and pure managed security services when they are not sold as CASB-focused products or projects.
Segments Covered in This Report
- By Service Model
- Infrastructure as a Service (IaaS)
- Platform as a Service (PaaS)
- Software as a Service (SaaS)
- By Organization Size
- Small and Medium Enterprises (SME)
- Large Enterprises
- By Deployment Mode
- API-based (Out-of-Band)
- Forward Proxy
- Reverse Proxy
- Multimode / Hybrid
- By End-User
- Banking, Financial Services and Insurance (BFSI)
- Education
- Government
- Healthcare and Life Sciences
- Manufacturing
- Retail and Wholesale
- Telecommunication and IT
- Others
- By Geography
- North America
- United States
- Canada
- Mexico
- South America
- Brazil
- Argentina
- Rest of South America
- Europe
- United Kingdom
- Germany
- France
- Russia
- Rest of Europe
- Asia-Pacific
- China
- Japan
- India
- South Korea
- Rest of Asia-Pacific
- Middle East and Africa
- Middle East
- Saudi Arabia
- United Arab Emirates
- Turkey
- Rest of Middle East
- Africa
- South Africa
- Nigeria
- Rest of Africa
- Middle East
- North America
Data Sources, Market Sizing, and Validation
Desk Research
Desk research was used to set clear boundaries for what counts as CASB revenue and to build the first set of demand and adoption assumptions. We reviewed public sources such as NIST publications, CISA guidance, SEC cybersecurity disclosures, the US Bureau of Labor Statistics (for cybersecurity workforce and wage context), and OECD digital economy indicators, plus standards and security best practices published by bodies such as ISO.
To reflect what buyers actually deploy, we also used company annual reports, earnings transcripts, product documentation, investor presentations, and credible technology press coverage of cloud security rollouts. In a few places, we used approved paid subscriptions for company financial intelligence, patent databases, and news and financials to cross-check timing of launches, M&A effects, and reported security revenue lines. The sources listed here are illustrative only, and many other public references were used for data collection, clarification, and cross-validation.
Primary Interviews and Surveys
Primary work focused on validating what is actually being purchased as CASB, how deals are packaged (standalone versus bundled), and how pricing changes with cloud application mix and user counts. We spoke with security leaders, cloud architects, channel partners, and implementation specialists across major regions, so desk research assumptions could be adjusted when real-world buying patterns differed.
Distribution of primary research fieldwork respondents
| Company type | Respondent position | Region |
|---|---|---|
| Top tier: 31% | CXOs: 14% | APAC: 45% |
| Mid tier: 48% | Functional/Unit leaders: 41% | EMEA: 34% |
| Smaller Players: 21% | Managers: 45% | Americas: 21% |
Market-Sizing & Forecasting
Sizing started with a top-down build that reconstructs addressable spend by linking enterprise cloud adoption to the portion of security budgets allocated to cloud policy enforcement and visibility controls, then filtering to what is commonly delivered as CASB. To keep the model practical, we corroborated these results with selective bottom-up checks, including sampled vendor revenue signals, channel feedback on typical deal sizes, and ASP times user or workload coverage assumptions for common deployment patterns.
Key inputs used in the model included the pace of SaaS adoption, identity and access policy enforcement needs, regulatory and compliance pressure that increases monitoring requirements, the share of remote and hybrid users accessing cloud apps, and the shift toward consolidated cloud security buying, including bundling that can mask standalone CASB value. Where direct revenue splits were not visible, we applied gap-handling rules based on consistent proxy indicators from interviews, product packaging evidence, and repeatable allocation logic.
For forecasting, we used scenario analysis supported by primary feedback, since adoption and pricing can move quickly with policy changes, threat spikes, and vendor bundling. The scenarios were tied to measurable drivers like enterprise cloud workload growth, security staffing constraints, and expected policy enforcement intensity, and then reconciled to a single base case after analyst review.
Data Validation & Update Cycle
Validation was done through multiple checks, starting with reconciling model totals against independent signals such as cloud security spending direction in filings, hiring and skills indicators, and stated customer rollout patterns collected in interviews. Outliers were flagged when regional growth or implied pricing moved outside reasonable bands, and those cases were reworked using refreshed assumptions and follow-up outreach when needed.
Before sign-off, the model is reviewed in steps so that inputs, calculations, and final totals are traceable and consistent across regions and time periods. Reports are refreshed annually, and interim updates are made when material events occur, such as major platform changes, large acquisitions, or sharp policy shifts. Right before delivery, a final pass is performed so clients receive the most current view available.
Mordor Intelligence's Cloud Access Security Brokers Market Size Measured Against Other Published Estimates
Published market sizes for CASB often do not line up because the term is used differently across sources, and because packaging has changed as cloud security tools get bundled. Differences in base year selection, currency timing, and whether services are counted at full contract value or only as software revenue also create visible gaps.
Evidence from product packaging checks, deal-structure interviews, and vendor revenue reconciliation is what anchors Mordor Intelligence to a CASB-only scope that avoids counting adjacent SSE or broader cloud security revenue when it is not clearly attributable. Key gap drivers typically include whether the estimate treats CASB as a standalone category versus a sub-module, how it handles managed services and implementation, and whether growth is projected using aggressive penetration jumps or stepwise adoption tied to cloud migration rates.
Benchmark comparison
| Source | Market Size | Gaps in Research Methodology |
|---|---|---|
| Mordor Intelligence | USD 11.10 B (2025) | |
| Global Market Publisher A | USD 13.61 B (2024) | Uses an earlier base year and can capture bundled revenue under the CASB label, which tends to lift the reported total when modules are packaged together. |
| Industry Research Portal B | USD 7.50 B (2024) | Shows a lower base that likely reflects narrower counting rules and limited disclosure-based estimation, with less adjustment for services and enterprise rollout intensity. |
The spread across the three figures is mainly explained by category boundaries and how bundled contracts are allocated back to CASB value. By keeping counting rules tied to observable packaging evidence and repeatable allocation steps, the model stays transparent, and it can be refreshed cleanly when pricing or bundle structures change.


Key Questions Answered in the Report
What is the projected size of the Cloud Access Security Brokers market by 2031?
The market is expected to reach USD 30.27 billion by 2031 on an 18.21% CAGR.
Why are organisations investing in CASB solutions now?
Regulatory mandates such as NIS2 and US Executive Order 14144, higher cyber-insurance premiums and rapid SaaS expansion are making CASB controls a prerequisite for compliance and risk reduction.
Which deployment model is growing fastest?
Multimode hybrid deployments combining inline and API controls show the highest CAGR at 21.75% through 2031.
Which region will see the quickest growth?
Asia Pacific is projected to record a 19.15% CAGR, driven by sovereign-cloud initiatives and new data-residency regulations.
How concentrated is vendor competition?
The market is moderately concentrated; the top five vendors hold about 60% of revenue, and active M&A continues to reshape the field.
What vertical will drive the next wave of demand?
Manufacturing is expected to grow at a 20.45% CAGR as factories integrate operational technology with cloud analytics, creating new security requirements.
Page last updated on:





