
Market Overview
| Study Period | 2020 - 2031 |
|---|---|
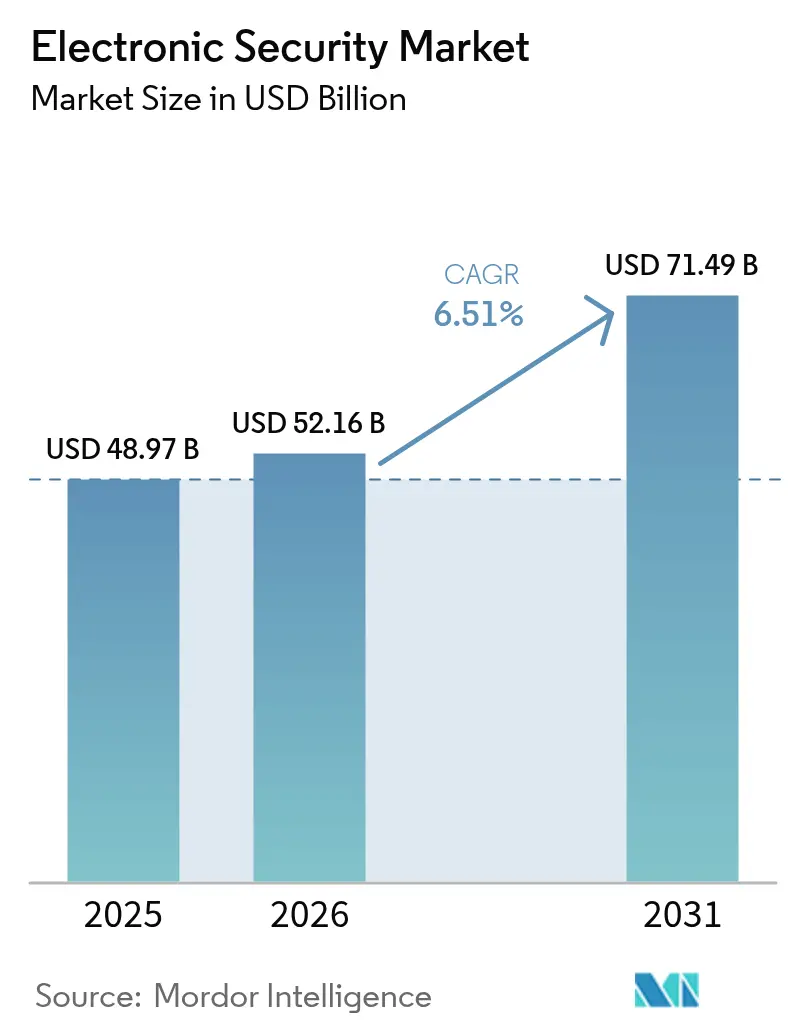
| Market Size (2026) | USD 52.16 Billion |
| Market Size (2031) | USD 71.49 Billion |
| Growth Rate (2026 - 2031) | 6.51 % |
| Fastest Growing Market | Asia-Pacific |
| Largest Market | North America |
| Market Concentration | Medium |
Major Players *Disclaimer: Major Players sorted in no particular order Image © Mordor Intelligence. Reuse requires attribution under CC BY 4.0. | |
Electronic Security Market Analysis by Mordor Intelligence
The electronic security market size is expected to grow from USD 48.97 billion in 2025 to USD 52.16 billion in 2026 and is forecast to reach USD 71.49 billion by 2031 at 6.51% CAGR over 2026-2031. Continued migration from analog systems, rising AI video analytics penetration, and tighter critical-infrastructure protection rules underpin this growth. Integrated cloud platforms reduce ownership costs and speed deployments, while edge processing curbs bandwidth needs and boosts real-time decision making. Vendor consolidation unlocks end-to-end offerings that combine surveillance, access, and alarms, yet also raises entry barriers for niche specialists. Governments sustain procurement budgets, smart-home adoption broadens the customer base, and expanding cyber-physical threats keep security investment top of mind across industries.
Key Report Takeaways
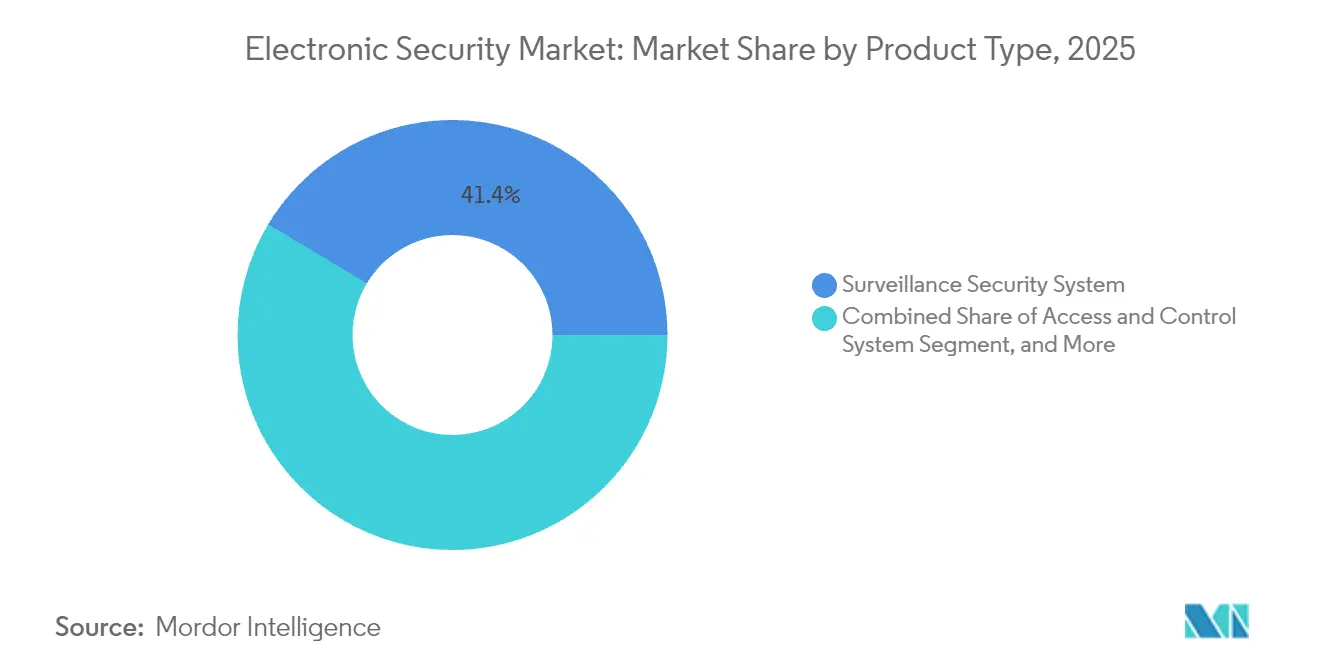
- By product type, surveillance systems led with 41.38% of electronic security market share in 2025; access and control solutions are projected to expand at a 7.05% CAGR through 2031.
- By service type, monitoring services captured 37.55% revenue in 2025, while cloud-based monitoring is poised for the highest 7.18% CAGR to 2031.
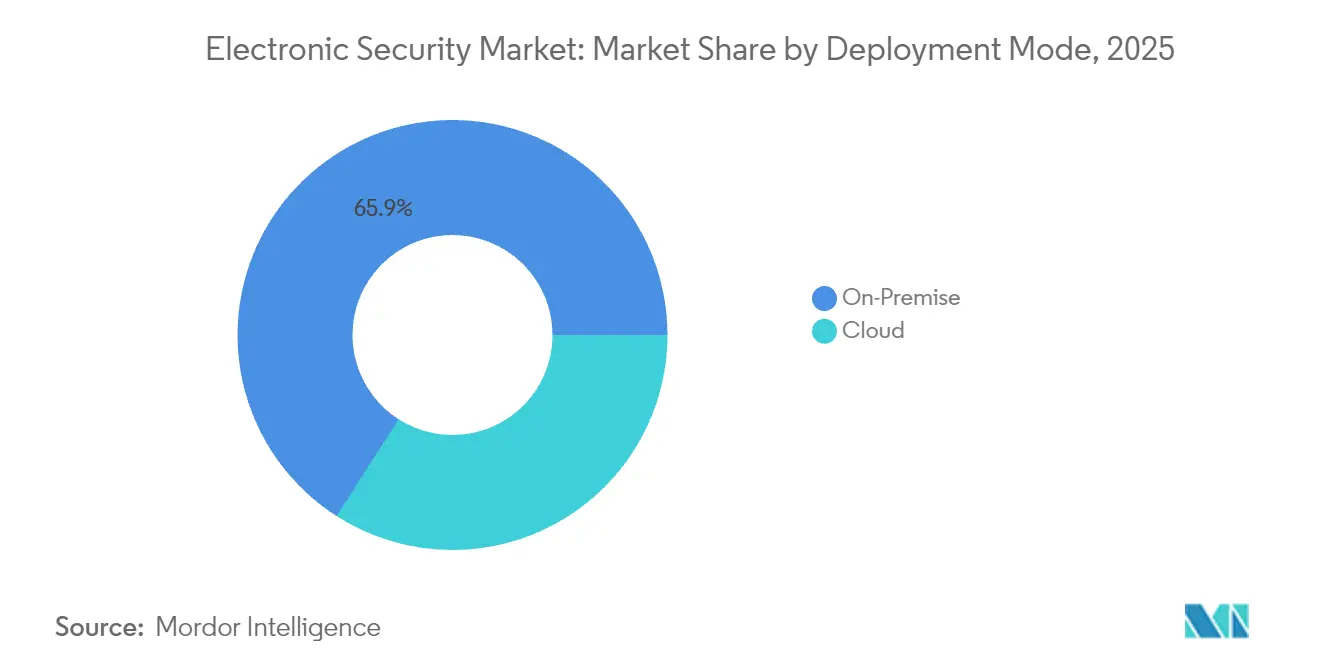
- By deployment mode, on-premise installations accounted for 65.94% of electronic security market size in 2025; cloud deployment is forecast to grow at a 6.86% CAGR.
- By end-user vertical, government applications commanded 22.54% revenue in 2025, whereas the residential segment is advancing at an 7.72% CAGR through 2031.
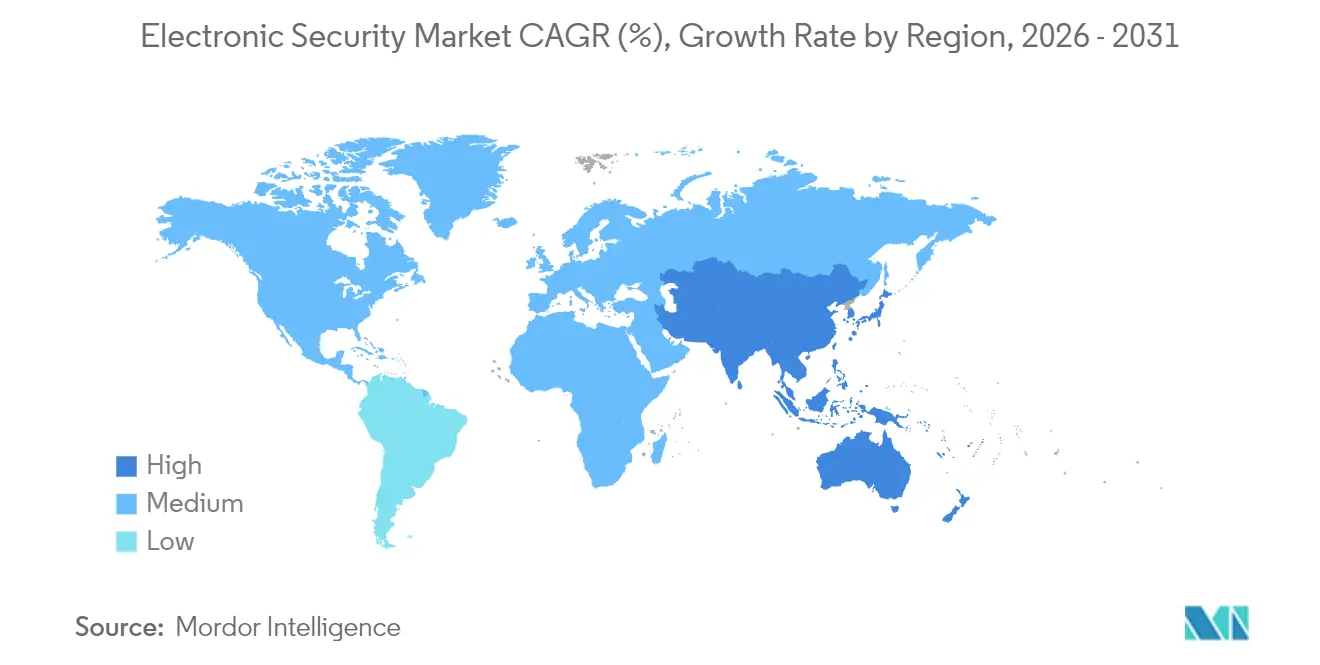
- By geography, North America contributed 33.21% revenue in 2025, and Asia Pacific is set to deliver the fastest 7.12% CAGR to 2031.
Note: Market size and forecast figures in this report are generated using Mordor Intelligence’s proprietary estimation framework, updated with the latest available data and insights as of 2026.
Market Trends and Insights
Drivers Impact Analysis of Electronic Security Market*
| Driver | (~) % Impact on CAGR Forecast | Geographic Relevance | Impact Timeline |
|---|---|---|---|
| Proliferation of AI-enabled video analytics | +1.8% | Global, early uptake in North America and Europe | Medium term (2-4 years) |
| Migration from analog to IP-based systems | +1.2% | Global, fastest in Asia Pacific | Long term (≥4 years) |
| Demand for integrated cloud-driven platforms | +1.5% | North America and Europe lead | Medium term (2-4 years) |
| Rise in smart and connected infrastructure | +1.1% | Asia Pacific core, spill-over to Middle East and Africa and Latin America | Long term (≥4 years) |
| Increasing physical-cyber convergence needs | +0.9% | Global, regulatory push in EU and North America | Medium term (2-4 years) |
| Surge in edge computing for real-time security | +0.7% | North America and developed Asia Pacific | Short term (≤2 years) |
| Source: Mordor Intelligence | |||
Proliferation of AI-Enabled Video Analytics
AI analytics turns cameras into proactive sensors that cut false alarms by 95% and support retail traffic insights.[1] Axis Communications, “Edge Analytics Accuracy Whitepaper,” axis.com Edge inference chips process footage locally, letting operators act within seconds at airports and power plants. Vendors monetize analytics licenses, while integrators upskill to manage algorithm training. Early adopters in North America and Europe validate performance benchmarks that spur global rollouts. Rising accuracy and declining compute costs keep this driver potent through the medium term.
Migration from Analog to IP-Based Systems
IP networks let firms monitor multiple sites remotely, integrate access control, and tap cloud storage. Subscription models shift spending from capital to operating budgets, drawing small and medium enterprises into the electronic security market. However, open network exposure mandates encryption and segmentation that add set-up complexity. Asia Pacific leapfrogs legacy cabling, installing IP in new malls and industrial parks, anchoring long-term growth.
Demand for Integrated Cloud-Driven Platforms
Multi-tenant clouds provide automatic updates, elastic storage, and scalable analytics, trimming hardware and maintenance outlays for 94% of adopters.[2]Acre Security, “The Future of Security in 2025: Insights from Industry Leaders,” acresecurity.com Managed-service providers bundle video, access, and alarms into recurring packages that widen addressable demand. Regulatory approval for off-premise data hosting in the United States and parts of Europe accelerates uptake, although mission-critical sites still keep some workloads local, prompting hybrid designs.
Rise in Smart and Connected Infrastructure
Smart-city budgets in the Middle East and Africa alone will channel USD 169 billion into IT by 2026, much earmarked for security layers. Municipal managers integrate cameras with traffic lights and emergency dispatch, enabling situational awareness. Building owners link air-quality sensors and access logs to energy dashboards for operational savings. The payoff fuels broader electronic security market investments even as cyber safeguards become integral specification items.
Restraints Impact Analysis of Electronic Security Market*
| Restraint | (~) % Impact on CAGR Forecast | Geographic Relevance | Impact Timeline |
|---|---|---|---|
| Fragmented compliance standards across regions | -1.3% | Global, hardest for multinationals | Medium term (2-4 years) |
| High total cost of ownership for SMEs | -0.8% | Global, higher in emerging markets | Long term (≥4 years) |
| Privacy concerns around facial recognition | -0.6% | EU and North America | Short term (≤2 years) |
| Supply chain disruptions for critical components | -0.9% | Global, with focus on Asian manufacturing | Short term (≤2 years) |
| Source: Mordor Intelligence | |||
Fragmented Compliance Standards Across Regions
The European NIS2 rules mandate controls that differ from U.S. frameworks, forcing vendors to re-engineer firmware and file extra documentation. Certification costs climb and product launches slip, straining smaller suppliers. Multinationals juggle parallel system builds to satisfy data-residency clauses, raising deployment expenses and slowing electronic security market expansion.
High Total Cost of Ownership for SMEs
Servers, storage, and specialist labor keep full-featured systems out of reach for many small businesses. Cloud subscriptions lower entry costs but spark concerns over internet reliability and data privacy. Without harmonized financing options or shared monitoring hubs, uptake among resource-constrained firms remains modest, subtracting momentum from the long-term forecast.
*Our forecasts treat driver/restraint impacts as directional, not additive. The impact forecasts reflect baseline growth, mix effects, and variable interactions.
Electronic Security Market Segment Analysis
By Product Type:
Surveillance Systems Secure Prime PositionSurveillance equipment captured 41.38% of electronic security market size in 2025 on the strength of AI-capable cameras and line-crossing analytics. Access and control products are climbing at a 7.05% CAGR, aided by biometric readers and mobile credentials. Vendors bundle thermal imaging and multi-sensor units to extend detection into low-light and harsh weather, while convergence with access logs enriches forensic evidence. Edge processing curtails backhaul costs, maintaining surveillance relevance even where bandwidth is scarce.
The proliferation of AI modules within cameras creates adjacent use cases such as queue management and industrial safety. Enterprise buyers view unified dashboards that marry video feeds with badge activity, positioning surveillance as the digital spine of next-generation facilities. As hardware commoditizes, differentiation shifts to software stacks and cybersecurity hardening, reinforcing the premium on integrated offerings within the electronic security market.



By Service Type:
Monitoring Generates Predictable Cash FlowsMonitoring services held 37.55% revenue in 2025, supplying always-on oversight that enterprises and local governments deem essential. Cloud monitoring’s 7.18% CAGR rides mobile apps and browser-based portals that let managers verify alarms on the go. Predictive maintenance algorithms schedule field visits before device failure, cutting downtime and truck rolls. Consulting engagements around compliance and cyber fortification rise as physical systems sit on corporate networks, cementing service providers as strategic partners.
Subscription economics attract investors seeking annuity returns, prompting acquisitions of regional monitoring centers. As do-it-yourself residential packages proliferate, professional monitoring upgrades become an upsell lever, broadening the electronic security market beyond commercial complexes. Top operators invest in AI triage tools that prioritize genuine alerts, preserving service levels even as camera volumes surge.
By Deployment Mode:
Cloud Gains Ground While Hybrid Remains KeyOn-premise still commands 65.94% of electronic security market share, especially in defense, utilities, and healthcare where data sovereignty rules apply. Cloud installations, expanding at 6.86% CAGR, offer pay-as-you-grow economics and instant feature rollouts. Hybrid architectures combine local recording with cloud analytics, satisfying regulatory auditors and innovation teams alike. Vendors supply secure gateways that sync metadata, easing migration paths from legacy servers.
Automatic firmware updates through cloud consoles shrink vulnerability windows, a benefit spotlighted by recent ransomware events. However, remote sites lacking reliable broadband continue to favor on-premise stores. Edge gateways with onboard AI blur the line, giving integrators levers to tailor security postures while sustaining momentum in the electronic security market.
By End-User Vertical:
Public Funding Anchors Demand, Homes Add VelocityGovernment projects supplied 22.54% revenue in 2025, spanning border control, city surveillance, and federal buildings. Legislated budgets shield spending from economic cycles, sustaining baseline demand. Residential deployments show an 7.72% CAGR as smart-home hubs pair doorbells with professional monitoring. Banks, data centers, and logistics operators blend physical controls with zero-trust IT policies, boosting cross-domain opportunities for integrators. Manufacturing firms focus on protecting OT networks, turning to unified video-and-sensor suites that flag both safety breaches and cyber intrusions.
Education campuses retrofit dorms and perimeters amid rising threat awareness, while retailers deploy store-wide analytics to slash shrinkage. Each vertical tailors performance metrics, yet all pivot on interoperable platforms that siphon insight from diverse sensors, enlarging the electronic security market canvas.
Geography Analysis
North America Electronic Security Market
North America generated 33.21% of 2025 revenue, propelled by USD 27.5 billion in federal cybersecurity outlays and TSA’s USD 10.8 billion multiyear plan for advanced screening. Early AI adoption and mature cloud acceptance speed platform upgrades, though semiconductor shortages elongate lead times. State grants encourage school safety retrofits, sustaining a robust project pipeline across the United States and Canada.
APAC Electronic Security Market
Asia Pacific is advancing at a 7.12% CAGR through 2031, bolstered by smart-city blueprints in China, India, and Southeast Asia. Local manufacturers supply cost-effective cameras, while 5G rollouts underpin cloud surveillance pilots. Government stimulus packages earmark funds for digital infrastructure, and a growing middle class embraces connected doorbells and motion sensors. Supply-chain geopolitics and export controls inject risk, yet rising urban density ensures recurring demand across commercial towers and industrial parks.
EMEA and LATAM Electronic Security Market
Europe’s outlook remains steady as the NIS2 Directive drives cyber-physical convergence spending. Germany and the United Kingdom modernize rail and energy assets with AI video and biometric gates, while GDPR steers vendors toward privacy-preserving analytics. The Middle East and Africa allocate USD 169 billion in IT spend by 2026, with security layers woven into megaprojects like smart districts and transport corridors. Latin America adopts cloud monitoring to offset skilled-labor gaps, though currency volatility tempers import plans. Collectively, these regional dynamics sustain the electronic security market growth arc.

Regulatory Landscape
Regulation for electronic security is tightening around cyber hardening of connected devices, supply-chain trust, and responsible use of AI, which adds compliance steps across surveillance, access control, and smart-home security. In the European Union, the Cyber Resilience Act (Regulation (EU) 2024/2847) entered into force in December 2024 and is moving into staged implementation, with CRA provisions applying from June 11, 2026 (conformity assessment body notification framework) and from September 11, 2026 (reporting obligations). This sequence raises expectations for vulnerability handling and documentation for products with digital elements.
In the United States, Federal Communications Commission actions in 2026 reinforce supply-chain and authorization scrutiny relevant to network-connected security hardware. In April 2026, the FCC adopted rules requiring certain license and authorization holders to attest whether they are owned, controlled, or subject to the jurisdiction of a foreign adversary, and in May 2026 the FCC adopted an NPRM to exclude entities on the FCC Covered List from providing domestic interstate telecommunications services under Section 214 authority. In Australia, enforcement commenced in June 2026 for the Cyber Security (Security Standards for Smart Device) Rules 2025 after a 12-month transition period, adding concrete requirements that affect security-aligned smart devices used in residential and small business environments.
Value Chain Analysis
The electronic security value chain covers component suppliers (imaging sensors, SoCs, microcontrollers, memory, and passive components), device OEMs (cameras, readers, panels, sensors), firmware and cybersecurity layers, VMS/PSIM and cloud platforms, and downstream channels including distributors, systems integrators, installers, and monitoring centers that deliver recurring services. As the market shifts from analog to IP and toward cloud-driven platforms, software subscriptions, analytics licensing, and managed services account for more of value capture. Integrators also increasingly bundle video, access, and alarms into unified deployments and hybrid architectures.
Upstream electronics constraints are affecting lead times and security hardware design choices. Supply-chain commentary in 2026 pointed to severe constraints linked to AI-driven memory allocation and logistics bottlenecks, with reported 26-55 week lead times for parts such as microcontrollers, DRAM, and high-capacitance MLCCs used in security devices. These conditions are pushing OEMs and integrators toward multi-sourcing, redesigns for component availability, and longer procurement planning, while vendor consolidation, such as Honeywell adding LenelS2 and Supra via its acquisition of Carrier Global's access solutions business, supports end-to-end portfolios across devices, software, and services.
Competitive Landscape
The electronic security market shows moderate concentration as diversified conglomerates extend portfolios through acquisitions. Honeywell paid USD 4.95 billion for Carrier Global’s access solutions arm, adding LenelS2 and Supra brands to its building-technology stack.[4]Larry Anderson, “2024 Was A Big Year For M&A In The Security Market,” SecurityInfoWatch, securityinfowatch.com Resideo absorbed Snap One for USD 1.4 billion, fusing smart-home distribution with professional integration lines. Canon-owned Milestone merged with Arcules to combine video management software with video-security-as-a-service, signaling a tilt toward unified clouds.
AI algorithm libraries become core differentiators, prompting patent races around object classification and behavior prediction. Vendors embed zero-trust network controls and post-quantum cryptography pilots to future-proof portfolios. Edge appliances shrink server racks, attracting cost-sensitive sectors and emerging-market projects. Strategic alliances with chipset makers secure supply, while participation in IEC and ISO committees shapes upcoming compliance baselines. New entrants exploit niches such as drone detection and air-quality security, yet scale advantages and channel breadth keep incumbents in pole position across the electronic security market.
Electronic Security Industry Leaders
Axis Communications AB
Robert Bosch GmbH
Honeywell International Inc.
Johnson Controls International plc
Checkpoint Systems Inc.
- *Disclaimer: Major Players sorted in no particular order

Electronic Security Market Companies Covered in this Report
- Axis Communications AB
- Robert Bosch GmbH
- Honeywell International Inc.
- Johnson Controls International plc
- Checkpoint Systems Inc.
- Teledyne FLIR LLC
- ADT Inc.
- Siemens AG
- International Business Machines Corporation
- Hangzhou Hikvision Digital Technology Co., Ltd.
- MOBOTIX AG
- Allegion plc
- Zhejiang Dahua Technology Co., Ltd.
- ASSA ABLOY AB
- Genetec Inc.
- Hanwha Vision Co., Ltd.
- Avigilon Corporation
- Aiphone Co., Ltd.
- Gallagher Group Limited
- Secom Co., Ltd.
- NAPCO Security Technologies, Inc.

Market Opportunities and Future Outlook
A key whitespace is compliance-ready, cyber-resilient electronic security for consumer and enterprise endpoints, spanning smart locks, alarm systems, access readers, and connected cameras. The EU Cyber Resilience Act provides a clear pull for vendors that package secure-by-design hardware, vulnerability handling, and documentation into faster-to-procure solutions. ETSI initiated pre-processing in June 2026 for EN 304 632 under the CRA mandate (M/606), targeting cybersecurity requirements for smart home security products, which creates opportunities for manufacturers and platforms that can translate evolving standards into certifiable product baselines. It also benefits integrators that can operationalize patching, logging, and incident workflows across mixed fleets.
Another opportunity is the convergence of physical security with IT/OT risk management and cloud governance, particularly for critical infrastructure operators and multi-site enterprises using hybrid deployments. The 2026 NERC Critical Infrastructure Protection roadmap highlights focus areas including MFA, encryption for certain communications, and prioritized risk management for third-party cloud services, supporting demand for security architectures that unify identity, access, and monitoring across cyber-physical environments. On the product side, open-protocol interoperability, for example ONVIF and RTSP portability, supports multi-vendor upgrades from analog and proprietary stacks, while cloud and edge analytics expansion gives service providers room to scale recurring offerings in monitoring, maintenance, and compliance consulting for buyers seeking outcomes rather than standalone devices.
Recent Industry Developments in Electronic Security Market
- June 2026: Honeywell expanded its Operational Technology (OT) Cybersecurity Suite with five new capabilities, including AI-powered Cyber Proactive Defense and automated Cyber GRC compliance management. The release strengthens offerings at the intersection of industrial cybersecurity and physical security operations, supporting buyers that want unified resilience and governance across IT/OT and connected security infrastructure.
- March 2026: Honeywell announced a collaboration with Rhombus to deliver an AI-driven, cloud-based video and access solution through Honeywell channel partners. The move aligns with the market shift toward cloud-managed, integrated platforms that combine surveillance and access control while simplifying deployment and lifecycle management for distributed buildings.
- September 2024: Axis Communications introduced AXIS Image Health Analytics to help diagnose camera view issues and improve system reliability. By reducing downtime and simplifying maintenance workflows, this capability supports service-led models where integrators and monitoring providers differentiate through uptime, remote troubleshooting, and predictable operations.


Electronic Security Market Report Scope and Research Methodology
Market Definition and Coverage
For this study, the electronic security market covers revenue generated from electronic systems and related services used to prevent, detect, and respond to safety and security events across residential, commercial, and public settings.
Scope exclusions: Purely mechanical security hardware and non-security building automation functions are excluded when they are not sold or deployed for a security use case.
Segments Covered in This Report
- By Product Type
- Surveillance Security System
- Alarm System
- Access and Control System
- Other Product Types
- By Service Type
- Installation and Integration
- Monitoring
- Maintenance and Support
- Consulting
- By Deployment Mode
- On-Premise
- Cloud
- By End-user Vertical
- Government
- Transportation
- Industrial
- Banking, Financial Services and Insurance (BFSI)
- Hospitality
- Retail Stores
- Residential
- Other End-user Verticals
- By Geography
- North America
- United States
- Canada
- Mexico
- South America
- Brazil
- Argentina
- Rest of South America
- Europe
- Germany
- United Kingdom
- France
- Italy
- Spain
- Russia
- Rest of Europe
- Asia Pacific
- China
- India
- Japan
- South Korea
- Australia and New Zealand
- Rest of Asia Pacific
- Middle East
- Saudi Arabia
- United Arab Emirates
- Turkey
- Rest of Middle East
- Africa
- South Africa
- Nigeria
- Kenya
- Rest of Africa
- North America
Data Sources, Market Sizing, and Validation
Desk Research
We start by setting the market boundary and demand context using public, checkable sources, then align that with how electronic security systems are bought and deployed. Helpful inputs come from US Census Bureau construction series, Bureau of Labor Statistics price and wage indicators, UN Comtrade trade flows for key device categories, and public procurement portals covering surveillance and access projects.
To make the model outputs usable, we also review company annual reports, investor presentations, and reputable press coverage on product launches and channel shifts. Where needed, our team uses paid subscriptions for company financials and intelligence, patent databases, and shipment-level import and export records to validate supplier exposure and avoid missing cross-border flows. These desk sources are not exhaustive, and we use additional public references to collect supporting data, validate assumptions, and clarify gray areas in the research.
Primary Interviews and Surveys
Primary work is used to test what we see in desk inputs, especially around buying cycles, system refresh timing, and pricing movement across cameras, access control, and intrusion systems. We interview and survey installers, distributors, system integrators, enterprise security teams, and product managers across APAC, EMEA, and the Americas, so assumptions can be cross-checked between more mature adoption patterns and faster-growing regional markets.
Distribution of primary research fieldwork respondents
| Company type | Respondent position | Region |
|---|---|---|
| Top tier: 32% | CXOs: 20% | APAC: 48% |
| Mid tier: 48% | Functional/Unit leaders: 26% | EMEA: 29% |
| Smaller Players: 20% | Managers: 54% | Americas: 23% |
Market-Sizing & Forecasting
Sizing begins with a top-down build where building stock and construction activity, security spend intensity by end user, and installed-base replacement cycles are used to reconstruct the addressable demand pool by region. Because spending is not uniform, we adjust the demand pool using indicators such as nonresidential floor area additions, public safety and transportation project pipelines, camera and access control attach rates for new sites, and average system life before upgrade.
Once the top-level demand is formed, the totals are corroborated with selective bottom-up checks, including sampled pricing (ASP) by device class, typical system mix per site type, and channel markups observed in distributor and integrator feedback. When inputs are thin in smaller countries, we handle gaps through proxying with comparable economies, import and export signals, and validated penetration ranges, then re-test assumptions in follow-up calls.
Forecasting is run using scenario analysis supported by expert consensus on the variables that move the market most, such as cloud migration speed, AI video analytics adoption, and public and private capex cycles. Where time series are stable, we use simple exponential smoothing as a cross-check so the final curve stays realistic and does not react to one-off events.
Data Validation & Update Cycle
Validation is done through stepwise triangulation, where the model output is compared with independent signals such as trade movement, construction cycles, and expected replacement-driven volume for key device groups. If a region or segment shows an unusual jump, the driver is traced back to a specific assumption like refresh rate, price movement, or penetration, and the input is revisited before sign-off.
Before publication, the work is reviewed by another analyst and checked again for currency consistency and year alignment so inflation and FX effects are not mixed into real demand growth. Reports are refreshed annually, and interim updates are made when material events change demand or pricing behavior. Right before delivery, we do a final pass on recent news and data releases so clients receive the most up-to-date view available.
Mordor Intelligence's Electronic Security Market Sizing Compared With Other Published Estimates
Published market sizes for electronic security do not always match, even when they look close, because firms use different cutoffs for products, services, and how they count revenue across the supply chain. Differences can also come from the timing of currency conversion, how price changes are handled, and whether replacement demand is treated as a steady cycle or as sharper spikes.
A refresh-led check often explains a large share of the spread, since electronics pricing and FX can move within a year and shift the same unit volumes into different USD totals. By keeping exchange rates aligned to the stated year, updating ASP assumptions with channel feedback, and re-validating replacement cycles during the latest review pass, Mordor Intelligence keeps the 2025 figure tied to what buyers actually pay for deployed electronic security systems.
Benchmark comparison
| Source | Market Size | Gaps in Research Methodology |
|---|---|---|
| Mordor Intelligence | USD 48.97 B (2025) | |
| Global Consultancy A | USD 52.85 B (2025) | Uses a broader segmentation cut that can pull in adjacent safety and monitoring services, and the pricing build appears to assume faster ASP expansion over the same base year. |
| Industry Publisher B | USD 57.22 B (2025) | Values are described at factory-gate level with related services included, which can shift the revenue capture point and create higher totals versus buyer-spend oriented accounting. |
Across the three figures, the main takeaway is that scope boundaries and year-specific price and currency handling can shift the headline number more than underlying unit demand does. When assumptions are kept explicit and tied to observable demand signals like installed-base refresh and construction-led additions, the resulting market size is easier to reproduce and to use for planning.


Key Questions Answered in the Report
How large is the electronic security market in 2026?
It is valued at USD 52.16 billion, with a 6.51% CAGR projected to 2031.
Which product category holds the biggest share of electronic security spending?
Surveillance systems captured 41.38% revenue in 2025.
What segment is growing fastest within electronic security deployments?
Access and control solutions are advancing at a 7.05% CAGR through 2031.
Why are governments key buyers of electronic security solutions?
Public agencies account for 22.54% revenue due to ongoing critical-infrastructure and homeland-security programs.
Which region is expanding quickest?
Asia Pacific leads with a 7.12% CAGR, driven by smart-city investments and urbanization.
What emerging technology most influences future security systems?
AI-enabled video analytics that reduce false alarms and unlock real-time insights drives near-term innovation.
Page last updated on:


 Your data is secure and never sold or shared.


