Breach And Attack Simulation Market Size and Share
Market Overview
| Study Period | 2020 - 2031 |
|---|---|
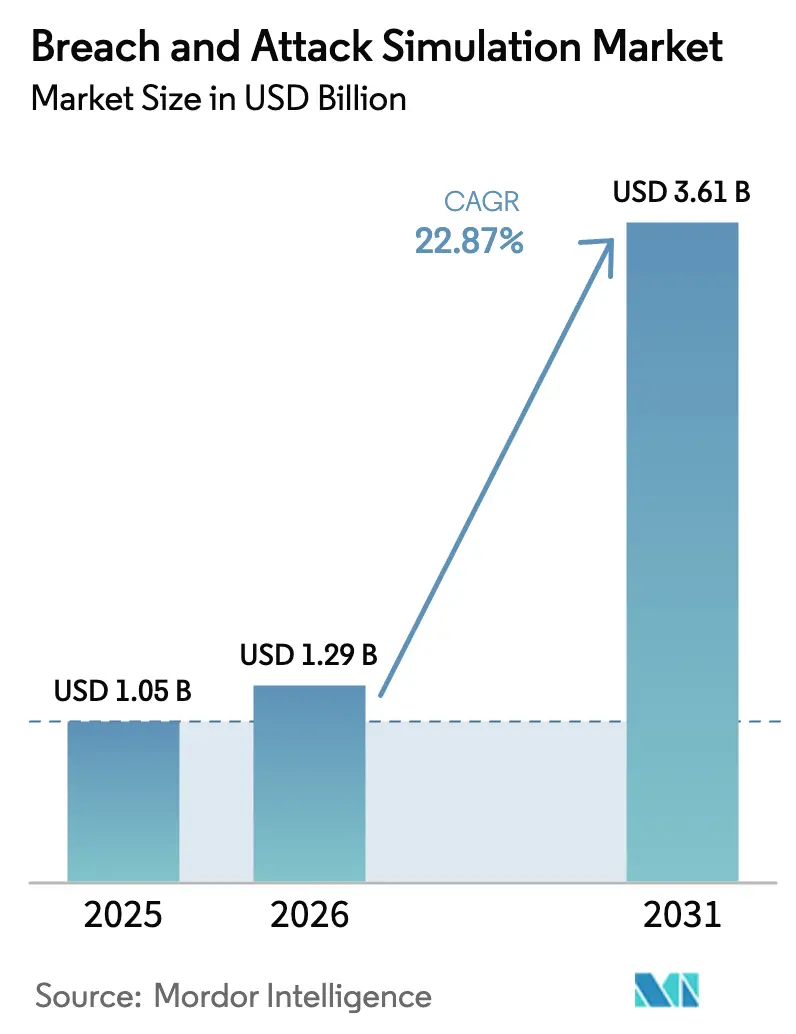
| Market Size (2026) | USD 1.29 Billion |
| Market Size (2031) | USD 3.61 Billion |
| Growth Rate (2026 - 2031) | 22.87% CAGR |
| Fastest Growing Market | Asia Pacific |
| Largest Market | North America |
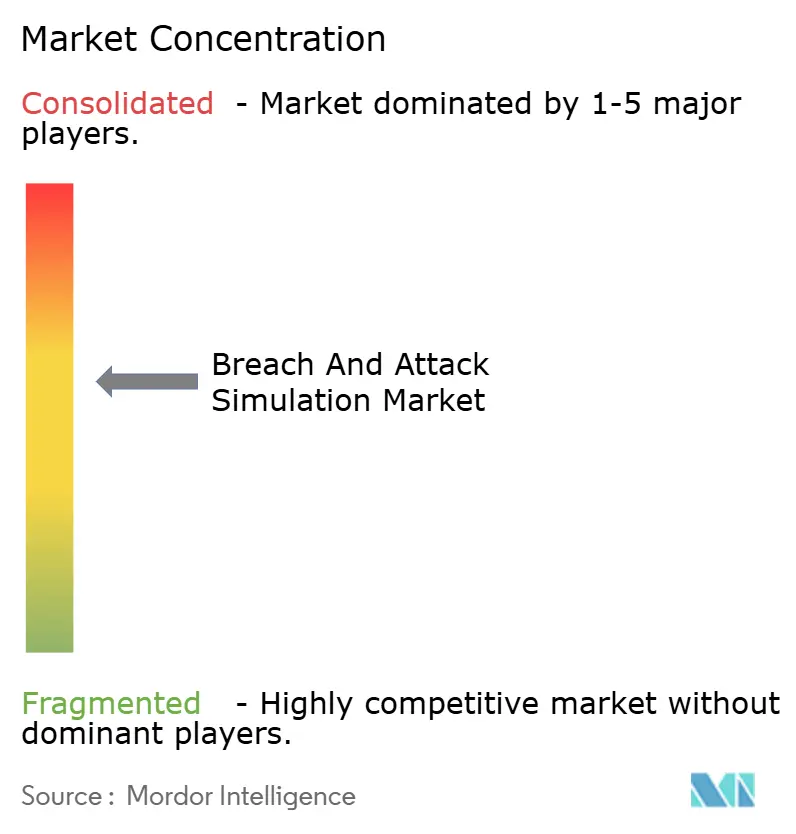
| Market Concentration | Medium |
Major Players *Disclaimer: Major Players sorted in no particular order Image © Mordor Intelligence. Reuse requires attribution under CC BY 4.0. | |
Breach And Attack Simulation Market Analysis by Mordor Intelligence
Breach and Attack Simulation market size in 2026 is estimated at USD 1.29 billion, growing from 2025 value of USD 1.05 billion with 2031 projections showing USD 3.61 billion, growing at 22.87% CAGR over 2026-2031. Surging cyber-attack complexity, rising regulatory scrutiny, and the move from ad-hoc penetration tests to continuous security validation are fueling demand. Average breach costs climbed to USD 4.88 million in 2024, pressuring boards to seek evidence-based cybersecurity assurance. New mandates such as the EU Digital Operational Resilience Act (DORA) compel financial entities to run realistic cyber-attack scenarios, cementing Breach and Attack Simulation market adoption. Vendors are embedding generative-AI adversary models, while cyber-insurance carriers now request BAS evidence to underwrite policies, further widening the addressable base. Consolidation continues as platform leaders acquire complementary analytics to deliver exposure management suites that align with Continuous Threat Exposure Management (CTEM) frameworks.
Key Report Takeaways
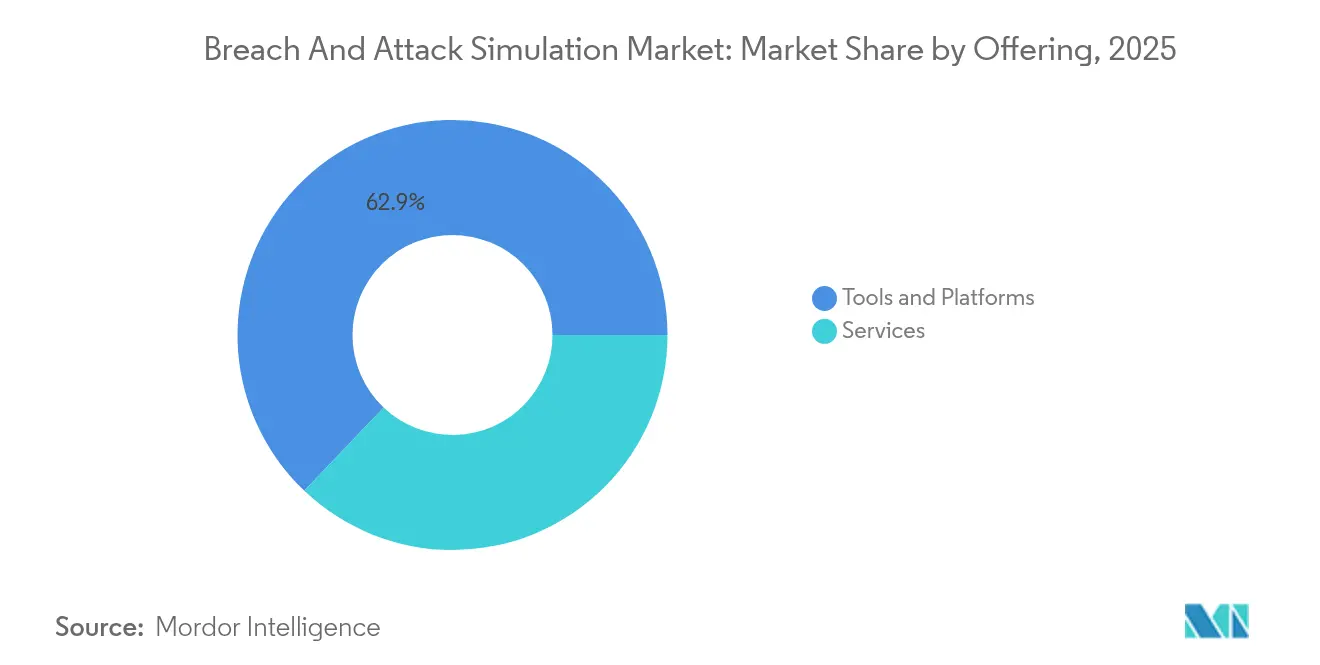
- By offering, Tools and Platforms captured 62.90% of the Breach and Attack Simulation market share in 2025; Services are set to expand at a 23.15% CAGR to 2031.
- By end-user enterprise size, Large Enterprises held 70.85% of the Breach and Attack Simulation market share in 2025, while Small and Medium Enterprises are advancing at a 26.6% CAGR through 2031.
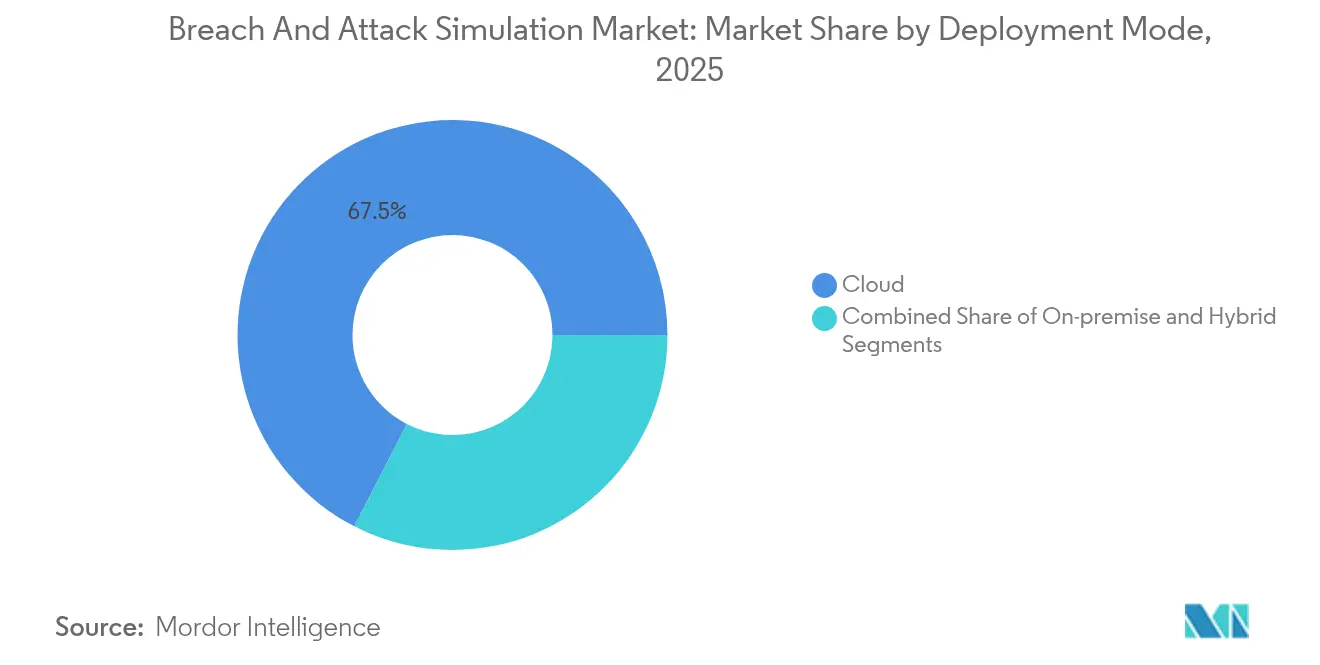
- By deployment mode, cloud accounted for 67.45% share of the Breach and Attack Simulation market size in 2025; hybrid models are projected to expand at a 24.7% CAGR between 2026-2031.
- By end-use industry, Banking, Financial Services, and Insurance led with 24.55% revenue share in 2025; Healthcare and Life Sciences is growing fastest at a 22.2% CAGR.
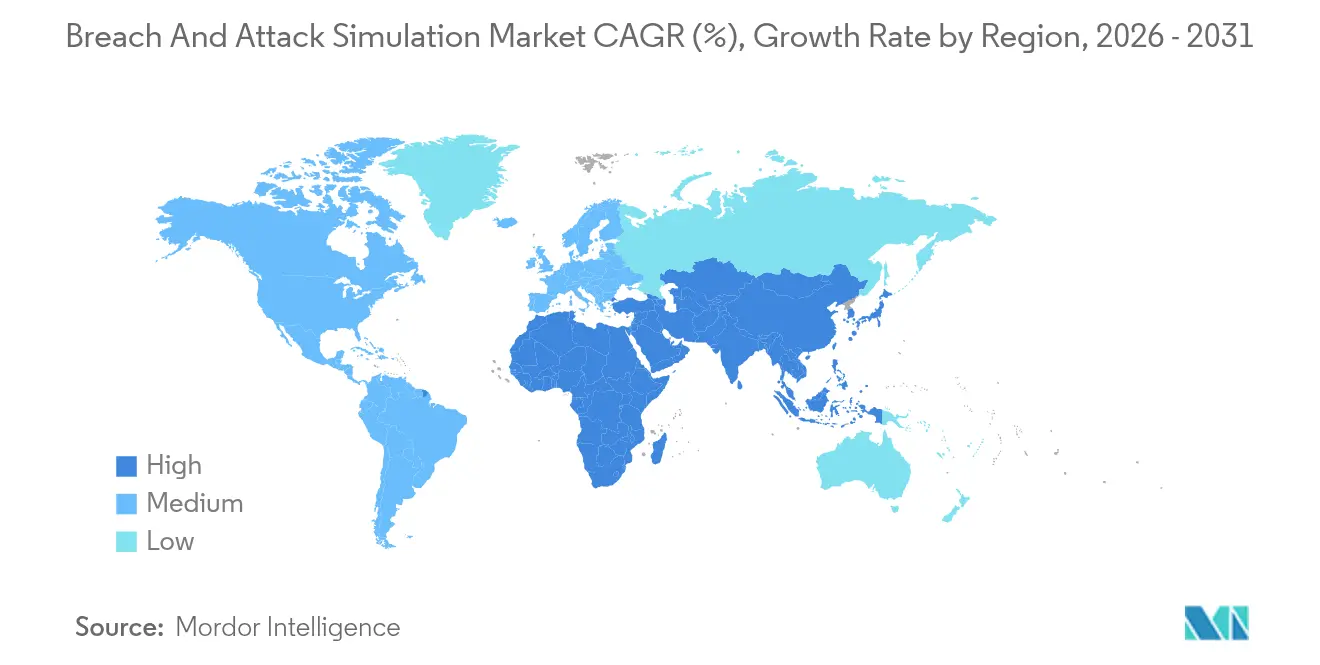
- By geography, North America commanded 41.35% of the Breach and Attack Simulation market in 2025, while Asia-Pacific registers the highest projected CAGR at 18.2% to 2031.
Note: Market size and forecast figures in this report are generated using Mordor Intelligence’s proprietary estimation framework, updated with the latest available data and insights as of 2026.
Global Breach And Attack Simulation Market Trends and Insights
Drivers Impact Analysis*
| Driver | (~) % Impact on CAGR Forecast | Geographic Relevance | Impact Timeline |
|---|---|---|---|
| Rising cyber-attack frequency and sophistication | +2.1% | Global | Medium term (2-4 years) |
| Tightening sector-specific compliance (e.g., DORA, HIPAA, PCI-DSS) | +1.8% | Global, with early gains in EU, North America | Short term (≤ 2 years) |
| Cloud and SaaS sprawl amplifying attack surface | +1.4% | Global, spill-over to emerging markets | Medium term (2-4 years) |
| Cyber-insurance underwriting now mandates BAS evidence | +1.2% | North America and EU core, expanding to Asia-Pacific | Short term (≤ 2 years) |
| Adoption of Continuous Threat Exposure Management (CTEM) frameworks | +1.0% | Global | Long term (≥ 4 years) |
| Generative-AI–powered adversary modelling inside BAS tools | +0.9% | North America, EU, Asia-Pacific core | Long term (≥ 4 years) |
| Source: Mordor Intelligence | |||
Rising cyber-attack frequency and sophistication
In 2024, attackers compromised 35 billion records across 9,500 incidents, elevating breach costs to USD 4.88 million and exposing the inadequacy of periodic testing[1]Infosys Limited, “2024 Data Breach Report,” infosys.com. Advanced persistent threats now automate reconnaissance with AI, forcing organizations to adopt platforms that recreate real-world techniques and highlight unseen control gaps before exploitation. The appearance of autonomous toolkits such as Xanthorox AI—with dedicated language models for malware development—illustrates the offence-defence arms race that sustains double-digit Breach and Attack Simulation market growth.
Tightening sector-specific compliance requirements
Since January 2025, DORA obliges roughly 22,000 EU financial entities to validate digital operational resilience through attack simulations, with non-compliance subject to significant fines. Parallelly, the NIS2 directive authorizes penalties up to EUR 10 million for essential operators lacking demonstrable risk management, transforming BAS from optional best practice to obligatory audit artifact. Similar provisions in HIPAA and PCI-DSS reinforce adoption globally.
Cloud and SaaS sprawl amplifying attack surface
Hybrid Cloud Security Survey 2025 reports that only one in three breaches are caught by installed tools, while 80% of security teams concede that multicloud complexity magnifies risk. East-West traffic blind spots persist as just 40% of firms monitor internal cloud flows. BAS engines imitate lateral movement across hybrid workloads, allowing security teams to test compensating controls where manual penetration exercises fall short, encouraging a shift toward hybrid BAS deployment.
Adoption of Continuous Threat Exposure Management frameworks
CTEM’s five-step model—scoping, discovery, prioritization, validation, mobilization—places BAS at its center as the validation layer that turns vulnerability data into prioritized remediation tasks. Organizations deploying CTEM alongside BAS report faster risk-to-action cycles and clearer board-level metrics, boosting the Breach and Attack Simulation market’s strategic relevance.
Restraints Impact Analysis*
| Restraint | (~) % Impact on CAGR Forecast | Geographic Relevance | Impact Timeline |
|---|---|---|---|
| Low awareness and budget constraints among SMEs | -1.6% | Global, with acute impact in emerging markets | Medium term (2-4 years) |
| Shortage of skilled BAS/Red-Team talent | -1.3% | Global, particularly Asia-Pacific and emerging markets | Long term (≥ 4 years) |
| Data-sovereignty concerns in highly regulated sectors | -0.8% | EU, Asia-Pacific core, with spillover to other regions | Short term (≤ 2 years) |
| Interoperability gaps with existing SOC tech-stacks | -0.7% | Global | Medium term (2-4 years) |
| Source: Mordor Intelligence | |||
Low awareness and budget constraints among SMEs
Despite a 27.8% CAGR, 99% of EU businesses that qualify as SMEs cite limited funds, fragmented tools, and skill shortages as hurdles to BAS uptake [2]SMESEC Consortium, “Cybersecurity for SMEs,” smesec.eu. Many still equate security validation with costly red-team engagements rather than affordable SaaS subscriptions. Vendors such as Cymulate responded in February 2025 with SMB-focused packages that streamline setup and flatten pricing, yet education gaps continue to cap penetration.
Shortage of skilled BAS and red-team talent
Global cybersecurity vacancies exceed 3.4 million, and BAS demands highly specialized offensive skills seldom found within security operations centers. In Asia-Pacific, attrition rates for red-teamers surpass 20% annually, prompting enterprises to outsource Validation-as-a-Service engagements or rely on managed BAS providers. Talent scarcity elevates the cost of ownership and slows program roll-outs, tempering the Breach and Attack Simulation market’s full potential.
*Our forecasts treat driver/restraint impacts as directional, not additive. The impact forecasts reflect baseline growth, mix effects, and variable interactions.
Segment Analysis
By Offering: Services Surge as Expertise Becomes Premium
Tools and Platforms accounted for 62.90% of 2025 revenue, cementing their role as the core engine of attack simulation. The Services segment, however, is expected to drive the largest incremental gains, climbing at 23.15% CAGR as enterprises purchase Validation-as-a-Service bundles rather than hire in-house talent. AttackIQ, for example, partnered with EY US to deliver managed simulations that embed BAS outcomes directly into enterprise risk dashboards. This pivot scales expertise, supports compliance reporting, and mitigates talent constraints.
Demand for Services is further propelled by increasing CTEM adoption, where consultants blend discovery, prioritization, and validation into packaged retainer offerings. For platform vendors, services create stickier relationships, raise switching costs, and feed product roadmaps with live customer telemetry. Consequently, the Breach and Attack Simulation market expects hybrid platform-plus-service contracts to dominate renewal cycles through 2031.


By End-User Enterprise Size: SME Explosion Drives Market Transformation
Large Enterprises owned 70.85% of 2025 spending, thanks to mature SOCs and budget depth. The SME cohort grows fastest at 26.6% CAGR as regulators extend cybersecurity rules to mid-market firms. Cymulate’s SMB release aims to remove complexity while preserving scenario breadth, signaling a broader shift toward lite offerings that fit constrained teams.
Budget sensitivity remains the top hurdle, yet cloud delivery and monthly pricing lower entry thresholds. As insurers demand simulation logs before underwriting, SMEs move simulation from discretionary to mandatory spend, expanding the breach and attack simulation market footprint.
By Deployment Mode: Hybrid Models Lead Digital Transformation
Cloud deployments captured 67.45% revenue in 2025 because SaaS platforms shorten setup time and deliver continuous updates. Hybrid models post the strongest 24.7% CAGR as firms reconcile cloud agility with on-premise control for regulated workloads. Financial regulators in the EU and Asia-Pacific prefer data to remain locally processed, prompting dual architectures.
On-premise models persist for critical infrastructure but face slower upgrade cycles and higher maintenance overhead. Vendors now ship Kubernetes-ready appliances that slot into private clouds, easing hybrid orchestration and sustaining momentum inside the breach and attack simulation market.
By End-Use Industry: Healthcare Acceleration Outpaces Financial Leadership
Banking, Financial Services, and Insurance led adoption with 24.55% share in 2025 due to strict audit regimes and frequent red-team exercises. FS-ISAC ran cyber range drills for more than 10,000 practitioners, underscoring the sector’s appetite for live-fire readiness.
Healthcare and Life Sciences expands at 22.2% CAGR as rising ransomware incidents collide with patient-safety regulation. HITRUST Alliance created CyberRX, a sector-specific simulation, showing demand for tailored content. Manufacturing, Retail, Government, and Energy verticals adopt steadily, driven by supply-chain risk and critical infrastructure mandates.
Geography Analysis
North America held 41.35% of 2025 revenue and remains the prime hub for platform innovation. The US federal budget earmarked USD 12.7 billion for cybersecurity in 2024, setting a supportive funding backdrop . Federal and state regulators press financial institutions and utilities to present live simulation evidence, ensuring sustained contract flow for domestic vendors. Partner ecosystems are mature, which accelerates managed BAS rollouts in healthcare and insurance.
Europe benefits from DORA and NIS2, which impose simulation benchmarks across financial services, energy, and digital infrastructure. Enterprises weigh cloud convenience against data-sovereignty rules, so hybrid deployment leads many proof-of-concepts. Vendors answer with regional data centers and sovereignty-mode options, keeping the breach and attack simulation market growth aligned with regulatory timelines.
Asia-Pacific is the fastest riser at 18.2% CAGR through 2031. Rapid digitalization expands attack surfaces, while governments tie cyber insurance subsidies to evidence of proactive testing. India targets a 5% share of the global cybersecurity market by 2028, powered by AI-based defense investments . Japan and Australia raise critical infrastructure rules that include continuous validation clauses, boosting local demand. Emerging markets in Southeast Asia adopt cloud-first simulation to bypass hardware outlay, further lifting regional momentum.

Competitive Landscape
The breach and attack simulation market shows moderate concentration. XM Cyber, Pentera, Cymulate, AttackIQ, and Picus Security together hold a significant share, leveraging patents in attack-path mapping and AI adversary generation. Pentera booked USD 105.5 million revenue in 2023, while Cymulate secured USD 141 million in venture funding to accelerate channel expansion.
Strategic moves focus on AI enrichment, industry templates, and exposure-management overlays. XM Cyber released privacy-safe AI modules that keep customer data on-premise but generate autonomous attack graphs, satisfying EU privacy regulators. Picus Security raised USD 45 million in Series C funds in February 2025 to extend its presence in the Americas and integrate with SOAR platforms.
Partnerships broaden reach: AttackIQ earned the first Continuous Authority to Operate from the US Marine Corps and listed its suite in AWS Marketplace in November 2024, simplifying procurement for public-sector buyers. Service alliances with consultancies such as EY and KPMG proliferate, transforming simulation results into board-ready exposure metrics and embedding the breach and attack simulation market inside enterprise risk programs.White-space opportunities arise in mid-market bundles, operational technology simulations, and coverage for AI model poisoning. As consolidation accelerates, larger cybersecurity vendors may buy niche simulation specialists to deliver full-stack CTEM portfolios.
Breach And Attack Simulation Industry Leaders
XM Cyber Ltd.
Pentera Security Ltd.
Cymulate Ltd.
AttackIQ Inc.
Picus Security Inc.
- *Disclaimer: Major Players sorted in no particular order

Recent Industry Developments
- February 2025: Picus Security raised USD 45 million in Series C funding led by Riverwood Capital to expand exposure-management capabilities and grow in the Americas.
- February 2025: Cymulate launched BAS for SMBs, supplying scaled-down simulation packages aimed at resource-constrained businesses.
- February 2025: SafeBreach introduced the SafeBreach Exposure Validation Platform that merges its Validate BAS engine with the new Propagate attack-path module for holistic cyber-risk views.
- November 2024: AttackIQ made its product suite available on AWS Marketplace, allowing customers to test, buy, and deploy BAS on Amazon Web Services.


Global Breach And Attack Simulation Market Report Scope
- Breach and attack simulation (BAS) employs an automated, continuous software-driven method for offensive security. Serving as a tool for validating security controls, BAS solutions empower organizations to identify their security vulnerabilities and offer crucial insights for prioritizing remediation efforts.
- The study tracks the revenue accrued through the sale of the breach and attack simulation solutions by various players across the globe. The study also tracks the key market parameters, underlying growth influencers, and major vendors operating in the industry, which supports the market estimations and growth rates over the forecast period. The study further analyses the overall impact of COVID-19 aftereffects and other macroeconomic factors on the market. The report’s scope encompasses market sizing and forecasts for the various market segments.
- The breach and attack simulation market is segmented by offerings (tools and platform, services), organization size (large enterprises, and small and medium enterprises), deployment type(cloud-based, and on-premises), end-use (BFSI, healthcare, retail, manufacturing, government, energy and utilities, and others), and geography (North America, Europe, Asia Pacific, Middle East & Africa, and Latin America). The market sizes and forecasts regarding value (USD) for all the above segments are provided.
| Tools and Platforms | Attack-path management tools |
| Continuous security validation platforms | |
| Services | Professional assessment services |
| Managed BAS/Validation-as-a-Service |
| Large Enterprises |
| Small and Medium Enterprises |
| Cloud-based |
| On-premise |
| Hybrid |
| BFSI |
| Healthcare and Life Sciences |
| Retail and E-commerce |
| Manufacturing and Industrial |
| Government and Public Sector |
| Energy and Utilities |
| Telecom and IT Services |
| Education |
| North America | United States | |
| Canada | ||
| Mexico | ||
| South America | Brazil | |
| Argentina | ||
| Rest of South America | ||
| Europe | Germany | |
| United Kingdom | ||
| France | ||
| Italy | ||
| Spain | ||
| Russia | ||
| Rest of Europe | ||
| Asia-Pacific | China | |
| Japan | ||
| India | ||
| South Korea | ||
| Australia and New Zealand | ||
| Rest of Asia-Pacific | ||
| Middle East and Africa | Middle East | Saudi Arabia |
| United Arab Emirates | ||
| Turkey | ||
| Rest of Middle East | ||
| Africa | South Africa | |
| Nigeria | ||
| Egypt | ||
| Rest of Africa | ||
| By Offering | Tools and Platforms | Attack-path management tools | |
| Continuous security validation platforms | |||
| Services | Professional assessment services | ||
| Managed BAS/Validation-as-a-Service | |||
| By End-user Enterprise Size | Large Enterprises | ||
| Small and Medium Enterprises | |||
| By Deployment Mode | Cloud-based | ||
| On-premise | |||
| Hybrid | |||
| By End-use Industry | BFSI | ||
| Healthcare and Life Sciences | |||
| Retail and E-commerce | |||
| Manufacturing and Industrial | |||
| Government and Public Sector | |||
| Energy and Utilities | |||
| Telecom and IT Services | |||
| Education | |||
| Geography | North America | United States | |
| Canada | |||
| Mexico | |||
| South America | Brazil | ||
| Argentina | |||
| Rest of South America | |||
| Europe | Germany | ||
| United Kingdom | |||
| France | |||
| Italy | |||
| Spain | |||
| Russia | |||
| Rest of Europe | |||
| Asia-Pacific | China | ||
| Japan | |||
| India | |||
| South Korea | |||
| Australia and New Zealand | |||
| Rest of Asia-Pacific | |||
| Middle East and Africa | Middle East | Saudi Arabia | |
| United Arab Emirates | |||
| Turkey | |||
| Rest of Middle East | |||
| Africa | South Africa | ||
| Nigeria | |||
| Egypt | |||
| Rest of Africa | |||


Key Questions Answered in the Report
What is the current size of the breach and attack simulation market?
The market stands at USD 1.29 billion in 2026 and is projected to rise to USD 3.61 billion by 2031.
Which segment is growing the fastest within the breach and attack simulation market?
Services are expanding at a 23.15% CAGR as enterprises outsource expertise to address talent shortages.
Why are hybrid deployments gaining traction?
Hybrid models balance cloud scalability with on-premise control in regions that enforce data-sovereignty rules, driving a 24.7% CAGR for the deployment mode.
How does regulation influence adoption?
Frameworks such as DORA and NIS2 require realistic cyber-attack testing, making breach and attack simulation essential evidence for compliance.
Page last updated on:


