Ambient Lighting Market Size and Share
Market Overview
| Study Period | 2020 - 2031 |
|---|---|
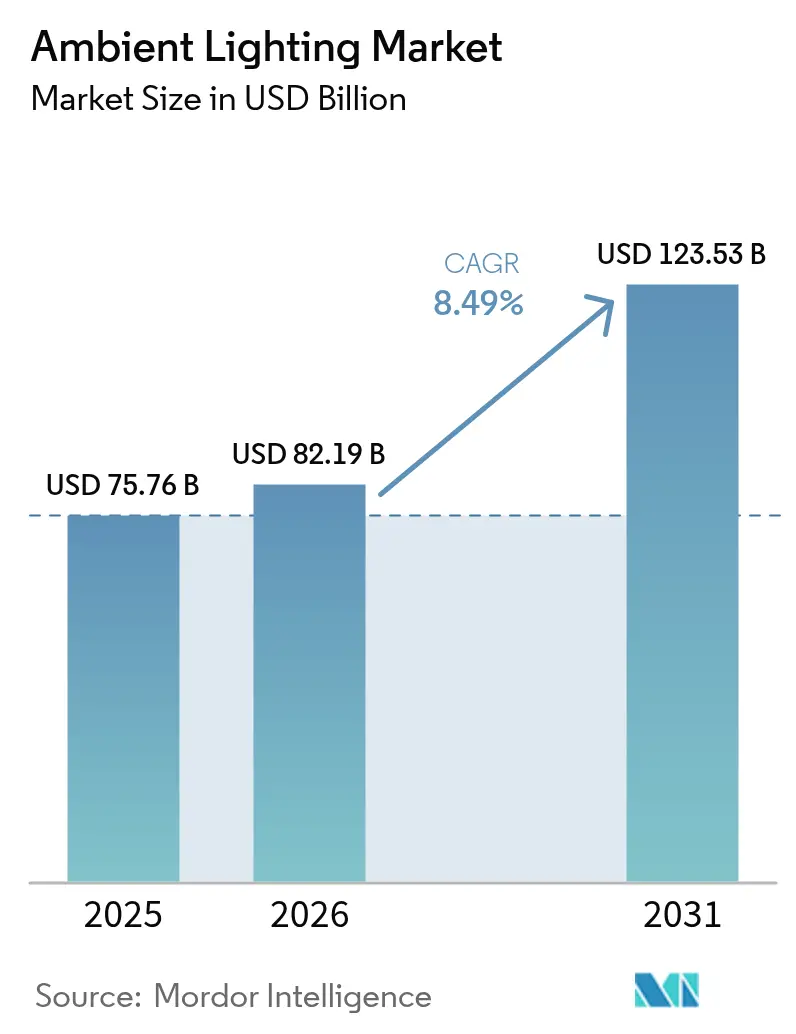
| Market Size (2026) | USD 82.19 Billion |
| Market Size (2031) | USD 123.53 Billion |
| Growth Rate (2026 - 2031) | 8.49% CAGR |
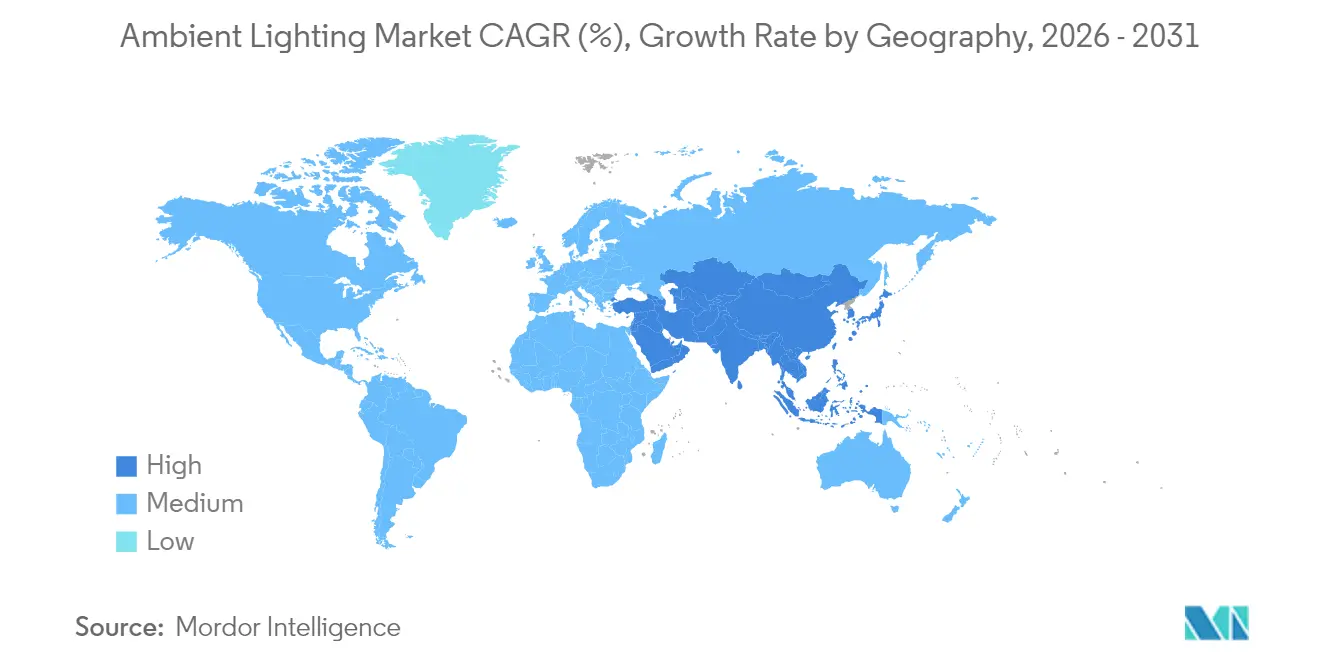
| Fastest Growing Market | Asia Pacific |
| Largest Market | Asia Pacific |
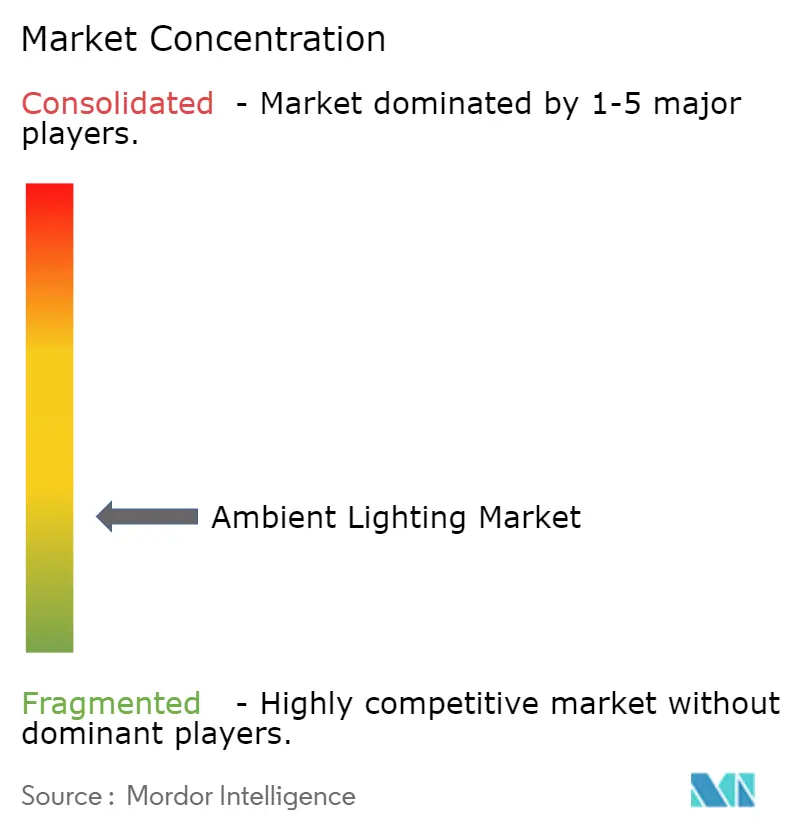
| Market Concentration | Low |
Major Players *Disclaimer: Major Players sorted in no particular order Image © Mordor Intelligence. Reuse requires attribution under CC BY 4.0. | |
Ambient Lighting Market Analysis by Mordor Intelligence
The ambient lighting market size is expected to grow from USD 75.76 billion in 2025 to USD 82.19 billion in 2026 and is forecast to reach USD 123.53 billion by 2031 at 8.49% CAGR over 2026-2031. Growth is anchored in global efficiency mandates, rapid LED penetration, and the widening appeal of connected systems that link lighting with broader smart-building platforms. LED-based products already account for 90% of total lighting sales, reshaping value chains toward software, sensors, and services. Asia Pacific owns nearly one-half of worldwide revenue and continues to expand at double-digit speed on the back of urbanization programs and state-funded smart-city rollouts. Product mix is shifting: lamps and luminaires still dominate, yet controls are now the strategic growth engine as end users seek energy savings, data, and human-centric functions that raise productivity.
Key Report Takeaways
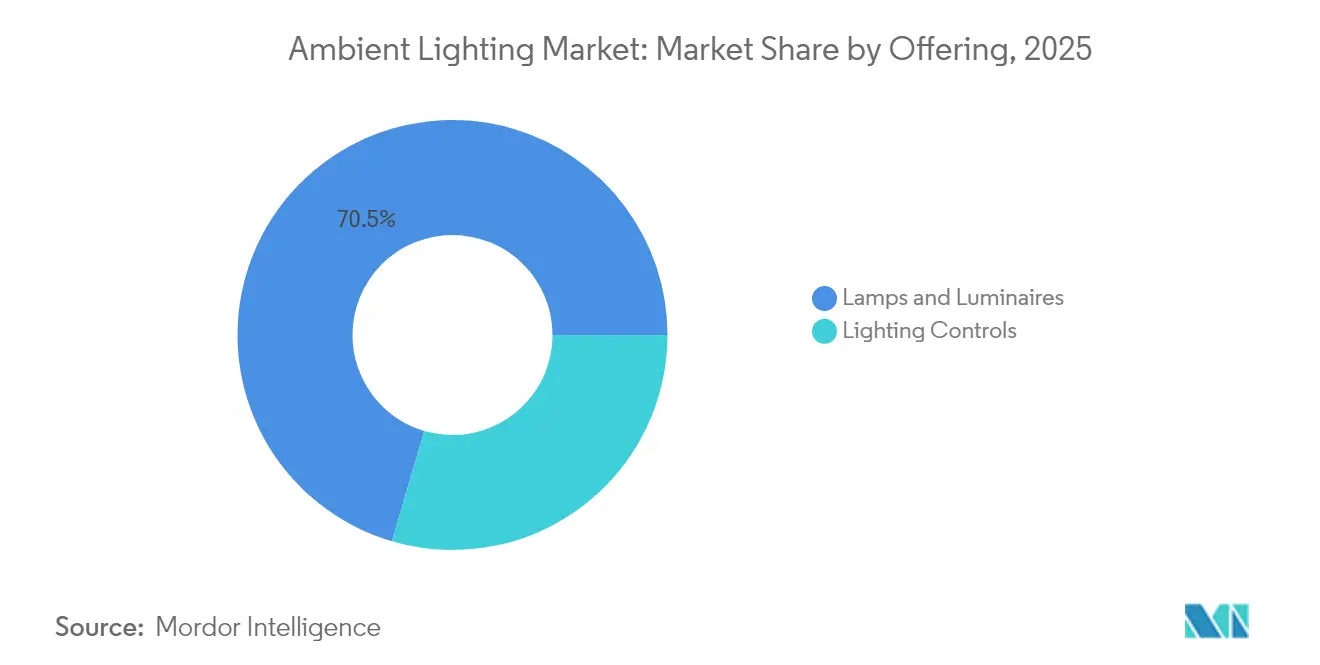
- By product category, lamps & luminaires led with 70.45% revenue share in 2025; lighting controls are projected to expand at a 9.02% CAGR to 2031.
- By installation phase, retrofit and renovation commanded 62.35% of the ambient lighting market share in 2025, while new-construction projects are set to grow at 8.74% CAGR through 2031.
- By type, surface-mounted fixtures held 27.55% revenue in 2025; strip lights are forecast to grow fastest at 11.04% CAGR.
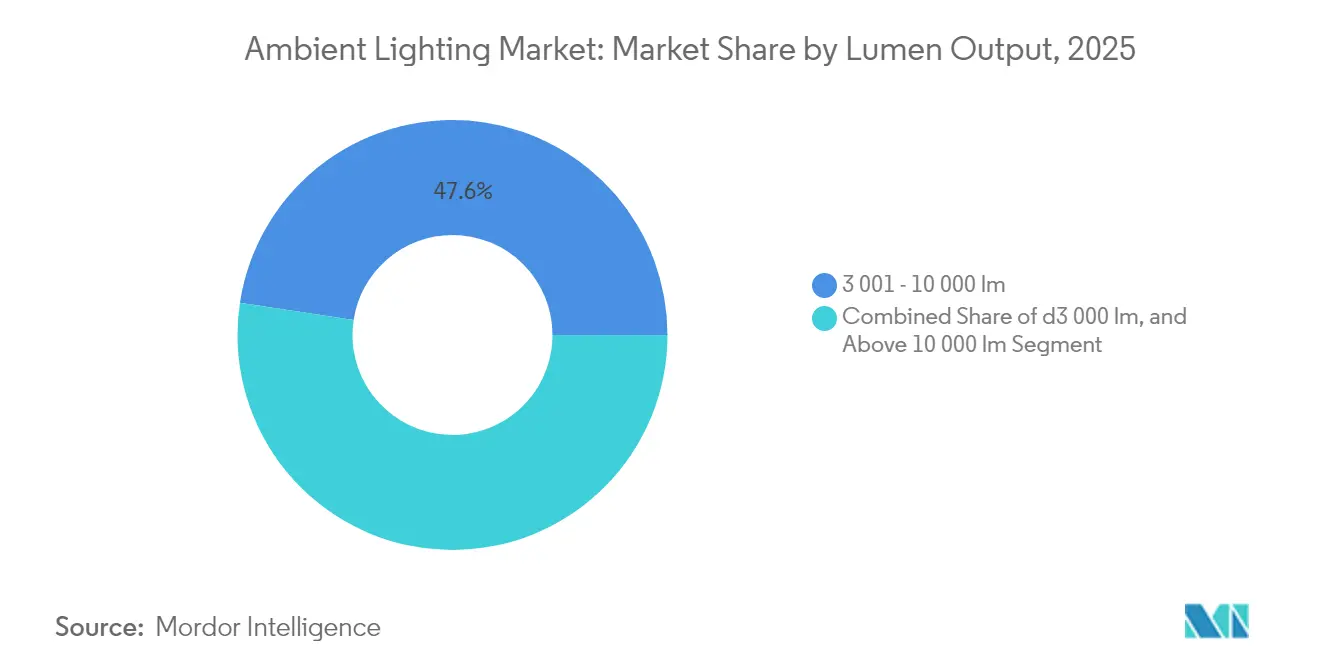
- By lumen output, the 3,001-10,000 lm commercial range accounted for 47.60% of the ambient lighting market size in 2025; the >10,000 lm class will post a 9.98% CAGR between 2026-2031.
- By connectivity, wired systems retained 71.30% of 2025 revenue; wireless platforms will record a 12.90% CAGR through 2031.
- By end user, residential applications captured 33.55% of 2025 revenue; automotive interiors will rise at 10.74% CAGR to 2031.
- By geography, Asia Pacific held 45.65% revenue in 2025 and will expand at 12.35% CAGR, the fastest globally.
Note: Market size and forecast figures in this report are generated using Mordor Intelligence’s proprietary estimation framework, updated with the latest available data and insights as of 2026.
Global Ambient Lighting Market Trends and Insights
Drivers Impact Analysis*
| Driver | (~) % Impact on CAGR Forecast | Geographic Relevance | Impact Timeline |
|---|---|---|---|
| LED Retrofit Mandates Accelerating Commercial Up-grades in EU and Australia | +1.8% | Europe, Australia | Medium term (2-4 years) |
| Smart-city Investments Driving Connected Street-light Retrofits in Asia | +1.5% | Asia Pacific, with spillover to MEA | Medium term (2-4 years) |
| OEM-Triggered Ambient Packages in Mid-segment Autos (Asia and Europe) | +1.3% | Asia Pacific, Europe | Long term (≥ 4 years) |
| WELL and LEED v4 Standards Pushing Human-Centric Lighting in United States Offices | +1.2% | North America, with adoption in Europe | Long term (≥ 4 years) |
| Hospitality Re-brand Cycles Increasing Aesthetic Ambient Budgets (Gulf Cooperation Council Countries) | +0.9% | Middle East, with expansion to global hospitality chains | Medium term (2-4 years) |
| Rapid e-commerce Warehouse Build-outs Needing Low-glare Luminaires | +0.8% | Global, with concentration in North America and Asia Pacific | Short term (≤ 2 years) |
| Source: Mordor Intelligence | |||
LED retrofit mandates accelerating commercial upgrades in EU and Australia
Stringent policy frameworks such as the European Union Ecodesign Directive and Australia’s National Construction Code are forcing the phase-out of legacy lamps. Compliance rather than payback is now the tipping point, pushing building owners to adopt LED fixtures that satisfy minimum efficacy thresholds. The commercial segment alone is projected to jump from USD 17.07 billion in 2024 to USD 27.38 billion by 2030 as mandated upgrades converge with rising demand for connected controls. Suppliers are responding with quick-fit lamps, driverless tubes, and field-programmed retrofit kits that minimize downtime and labor costs.[1]Eric Rondolat, “Annual Report 2024,” Signify, signify.com
Smart-city investments driving connected street-light retrofits in Asia
National smart-city missions across China, India, and Japan place adaptive street lighting at the core of digital infrastructure. Municipalities are replacing conventional high-pressure sodium fixtures with networked LEDs that can host 5G small cells, air-quality sensors, and traffic cameras. Wireless protocols such as Zigbee and BLE Mesh offer scalability without trenching new cables, a decisive factor in dense urban cores. Hardware specialists that deliver open-API nodes are well-positioned as cities bundle lighting with broader IoT services.[2]LTECH Corporate News, “Li Fangfang of LTECH: Integration Trends in 2025,” LTECH, ltech.cn
OEM-triggered ambient packages in mid-segment autos
Automakers once reserved multi-color cabin light for luxury models; today, BMW, Toyota, and Hyundai supply customizable ambiance in mainstream vehicles. Interior LEDs now sync with drive modes, infotainment cues, and advanced driver-assistance warnings, enhancing both safety and brand appeal. Tier-1 suppliers are racing to miniaturize optics and add digital controls that withstand automotive temperature and vibration cycles while meeting new warranty requirements.[3]ams-OSRAM Product Group, “Automotive & Mobility – Ambient Lighting,” ams-osram.com
WELL and LEED v4 standards pushing human-centric lighting in US offices
Corporate real-estate teams pursue WELL and LEED credits that reward circadian-friendly lighting. Tunable-white luminaires that follow natural daylight cycles have shown 6% gains in worker productivity and 15% gains in creative output. Demand is spilling into the renovation wave of older office towers where occupant wellness now ranks alongside energy metrics in capital-planning decisions.[4]Alcon Lighting Editorial Team, “2025 Commercial Lighting Design Trends Move Beyond Basics,” Alcon Lighting, alconlighting.com
Restraints Impact Analysis*
| Restraint | (~) % Impact on CAGR Forecast | Geographic Relevance | Impact Timeline |
|---|---|---|---|
| High Inrush-Current Failures in Large-scale LED Strip Deployments | -1.1% | Global, particularly in commercial and industrial applications | Short term (≤ 2 years) |
| Fragmented Wireless Protocols Elevating Control-System Integration Cost | -0.9% | Global, with higher impact in retrofit applications | Medium term (2-4 years) |
| Post-COVID Office Downsizing Reducing Retrofit Pipelines (NA and EU) | -0.7% | North America, Europe | Short term (≤ 2 years) |
| Tight Rare-earth Supply Chain Inflating Phosphor and Driver Prices | -0.6% | Global, with higher impact on cost-sensitive segments | Medium term (2-4 years) |
| Source: Mordor Intelligence | |||
High inrush-current failures in large-scale LED strip deployments
Multi-string strip systems can draw damaging current spikes when thousands of drivers power up simultaneously, triggering breaker trips and warranty claims. Soft-start power supplies and sequential controllers mitigate risk but add cost. Reliability concerns may delay rollouts in logistics hubs where linear lighting often spans hundreds of meters.
Fragmented wireless protocols elevating control-system integration cost
Zigbee, BLE Mesh, Thread, and proprietary stacks each excel in specific use cases yet seldom interoperate. In retrofit projects the wrong choice can lock owners into vendor ecosystems or require costly gateways. Standards bodies are converging on DALI+ and Bluetooth LE specifications, but until true plug-and-play emerges, integrators must budget extra engineering hours.
*Our forecasts treat driver/restraint impacts as directional, not additive. The impact forecasts reflect baseline growth, mix effects, and variable interactions.
Segment Analysis
By Offering: Controls Drive Intelligence Revolution
Lamps and luminaires remain the revenue cornerstone, holding 70.45% in 2025 thanks to the mass conversion from fluorescent and halogen to LED. ENERGY STAR-rated fixtures consume 90% less power than incandescent alternatives and last 15 times longer, slashing maintenance budgets and carbon footprints. Replacement activity across offices, homes, and warehouses keeps demand stable even as unit prices fall.
Lighting controls are the market’s accelerant, forecast to grow 9.02% annually. Open DALI gateways, Bluetooth LE networks, and cloud dashboards embed data insights that extend beyond energy management. Signify reports that connected systems and services delivered 30% of company sales in 2024, confirming rising customer appetite for software-centric propositions. The ambient lighting market size for connected controls is set to widen as building codes mandate occupancy sensing and daylight harvesting.


By Installation Phase: Retrofit Dominance Drives Market
Retrofit and renovation projects generated 62.35% of 2025 revenue as owners upgraded vast stocks of outdated fixtures. The United States residential remodeling market surpassed USD 600 billion in 2022, with 34% of spend flowing into energy-related upgrades that include lighting. City carbon caps such as New York Local Law 97 amplify urgency, imposing fines starting in 2025 for inefficiency breaches. Guidance from the U.S. General Services Administration lists LED tubes, retrofit kits, or full luminaire swaps as approved pathways, fueling a deep replacement funnel.
New construction accounts for a smaller base but will outpace retrofits at 8.74% CAGR. Architects now program lighting early in design workflows to capture WELL and LEED credits, integrate sensors, and streamline commissioning. Smart commercial campuses specify network-ready fixtures as baseline, propelling ambient lighting market penetration in mixed-use towers, data centers, and healthcare facilities. Ambient lighting market size gains in new builds are also supported by economies of scale that allow bundled hardware-plus-software contracts.
By Type: Strip Lighting Leads Innovation Wave
Surface-mounted fixtures retained a 27.55% share in 2025, prized for straightforward installation across offices, classrooms, and corridors. Suspended linear bars and recessed cans complement the category, giving designers options for glare control and visual comfort.
LED strip lighting, however, will grow fastest at 11.04% CAGR as architects specify continuous “lines of light” that merge task and accent roles. Retail shelf illumination, cove accents in hotels, and under-cabinet task zones in kitchens exemplify its flexibility. Yet high inrush-current failures loom large. Vendors that deliver soft-start drivers and robust PCB thermal paths can capture outsized gains in this segment of the ambient lighting market.
By Lumen Output: Commercial Range Dominates Applications
The 3,001-10,000 lm class captured 47.60% revenue in 2025 because most offices, supermarkets, and learning facilities operate within this brightness band. Human-centric lighting pilots in open-plan spaces show tangible productivity lifts, encouraging corporate rollouts. Daylight sensors and occupancy analytics can trim lighting energy 25-80% while preserving comfort.
High-lumen (>10,000 lm) fixtures will register the quickest expansion at 9.98% CAGR as e-commerce warehouses, distribution centers, and smart-city highways demand glare-free but powerful illumination. Signify’s 2024 launch of UltraEfficient street luminaires underscores innovation aimed at halving energy draw versus earlier LED designs. Residential demand (≤3,000 lm) remains steady, spurred by voice-controlled smart bulbs and mood-tunable downlights.
By Connectivity: Wireless Revolution Accelerates
Wired networks such as DALI and KNX still dominate with 71.30% revenue in 2025 because of their robust reliability in mission-critical sites. DALI-2 and D4i drivers now expose energy reporting that facilities managers feed into building dashboards for carbon tracking.
Wireless links are the growth story, predicted to post a 12.90% CAGR. Bluetooth Mesh allows many-to-many messaging, making it fit for multi-tenant apartments and factory floors. Research in Sensors confirms its scalability when designers mitigate interference with channel planning. Wireless also triumphs in retrofits where tearing walls for new control cables is untenable. The ambient lighting market stands to benefit from hybrid architectures that blend wired backbones with wireless edge nodes, giving owners future-proof flexibility.
By End User: Automotive Applications Accelerate
Automotive interiors form the fastest-growing end-user niche at 10.74% CAGR. Cabin LEDs now pulse with driver-assist alerts, swing to warm tones for relaxation, and echo infotainment beats, turning light into a signature branding surface. Tier-1s supply thin lightguides and RGB controllers that withstand automotive temperature extremes. Signify’s 2025 debut of an EV lightstrip for Xiaomi illustrates how traditional lighting majors are carving footholds in mobility.
Residential spaces stay the largest slice at 33.55% thanks to smart-home adoption and wellness awareness. Tunable-white bulbs that align with circadian rhythms and voice-activated scenes elevate consumer demand. Hospitality chains in the Gulf Cooperation Council funnel renovation budgets into immersive ambience that shapes guest perception. Retail outlets deploy directional accent lights that lift merchandise appeal and increase dwell times. Across every vertical, the ambient lighting market pivots from pure illumination toward experiential value.
Geography Analysis
Asia Pacific controls 45.65% of 2025 revenue and will grow at 12.35% CAGR through 2031, driven by state subsidies for efficient lighting, sprawling residential construction, and global leadership in LED component production. China spearheads both manufacturing prowess and giant smart-city pilots that anchor connected street-light demand. India’s 100-city mission and Japan’s Society 5.0 vision reinforce the regional pipeline for controls, sensors, and platform integration.
North America is a mature but innovation-led arena. Signify’s 2024 data show that the United States contributed USD 2.20 billion, roughly one-third of its global sales. Residential remodels remain strong, yet office downsizing after COVID slows some retrofit schedules. WELL and LEED adoption maintains momentum for human-centric upgrades that justify premium fixtures and advanced controls.
Europe occupies a design-centric and regulation-heavy position. The Ecodesign Directive obliges LED transitions across commercial estates, and the region champions high color-rendering products that align with its emphasis on visual comfort. Automakers in Germany and France extend ambient packages downrange, spurring component suppliers to deliver cost-optimized RGB modules.
South America and the Middle East & Africa together contribute a smaller share but post healthy growth. GCC hospitality refurbishments prioritize dramatic ambience, while African infrastructure programs channel public funds into efficient street lighting that doubles as a smart-city gateway. The ambient lighting market gains long-term upside as governments apply green-building codes and attract foreign direct investment.

Competitive Landscape
Global majors such as Signify, ams-OSRAM, and Acuity Brands face margin compression in hardware but unlock new recurring revenue in software and services. Signify booked USD 6.45 billion in 2024 sales yet posted a -38.9% total shareholder return, highlighting transition strain. Still, R&D spend at 4.34% of revenue underscores commitment to generative-AI tooling for customer support and product development..
Regional specialists leverage proximity advantages. Asian manufacturers supply OEM white-label luminaires at scale and speed, while European firms carve premium niches in architectural and human-centric portfolios. M&A remains active: Acuity Brands acquired Arize horticulture lines to pursue controlled-environment agriculture, signalling cross-vertical convergence..
White-space competition now centers on system integration that links lighting with HVAC, occupancy analytics, and security layers. Vendors able to package hardware, cloud software, and managed services secure sticky contracts. The ambient lighting market thus rewards ecosystem breadth over component price alone, realigning success metrics around data insights and user experience.
Ambient Lighting Industry Leaders
Acuity Brands Inc.
OSRAM Licht AG
Koninklijke Philips NV
Samsung Electronics Co. Ltd
Eaton Corporation Inc.
- *Disclaimer: Major Players sorted in no particular order

Recent Industry Developments
- May 2025: Wired4Signs USA introduced modular shelf-lighting kits that cut retail energy use up to 80%.
- May 2025: Ankur Lighting unveiled ultra-efficient COB and SMD LEDs that raise luminous efficacy while offering slimmer profiles for architects.
- April 2025: LTECH announced a global push to integrate its smart-lighting platform with third-party brands at major trade fairs.
- March 2025: Alcon Lighting’s design trend report projected commercial lighting to grow from USD 17.07 billion in 2024 to USD 27.38 billion by 2030.
- February 2025: Signify launched an EV-specific lightstrip for Xiaomi’s SU7, expanding its automotive footprint.
- January 2025: Inside Lighting’s Q1 2025 Pulse of Lighting report indicated flat distributor sales in Q4 2024 but flagged lighting controls as a top 2025 growth lever


Research Methodology Framework and Report Scope
Market Definitions and Key Coverage
Our study defines the ambient lighting market as the sale of lamps, luminaires, and lighting-control systems that provide diffuse, base-level illumination across residential, commercial, industrial, hospitality, healthcare, logistics, and automotive interiors. We include both new-build and retrofit installations, wired as well as wireless networked fixtures.
(Scope exclusion) Specialized stage, architectural show, and horticultural grow lights fall outside our scope.
Segmentation Overview
- By Offering
- Lamps and Luminaires
- Incandescent Lamps
- Halogen Lamps
- Fluorescent Lamps
- Light-Emitting Diode (LED)
- Lighting Controls
- Lamps and Luminaires
- By Installation Phase
- New Construction
- Retrofit and Renovation
- By Type
- Surface-mounted Light
- Track Light
- Strip Light
- Suspended Light
- Recessed Light
- By Lumen Output
- Sub 3 000 lm (Residential)
- 3 001 - 10 000 lm (Commercial)
- Above10 000 lm (Industrial and Outdoor)
- By Connectivity
- Wired (DALI, KNX)
- Wireless (Zigbee, BLE Mesh, Thread)
- By End User
- Residential
- Automotive
- Hospitality and Retail
- Healthcare
- Industrial and Logistics
- By Geography
- North America
- United States
- Canada
- Mexico
- Europe
- Germany
- United Kingdom
- France
- Italy
- Spain
- Nordics
- Rest of Europe
- Asia-Pacific
- China
- Japan
- South Korea
- India
- South East Asia
- Australia
- Rest of Asia-Pacific
- South America
- Brazil
- Rest of South America
- Middle East and Africa
- Middle East
- United Arab Emirates
- Saudi Arabia
- Rest of Middle East
- Africa
- South Africa
- Rest of Africa
- Middle East
- North America
Detailed Research Methodology and Data Validation
Primary Research
Mordor analysts interviewed lighting OEM product heads, LED chipset suppliers, building automation integrators, and facility managers across Asia-Pacific, North America, Europe, and the Gulf. These discussions clarified real-world average selling prices, retrofit uptake, and the pace at which wireless mesh controls displace wired protocols, allowing us to reconcile secondary patterns.
Desk Research
We draw on publicly available tier-one sources such as the International Energy Agency for lamp efficiency trends, UN Comtrade for cross-border fixture flows, LightingEurope and the National Electrical Manufacturers Association for shipment benchmarks, plus building-code updates published by the U.S. Department of Energy. Company filings gathered through D&B Hoovers and LED patent counts accessed via Questel help us gauge competitive intensity and pricing shifts. Government retrofit grant databases and regional construction starts from the World Bank anchor baseline demand, while news archives on Dow Jones Factiva frame quarterly volume shocks. The sources listed illustrate our approach; many additional references were reviewed for data checks and context validation.
Market-Sizing & Forecasting
A top-down build starts with 2024 installed-base estimates and new construction floor-area additions, which are then multiplied by lumen-per-square-foot norms and fixture replacement cycles. Results are cross-checked through selective bottom-up indicators, sampled vendor revenues, channel audits, and ASP × unit roll-ups to fine-tune totals. Key variables tracked include LED penetration rates, regional building completions, average retrofit cost per luminaire, policy-driven phase-outs of fluorescent lamps, and smart-home adoption ratios. Multivariate regression, combined with scenario analysis for energy-price swings, projects demand through 2030. Data gaps in supplier roll-ups are bridged using trade-weighted averages verified by expert calls.
Data Validation & Update Cycle
We pass every model through variance screening, anomaly flags, and two-step peer review before sign-off. Our team refreshes the dataset annually; material events, such as abrupt tariff shifts or landmark efficiency mandates, trigger interim revisions, and a final sense-check is completed immediately prior to publication.
Why Mordor's Ambient Lighting Baseline Commands Reliability
Published estimates often differ because analysts select unique scopes, price bases, and refresh cadences.
We acknowledge those differences upfront and show where they come from.
Benchmark comparison
| Market Size | Anonymized source | Primary gap driver |
|---|---|---|
| USD 75.76 B (2025) | Mordor Intelligence | |
| USD 74.59 B (2024) | Regional Consultancy A | Omits wireless controls and retrofit spend |
| USD 69.86 B (2025) | Global Consultancy B | Counts lamps only, excludes control hardware |
| USD 86.02 B (2025) | Industry Analytics C | Bundles smart and decorative lighting segments |
In summary, while other publishers swing higher or lower by stretching or trimming scope, our disciplined variable selection and yearly recalibration let decision-makers rely on numbers that mirror actual market mechanics.


Key Questions Answered in the Report
What is the current size of the ambient lighting market?
The ambient lighting market stands at USD 82.19 billion in 2026 and is projected to hit USD 123.53 billion by 2031.
Which region contributes the largest revenue?
Asia Pacific leads with 45.65% of global revenue and is also the fastest-growing region at a 12.35% CAGR through 2031.
Why are lighting controls growing faster than fixtures?
Controls deliver energy savings, data analytics, and human-centric benefits that drive stronger value propositions, leading to a 9.02% CAGR versus slower fixture growth.
How will wireless protocols shape future installations?
Wireless platforms such as Bluetooth Mesh enable scalable retrofits without new cabling, supporting a 12.90% CAGR in wireless connectivity revenue.
What drives the surge in automotive ambient lighting?
OEMs install customizable RGB systems to enhance safety cues and brand identity, pushing automotive applications to an 10.74% CAGR.
How do WELL and LEED standards influence office lighting upgrades?
Both certifications reward circadian-aligned lighting, prompting companies to adopt tunable-white LEDs that have shown 6% productivity gains and 15% lifts in creative output.
Page last updated on:


