Human Centric Lighting Market Size and Share
Market Overview
| Study Period | 2020 - 2031 |
|---|---|
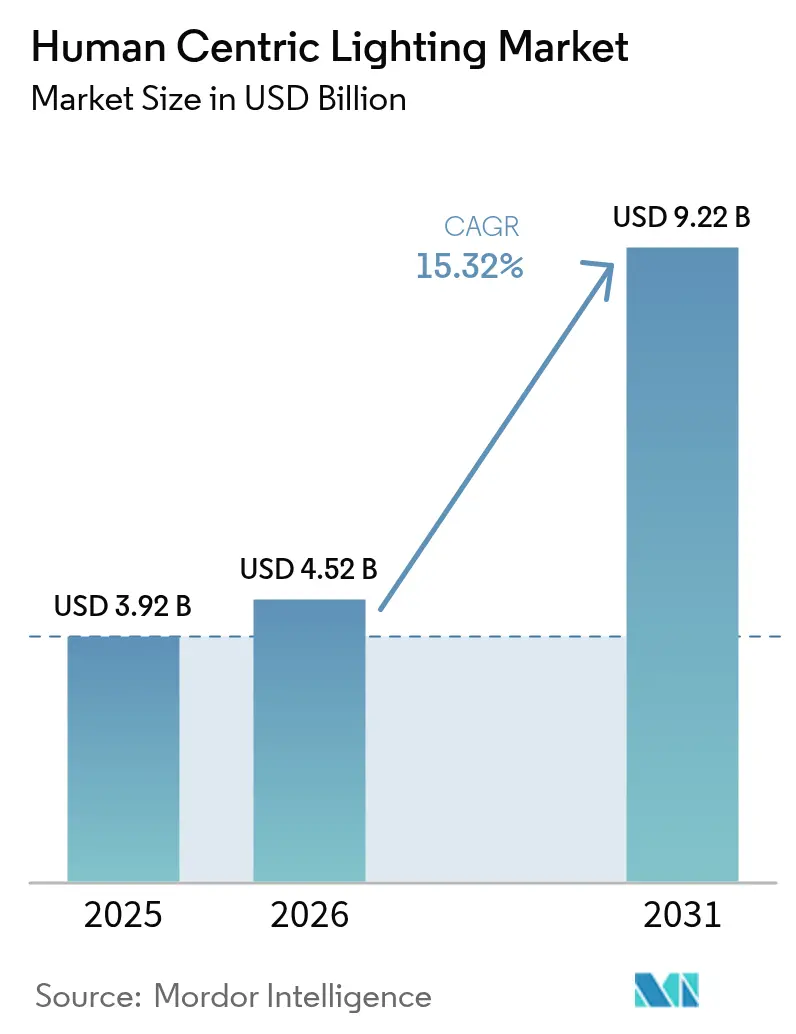
| Market Size (2026) | USD 4.52 Billion |
| Market Size (2031) | USD 9.22 Billion |
| Growth Rate (2026 - 2031) | 15.32% CAGR |
| Fastest Growing Market | Asia Pacific |
| Largest Market | Europe |
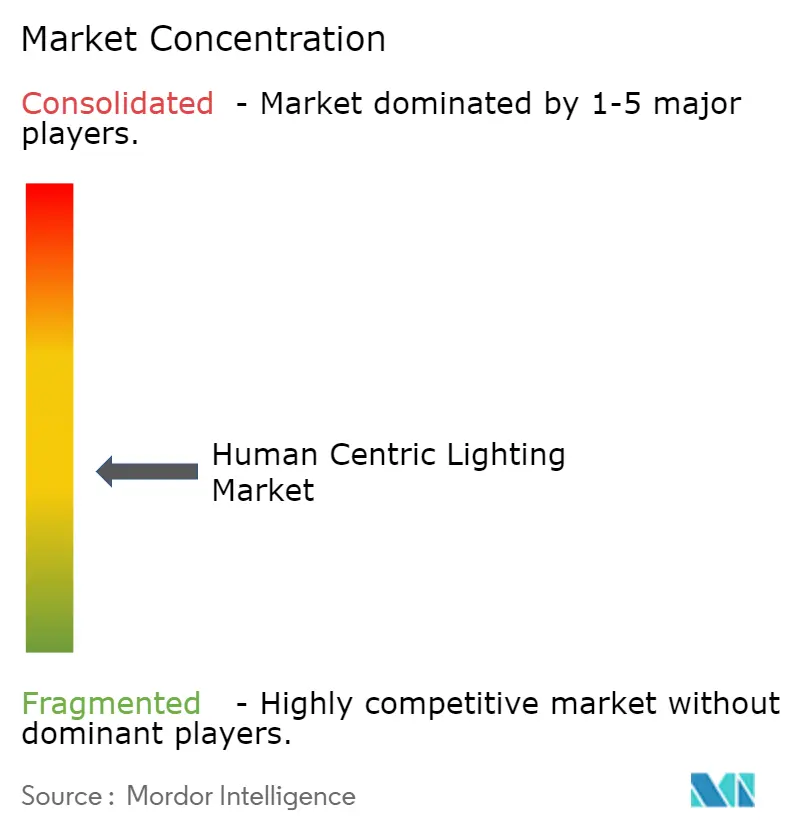
| Market Concentration | Medium |
Major Players *Disclaimer: Major Players sorted in no particular order Image © Mordor Intelligence. Reuse requires attribution under CC BY 4.0. | |
Human Centric Lighting Market Analysis by Mordor Intelligence
Human centric lighting market size in 2026 is estimated at USD 4.52 billion, growing from 2025 value of USD 3.92 billion with 2031 projections showing USD 9.22 billion, growing at 15.32% CAGR over 2026-2031. Adoption is shifting from simple illumination to biologically tuned systems that elevate health, productivity, and comfort. Advanced LED platforms with tunable spectra and IoT-based controls have turned lighting into a strategic wellness lever across offices, hospitals, and homes. Europe dominated uptake with a 37.4% share in 2024 as firms responded to strict workplace-wellbeing rules, while Asia Pacific posted the quickest expansion on the back of rapid LED price declines and rising awareness of light-health links. Demand for subscription models that bundle hardware, software, and maintenance is accelerating, and the arrival of scientific metrics such as melanopic equivalent daylight illuminance (mEDI) is bringing new clarity to performance claims.
Key Report Takeaways
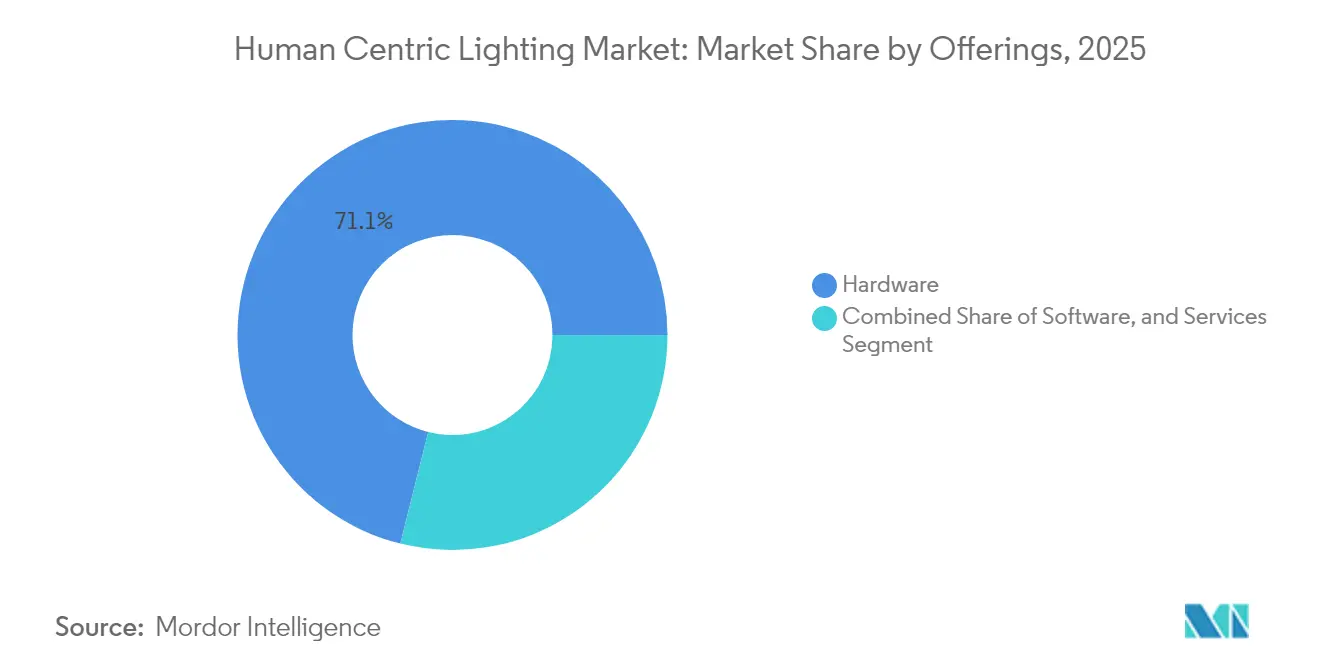
- By offering, hardware held 71.10% of the human centric lighting market share in 2025; services are expanding at a 22.88% CAGR through 2031.
- By installation type, retrofits accounted for 59.85% of the human centric lighting market size in 2025, while new installations are advancing at an 17.95% CAGR to 2031.
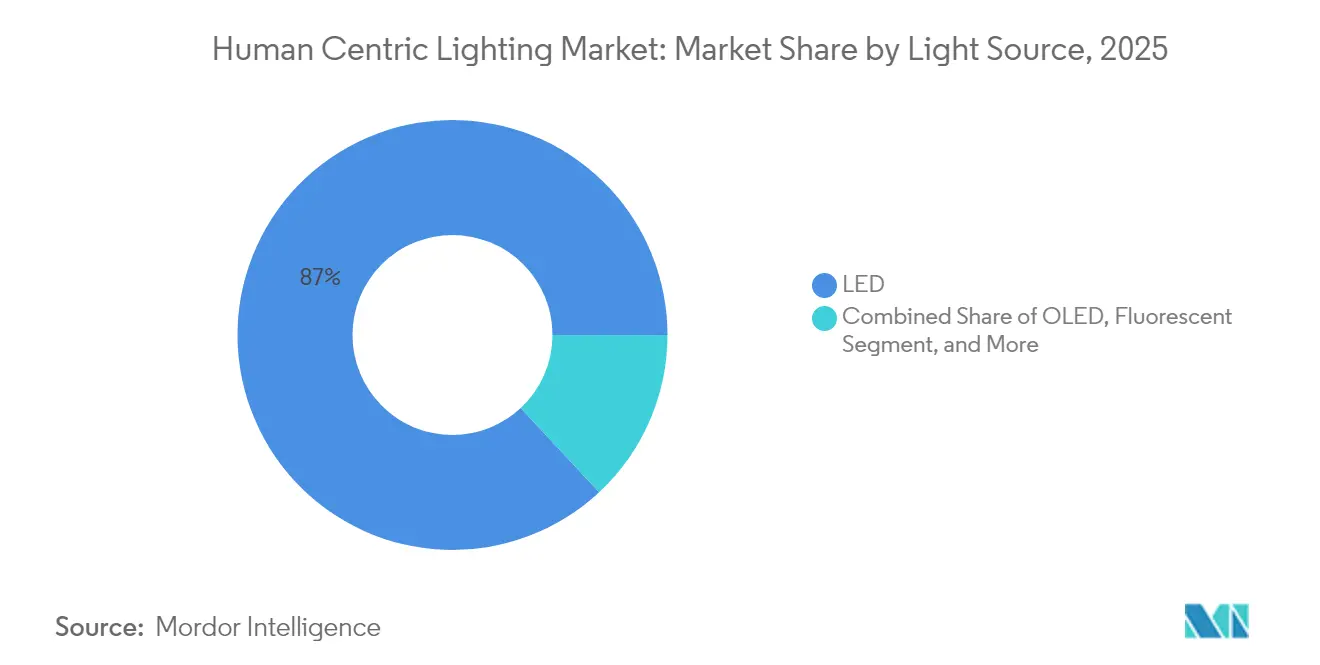
- By light source, LEDs dominated with 86.95% revenue share in 2025; OLED is forecast to expand at a 23.1% CAGR through 2031.
- By fixture type, troffers and panels led with 29.75% revenue share in 2025, whereas suspended luminaires are set to grow at an 18.25% CAGR during 2026-2031.
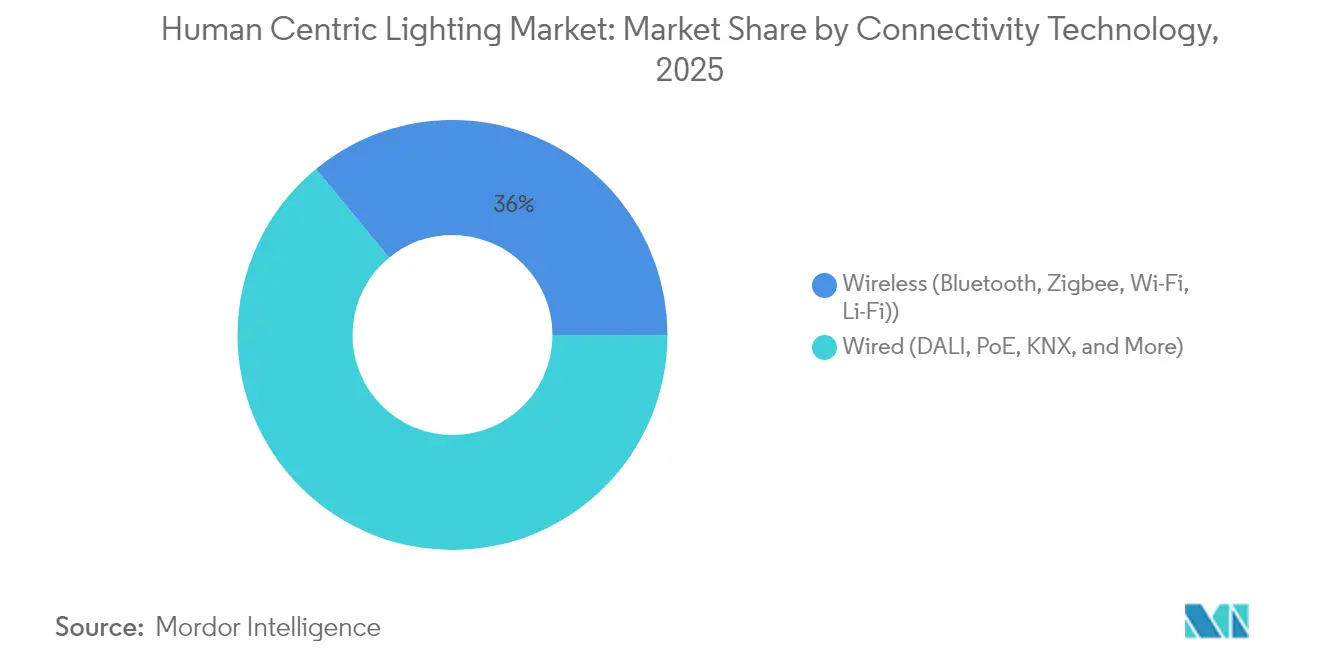
- By connectivity, wired systems captured a 64.05% share in 2025; wireless technologies are poised to post a 20.95% CAGR through 2031.
- By application, commercial spaces accounted for 53.60% of the human centric lighting market size in 2025; healthcare facilities are rising at a 17.05% CAGR through 2031.
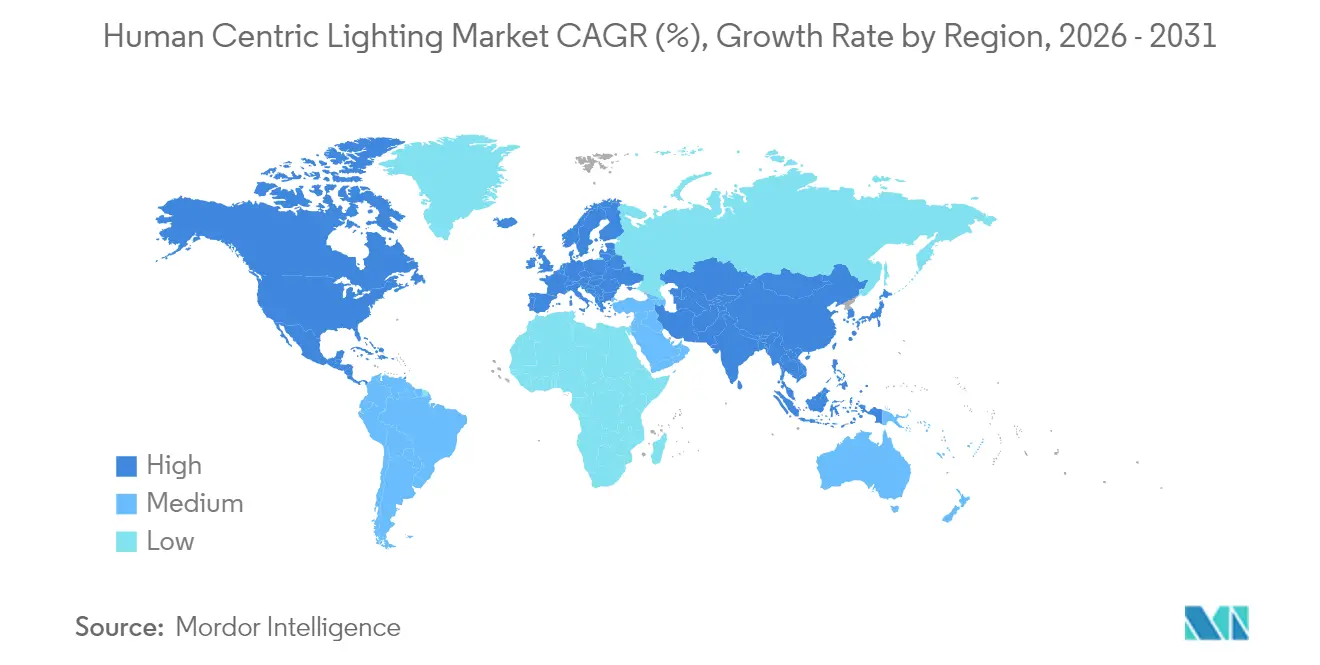
- By geography, Europe held 37.10% of the human centric lighting market share in 2025, while Asia Pacific shows the steepest regional CAGR of 19.65% for 2026-2031.
Note: Market size and forecast figures in this report are generated using Mordor Intelligence’s proprietary estimation framework, updated with the latest available data and insights as of 2026.
Global Human Centric Lighting Market Trends and Insights
Drivers Impact Analysis*
| Driver | (~) % Impact on CAGR Forecast | Geographic Relevance | Impact Timeline |
|---|---|---|---|
| Workplace-wellbeing mandates | +3.2% | Europe; spillover to North America | Medium term (2-4 years) |
| Energy-positive building regulations | +2.8% | North America; patterns emerging in Europe | Medium term (2-4 years) |
| LED price erosion enabling retrofits | +2.5% | Asia Pacific; global implications | Short term (≤ 2 years) |
| Circadian-aligned healthcare lighting demand | +2.1% | Global; strongest in Europe and North America | Medium term (2-4 years) |
| Smart-city pilots in Nordic municipalities | +1.9% | Nordics; broadening to Western Europe and North America | Medium term (2-4 years) |
| Lighting-as-a-Service revenue models | +1.7% | North America and Europe first; expanding worldwide | Long term (≥ 4 years) |
| Source: Mordor Intelligence | |||
Accelerated Workplace-Wellbeing Mandates in Europe
European policy has moved beyond basic occupational safety toward holistic wellbeing, prompting rapid adoption of tunable lighting in offices. Oxford University research linked higher employee well-being scores with stronger financial performance, reinforcing the business rationale.[1]Jan-Emmanuel De Neve, “Workplace Wellbeing and Firm Performance,” wellbeing.hmc.ox.ac.uk The EU Pay Transparency Directive has broadened corporate disclosures to include environmental quality, placing lighting under greater scrutiny. Field studies conducted by Alcon Lighting, showed that appropriate spectral tuning cut absenteeism by 4.5% and lifted creative output by 15% in office pilots. Companies now view lighting upgrades as a dual lever for wellbeing and sustainability, accelerating the specification of human-centric systems in new projects and major retrofits.
Regulatory Push for Energy-Positive Buildings in North America
The United States targets a 65% reduction in building-sector greenhouse-gas emissions by 2035, positioning advanced lighting controls as a pivotal lever.[2]U.S. Department of Energy, “Decarbonizing the U.S. Economy by 2050,” energy.gov The 2021 International Energy Conservation Code, recently adopted for federally backed housing, imposes stringent efficiency requirements that reward integrated lighting and controls. Networked systems have delivered 49% energy savings compared with LED-only upgrades, meeting both decarbonization and occupant-wellbeing objectives . Designers increasingly specify circadian-supportive luminaires alongside daylight and occupancy sensors to satisfy whole-building performance metrics.
Rapid LED Price Erosion Enabling Retrofits in Asia
LED component prices have declined steeply, placing tunable white features within reach of budget-constrained projects. Commercial facilities across China, India and Southeast Asia now retrofit existing fixtures with circadian-capable modules during routine renovations. Manufacturers bundle wellness benefits with established energy-savings narratives to unlock financing from green-building programs. The cost parity of human-centric upgrades is most compelling in 24/7 facilities where productivity gains compound with power reductions.
Demand for Circadian-Aligned Healthcare Lighting
Hospitals are adopting dynamic spectra that synchronize with patients’ biological rhythms. Clinical trials reported shorter recovery times and fewer medication errors under circadian-supportive lighting. Solutions such as BioUp raised melanopic daylight efficacy by 42%, delivering measurable biological effects in patient rooms and nurse stations. Standards bodies have begun referencing melanopic metrics, enabling facility managers to justify capital outlays with health outcomes data. The healthcare sector’s growing evidence base drives replication across long-term care, behavioral health, and outpatient settings.
Restraints Impact Analysis*
| Restraint | (~) % Impact on CAGR Forecast | Geographic Relevance | Impact Timeline |
|---|---|---|---|
| Vendor protocol interoperability gaps | -2.3% | Global; pronounced in large commercial portfolios | Medium term (2-4 years) |
| High complexity of human-factor validation | -1.8% | Worldwide; most acute in heavy-industry settings | Medium term (2-4 years) |
| Installer skill shortages in emerging markets | -1.5% | Asia Pacific, Middle East, Africa and South America | Short term (≤ 2 years) |
| ROI uncertainty for large-scale residential projects | -1.2% | Global; sharper in price-sensitive economies | Long term (≥ 4 years) |
| Source: Mordor Intelligence | |||
Limited Interoperability Across Vendor Protocols
Fragmented control standards raise integration costs and slow multi-site rollouts. United States Department of Energy studies found persistent terminology and communication mismatches that impede connected-lighting performance. Building owners often face vendor lock-in or must fund gateways that add complexity over the system lifecycle. DALI-2 certification programs improve prospects for plug-and-play operation, as seen in Siemens’ KNX/DALI gateway.[3]Siemens AG, “Siemens Facilitates Implementation of Human Centric Lighting,” assets.new.siemens.com Yet a unified global standard remains elusive, constraining volume procurement and cross-portfolio analytics.
Inadequate Installer Skill-Set in Emerging Economies
Human-centric lighting requires commissioning expertise in spectral tuning, sensor calibration, and circadian protocol design. Industry associations note a shortage of Certified Lighting Controls Professionals, especially outside mature markets. California’s training initiative illustrates the investment needed: 655 electricians completed advanced courses between 2022 and 2024.[4]California Energy Commission, “California Advanced Lighting Controls Training Program - Automated Demand Response,” energy.ca.govComparable programs are scarce in high-growth regions, leading to installation errors that erode performance and ROI. The skills gap is most acute in retrofits where legacy wiring and controls create additional complexity.
*Our forecasts treat driver/restraint impacts as directional, not additive. The impact forecasts reflect baseline growth, mix effects, and variable interactions.
Segment Analysis
By Offering: Services Outpace Hardware Growth
Hardware contributed 71.10% of 2025 revenue, anchored by luminaires, drivers, and sensors that enable spectral tuning. As financing models evolve, customers increasingly favor outcome-based contracts that bundle equipment, software, and maintenance. Subscription models reduce upfront capital, aligning costs with realized benefits. Several multinational providers now guarantee lighting performance metrics under multi-year service agreements. The human centric lighting market is therefore pivoting toward recurring revenue streams that appeal to asset-light corporate strategies.
Service revenue is forecast to climb at 22.88% annually through 2031, making it the fastest-growing component of the human centric lighting market. Providers monitor installations remotely, optimize scenes via cloud analytics, and update firmware over-the-air, ensuring continuous compliance with wellbeing standards. This data-driven approach strengthens client retention and opens pathways for cross-selling air-quality and space-use analytics.


By Installation Type: New Installations Gain Momentum
Retrofits held a 59.85% share in 2025 as organizations upgraded existing facilities to capture immediate wellbeing and energy gains. These projects delivered quick wins with minimal structural changes, reinforcing confidence in circadian-tuned lighting. However, architects now embed spectral design early in building programs. As a result, new installations are projected to grow at 17.95% CAGR through 2031, surpassing retrofit growth.
Integrating human-centric lighting at the design stage allows holistic coordination with HVAC, shading, and façade systems. Luminaire-level lighting controls create self-contained nodes that simplify commissioning and support granular personalization. Studies of integrated HVAC and lighting controls recorded a 69% drop in lighting energy use while maintaining circadian targets. Such gains reinforce the inclusion of dynamic lighting in green-building certifications.
By Light Source: OLED Emerges as Growth Leader
LED technology provided 86.95% of 2025 revenue due to superior efficacy, longevity, and controllability. It remains the backbone of the human centric lighting market, but OLED is taking share thanks to its diffuse glow, low glare, and flexible form factors. OLED revenue is projected to rise at a 23.1% CAGR through 2031.
Advances in quantum-dot phosphors improve circadian-relevant cyan output without sacrificing efficiency. Manufacturers also launch LED chip-on-board lines with higher melanopic to photopic ratios, enhancing biological impact. These upgrades sustain LED leadership yet open coexistence with OLED panels in premium applications where surface uniformity and design freedom carry weight.
By Fixture Type: Suspended Luminaires Lead Innovation
Troffers and panels delivered 29.75% of 2025 sales, reflecting their ubiquity in offices and schools. They offer a straightforward upgrade path to tunable white or RGBW modules. Yet suspended luminaires show the highest growth, at 18.25% CAGR, because they enable indirect distribution that balances horizontal and vertical illuminance, which is vital for circadian stimulation.
Three-dimensional printing is reshaping fixture manufacturing. Leading brands now print suspended luminaires to order, tailoring geometry, optics, and light output while trimming material waste. This flexibility supports architects who seek signature aesthetics alongside human-centric performance, broadening addressable demand.
By Connectivity Technology: Wireless Systems Expand Reach
Wired systems, led by DALI and KNX, captured 64.05% of 2025 revenue for their reliability in mission-critical environments. However, wireless protocols are advancing at 20.95% CAGR, fueled by simplified installation and lower labor costs in retrofits. Large Bluetooth-mesh deployments demonstrate stability in facilities exceeding 1,000 luminaires, eroding concerns about latency and security lighting.
Open-protocol gateways facilitate integration with building-automation and occupancy-analytics platforms. Siemens’ DALI-2 certified gateway shows how multi-vendor interoperability can be achieved without compromising control fidelity. Wireless adoption is strongest in tertiary education and hospitality sites, where downtime constraints favor non-intrusive upgrades.
By Application: Healthcare Facilities Drive Innovation
Commercial offices comprised 53.60% of 2025 revenue, anchored by well-documented links between lighting quality, productivity, and employee retention. Still, healthcare is the fastest-rising end-use, growing at 17.05% CAGR through 2031. Hospitals deploy dynamic spectra to align patient wards and nurses’ stations with natural circadian cycles. Clinical studies recorded measurable drops in recovery time, readmissions and fatigue‐related errors.
Educational settings are scaling human-centric upgrades to enhance student alertness. Industrial operators pursue circadian-supportive schemes to reduce accidents during night shifts. Residential demand remains nascent because ROI is harder to quantify, yet premium homebuilders are integrating sleep-optimized lighting in smart-home suites.
Geography Analysis
Europe led the human centric lighting market with a 37.10% share in 2025, propelled by strong worker-wellbeing regulation and municipal smart-lighting programs. Copenhagen’s retrofit of 18,800 light points demonstrated 55% energy savings while improving perceived safety and installation quality. EU directives on building performance continue to raise minimum lighting standards, and industry group Lighting Europe estimated that human-centric solutions could reach 7% of the region’s total lighting demand.
Asia Pacific is expanding at a 19.65% CAGR from 2026 to 2031, driven by urbanization and price declines in tunable LEDs. China spearheads premium installations in hospitality and corporate sectors, leveraging lighting quality to differentiate guest and tenant experience . The International Finance Corporation projected USD 1.5 trillion in green-building investment by 2035 across emerging Asian markets, creating fertile ground for circadian-aligned lighting. Workforce training and interoperability barriers temper the pace but do not alter the uptrend.
North America shows robust momentum under building-decarbonization mandates. The Department of Energy frames advanced lighting as a primary instrument for cutting electricity demand in commercial properties, Utilities promote luminaire-level controls through market-transformation initiatives, exemplified by the Ameren Illinois program that links rebates to connected-lighting adoption. Canadian jurisdictions follow a similar trajectory, blending wellness metrics into energy-code updates.

Competitive Landscape
The human centric lighting industry features a moderate concentration. Signify, ams OSRAM, and Acuity Brands leverage global channels and R&D scale to introduce platform-based ecosystems. Signify reported 114 million connected light points by 2022, underscoring installed-base leverage for service upsells. Specialized firms such as BIOS Lighting focus on spectral science and partner with semiconductor suppliers like Lumileds to accelerate productization.
Competition is shifting toward software and analytics that prove health and efficiency benefits. Vendors differentiate through cloud dashboards that visualize melanopic exposure and energy data in a single interface. Intellectual-property portfolios now emphasize algorithms and biological validation protocols rather than fixture hardware. Start-ups target niche opportunities in education and sleep health, while incumbents expand through acquisitions and venture investments that fill capability gaps.
Open-standard advocacy is becoming a strategic battleground. Firms that support DALI-2, Bluetooth Mesh, and API openness gain preferential access to multi-vendor projects. The ability to integrate seamlessly with HVAC and security systems boosts customer stickiness and reduces total ownership costs. As the market matures, enterprises with holistic service suites are expected to capture premium margins.
Human Centric Lighting Industry Leaders
Signify Lighting NV
OSRAM GmbH
Glamox SA
Zumtobel Group AG
Hubbell Inc.
- *Disclaimer: Major Players sorted in no particular order

Recent Industry Developments
- May 2025: Lextar Electronics launched advanced human-centric lighting solutions featuring Solar White LEDs that reach an Rf of 94 and an Rg of 99, mirroring natural sunlight.
- May 2025: Signify released research on circadian lighting’s effect on sleep quality among Formula 1 drivers, highlighting solutions including NatureConnect, BioUp, and Interact Circadian.
- March 2025: Inventronics completed a human-centric lighting upgrade at Fernandez Molina Offices in Madrid, using DALI PRO 2 IoT controls to meet WELL and LEED Platinum benchmarks.
- February 2025: Signify’s 2024 Annual Report showed its connected-lighting base had grown to 144 million light points and detailed product launches such as Bloombox office lighting and UltraEfficient outdoor luminaires.


Research Methodology Framework and Report Scope
Market Definitions and Key Coverage
Our study treats the human-centric lighting (HCL) market as the global revenue generated from tunable, circadian-supportive luminaires, drivers, controls, and enabling software that intentionally modulate spectrum and intensity to align with biological rhythms in built environments. According to Mordor Intelligence, only value captured at the first point of product sale is counted, with maintenance contracts and stand-alone daylight harvesting systems kept outside scope.
Scope exclusion: horticultural grow lights and pure architectural accent lighting are not considered.
Segmentation Overview
- By Offering
- Hardware
- Software
- Services
- By Installation Type
- New Installations
- Retrofit Installations
- By Light Source
- LED
- OLED
- Fluorescent
- Others
- By Fixture Type
- Downlights
- Troffers and Panels
- Suspended Luminaires
- Linear Strips and Wraps
- Others
- By Connectivity Technology
- Wired (DALI, PoE, KNX, etc.)
- Wireless (Bluetooth, Zigbee, Wi-Fi, Li-Fi)
- By Application
- Commercial
- Offices and Corporate
- Retail and Supermarkets
- Hospitality
- Healthcare Facilities
- Educational Institutions
- Industrial
- Manufacturing Plants
- Warehouses and Logistics
- Residential
- Public Infrastructure and Smart Cities
- Commercial
- By Geography
- North America
- United States
- Canada
- Mexico
- Europe
- Germany
- United Kingdom
- France
- Italy
- Spain
- Nordics (Denmark, Sweden, Norway, Finland)
- Rest of Europe
- Asia-Pacific
- China
- Japan
- South Korea
- India
- Southeast Asia
- Australia
- Rest of Asia-Pacific
- South America
- Brazil
- Argentina
- Rest of South America
- Middle East
- Gulf Cooperation Council Countries
- Turkey
- Rest of Middle East
- Africa
- South Africa
- Nigeria
- Rest of Africa
- North America
Detailed Research Methodology and Data Validation
Primary Research
Interviews with lighting designers, facility managers in hospitals and offices, and circadian science academics across North America, Europe, and Asia gave us firsthand insight on installed base saturation, payback expectations, and likely retrofit cadence. Short online surveys with IoT lighting integrators supplemented price-volume assumptions and regional warranty norms.
Desk Research
Our analysts began with public datasets such as Eurostat building stock surveys, U.S. DOE SSL program adoption tables, and Japan's JIS lighting standards, which reveal fixture counts, retrofit rates, and lumen efficacy trends. Trade bodies such as LightingEurope, IESNA, and the WELL Building Institute supply adoption benchmarks, while customs data scraped via Volza helps capture cross-border LED module flows. Company 10-Ks and investor decks offered average selling price (ASP) hints, and D&B Hoovers provided revenue splits for key vendors. The sources cited here illustrate the mix; many additional documents were consulted to verify numbers, terminologies, and regulatory triggers.
Market-Sizing & Forecasting
We applied a top-down reconstruction that starts with regional commercial floor area, divides by typical fixture density, multiplies by HCL penetration rates signaled in primary calls, and is then adjusted with average ASPs from desk work. A selective bottom-up cross-check rolls up sampled vendor shipments to validate totals. Key model drivers include: 1) retrofit share of luminaires, 2) LED cost erosion per kilolumen, 3) WELL and EN 12464-1 compliant floor space, 4) healthcare bed additions, and 5) average work-from-home hours that influence residential uptake. A multivariate regression links these variables to historical HCL revenues and feeds an ARIMA overlay to project 2026-2030 paths. Gaps in vendor shipment data are bridged by triangulating customs units with import-weighted ASPs.
Data Validation & Update Cycle
Outputs pass variance checks against independent shipment tallies and energy-code compliance statistics. A second analyst reviews anomalies before sign-off. Reports refresh every twelve months, and interim re-checks are triggered by material events such as new EU lighting directives.
Why Our Human Centric Lighting Baseline Commands Reliability
Published numbers diverge because firms pick different base years, include dissimilar services, and assume varied LED price curves.
Key gap drivers involve whether retrofit labor is booked, how aggressively smart controls are layered, and the cadence at which currency conversions are fixed.
Benchmark comparison
| Market Size | Anonymized source | Primary gap driver |
|---|---|---|
| USD 3.92 B (2025) | Mordor Intelligence | - |
| USD 3.53 B (2024) | Global Consultancy A | Broader inclusion of daylight sensors and consultancy fees, older base year |
| USD 4.23 B (2024) | Industry Association B | Counts luminaires shipped to horticulture and entertainment, assumes faster LED ASP decline |
| USD 3.66 B (2024) | Regional Consultancy C | Estimates built from installed fixture counts without ASP normalization across regions |
The comparison shows that when scope boundaries, input variables, and refresh cadence are disciplined, Mordor's balanced figure offers decision-makers a dependable starting point that can be traced back to transparent, repeatable steps.


Key Questions Answered in the Report
What is the current size of the human centric lighting market?
The human centric lighting market stands at USD 4.52 billion in 2026 and is projected to reach USD 9.22 billion by 2031.
Which segment contributes most to revenue today?
Hardware accounts for 71.10% of 2025 revenue because luminaires, drivers and sensors remain essential components of any circadian-tuned system.
Why is Europe ahead in adoption?
Strict workplace-wellbeing regulations, city-scale LED retrofits and proactive corporate sustainability targets gave Europe a 37.10% share in 2025.
How fast is Asia Pacific growing?
Asia Pacific is forecast to post a 19.65% CAGR between 2026 and 2031, the highest of any region, as LED price declines stimulate large-scale retrofits.
What hurdles slow broader rollout?
Interoperability gaps among control protocols and shortages of trained installers in emerging economies raise upfront costs and delay commissioning.
Which fixture category is expected to grow most rapidly?
Suspended luminaires are projected to expand at an 18.25% CAGR because their direct-indirect distribution supports balanced circadian illumination.
Page last updated on:


