Chloroacetyl Chloride Market Size and Share
Market Overview
| Study Period | 2021 - 2031 |
|---|---|
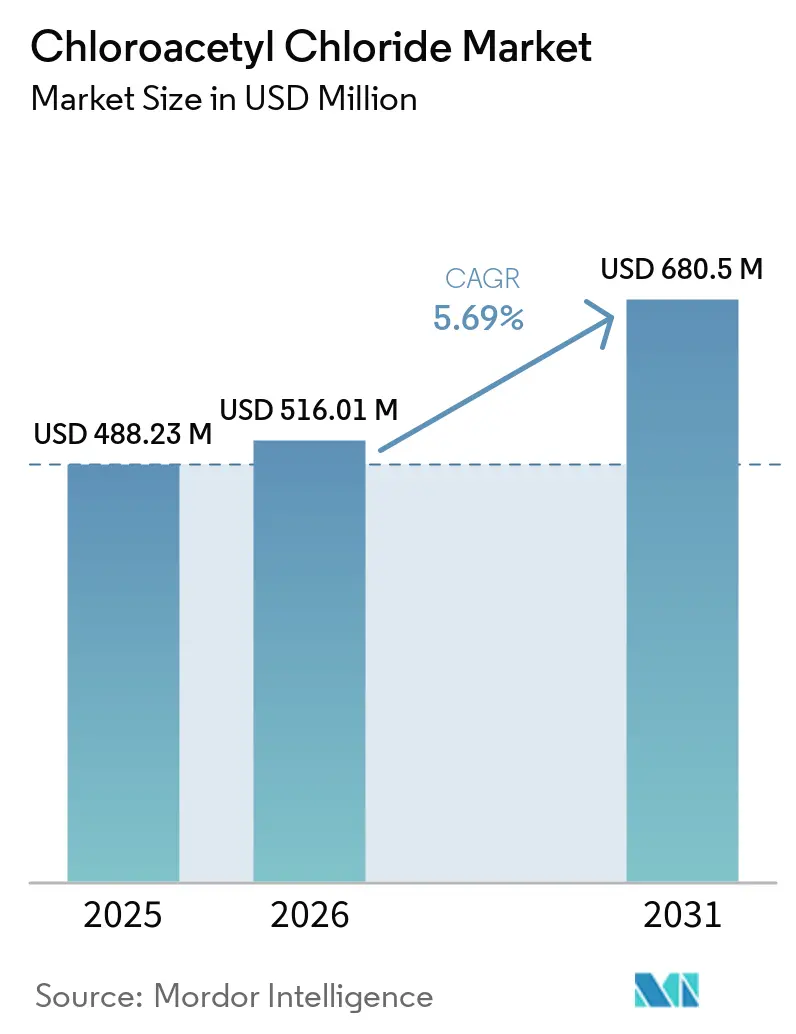
| Market Size (2026) | USD 516.01 Million |
| Market Size (2031) | USD 680.5 Million |
| Growth Rate (2026 - 2031) | 5.69% CAGR |
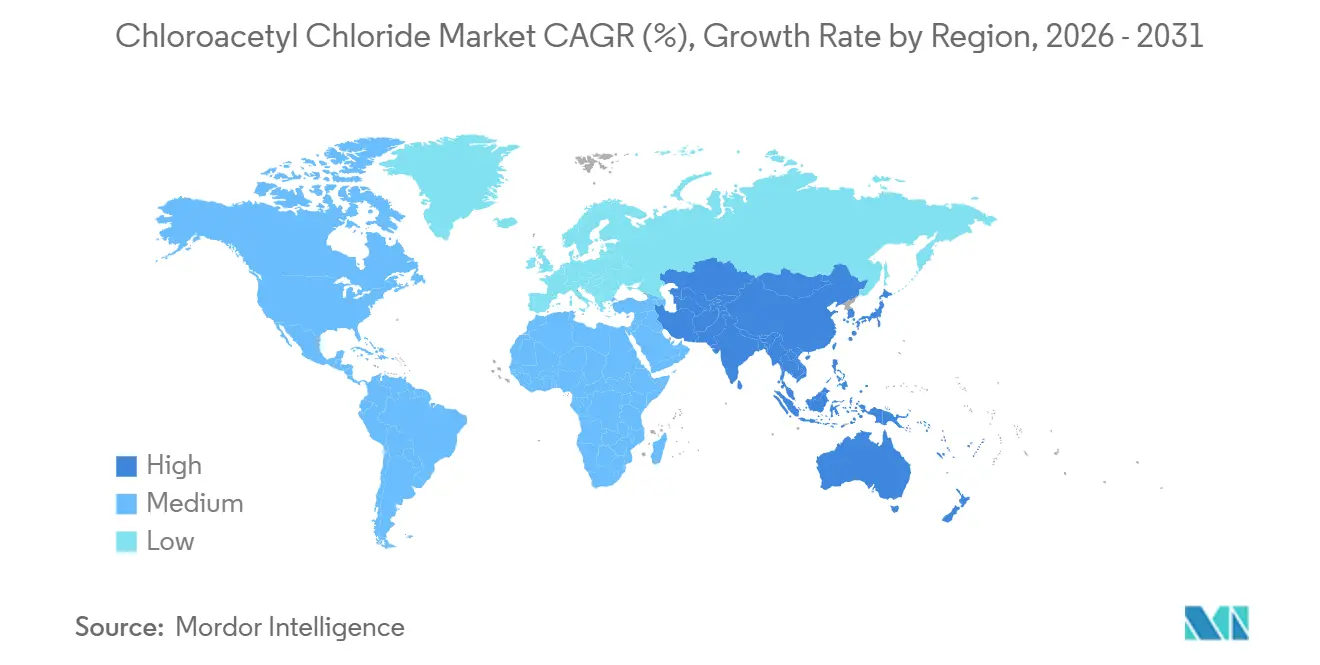
| Fastest Growing Market | Asia Pacific |
| Largest Market | Asia Pacific |
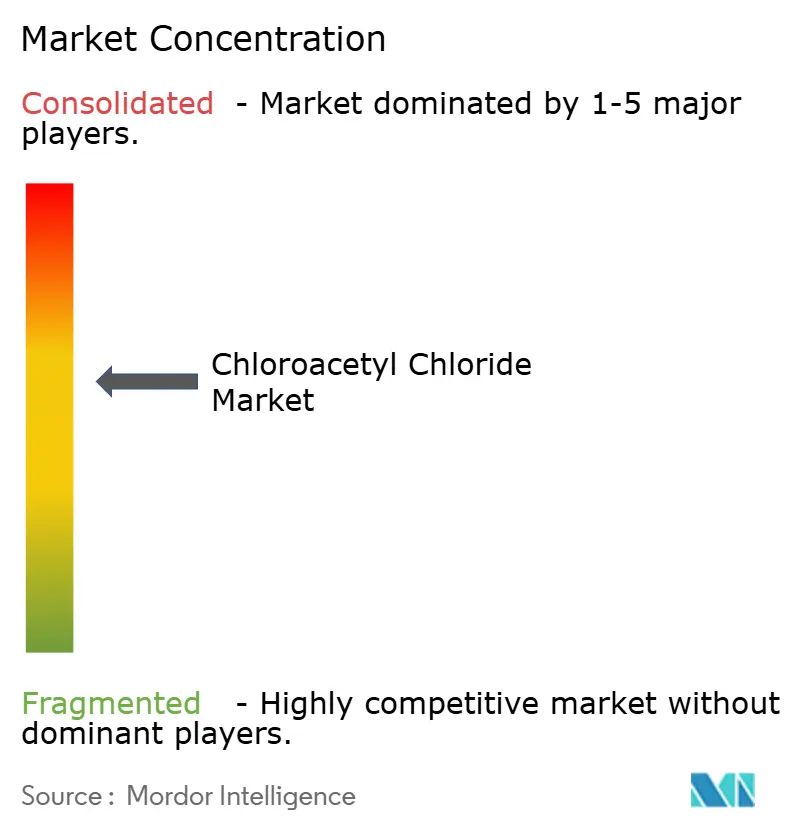
| Market Concentration | Medium |
Major Players *Disclaimer: Major Players sorted in no particular order Image © Mordor Intelligence. Reuse requires attribution under CC BY 4.0. | |
Chloroacetyl Chloride Market Analysis by Mordor Intelligence
The Chloroacetyl Chloride Market size is projected to expand from USD 488.23 million in 2025 and USD 516.01 million in 2026 to USD 680.5 million by 2031, registering a CAGR of 5.69% between 2026 to 2031. Continuous-flow chlorination improves productivity, while the increasing outsourcing of pharmaceutical Active Pharmaceutical Ingredients (APIs) to India and China, along with a tighter supply chain for semiconductor photoresists, expands the market footprint for chloroacetyl chloride. The Asia-Pacific region holds a cost advantage due to lower chlorine and power prices compared to Europe. Furthermore, India's production-linked incentive program for bulk drugs allocates USD 830 million to develop additional chlorinated-intermediate capacity. In Europe, the demand for high-purity grades for Extreme Ultraviolet (EUV) lithography, backward integration by surfactant manufacturers, and the adoption of green-chemistry retrofits present growth opportunities. However, margin risks remain as acetic acid and chlorine prices fluctuate by 20% within a quarter, and hazardous-waste regulations in China and India increase compliance costs by 8-12%.
Key Report Takeaways
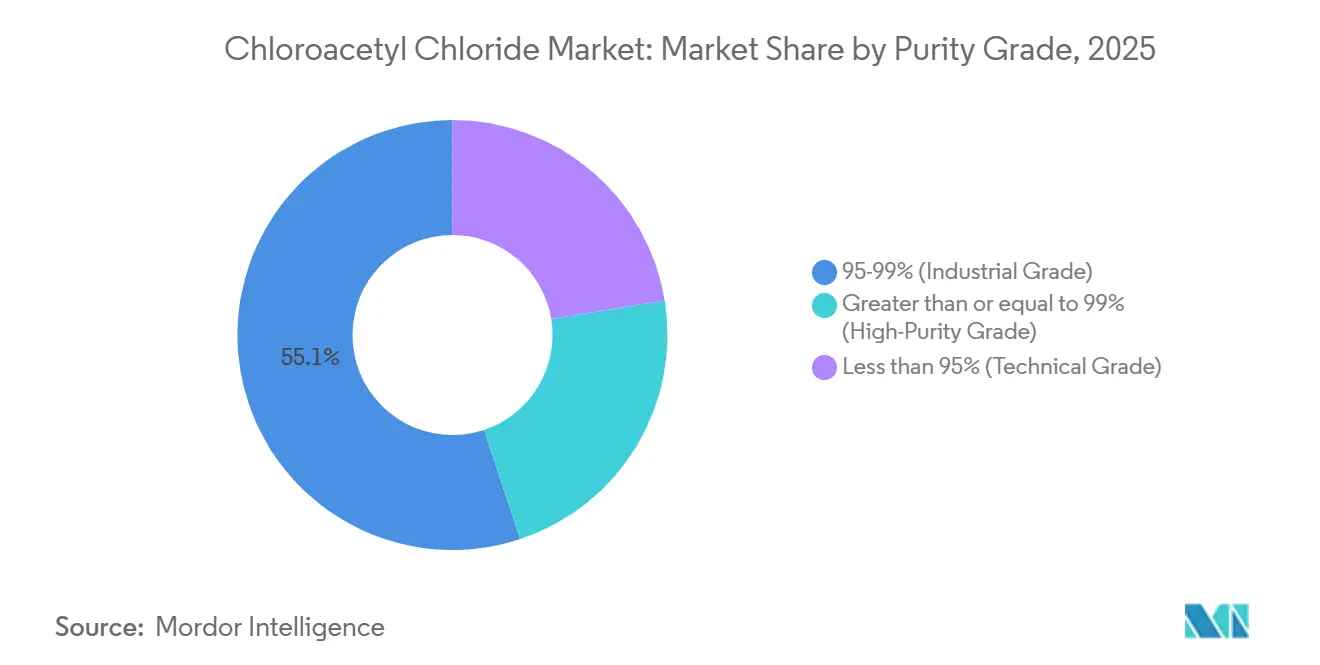
- By purity grade, industrial-grade material led with 55.11% of 2025 revenue, while high-purity grade is the fastest-growing at a 5.77% CAGR through 2031.
- By application, herbicide intermediates captured 43.11% share in 2025; pharmaceutical intermediates are projected to expand at a 5.97% CAGR through 2031.
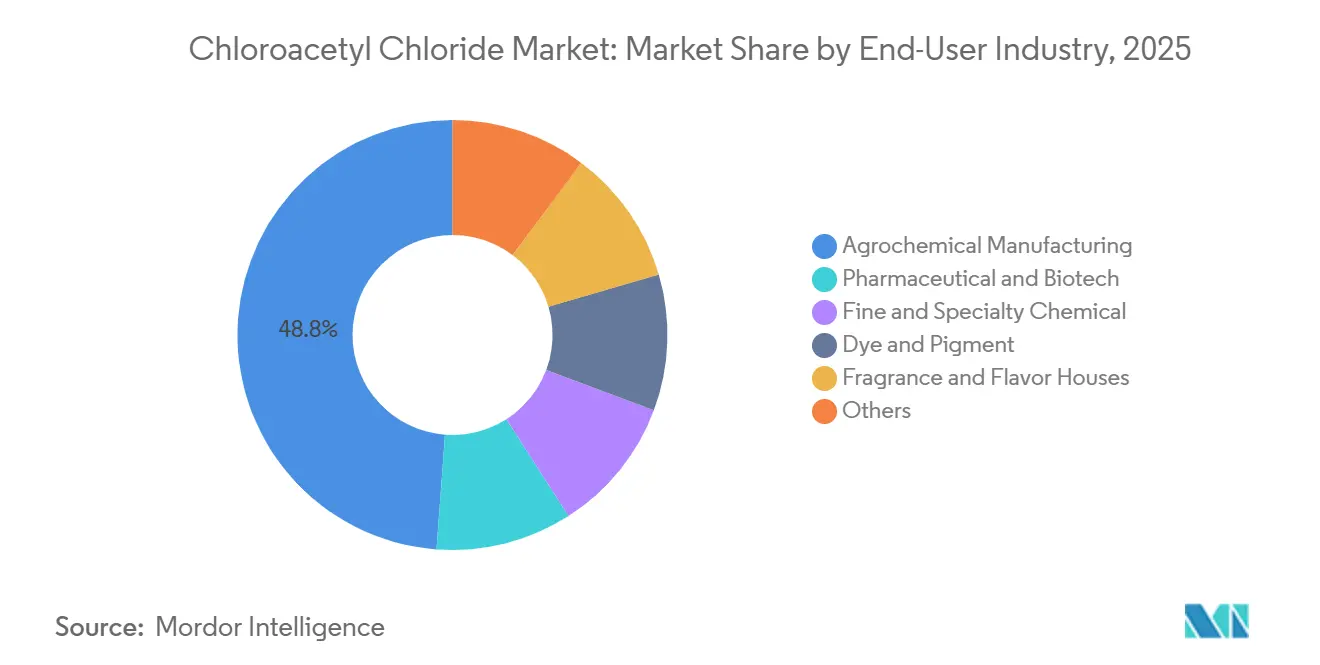
- By end-user industry, agrochemical manufacturing held 48.82% demand in 2025, and pharmaceutical and biotech end users will grow at a 5.88% CAGR to 2031.
- By geography, Asia-Pacific commanded 50.89% of the 2025 chloroacetyl chloride market share and is also the fastest-growing region at a 6.03% CAGR through 2031.
Note: Market size and forecast figures in this report are generated using Mordor Intelligence’s proprietary estimation framework, updated with the latest available data and insights as of January 2026.
Global Chloroacetyl Chloride Market Trends and Insights
Drivers Impact Analysis*
| Drivers | (~) % Impact on CAGR Forecast | Geographic Relevance | Impact Timeline |
|---|---|---|---|
| Escalating pharmaceutical API outsourcing | +1.2% | India, China, spillover to North America and Europe | Medium term (2-4 years) |
| Capacity expansion in Asia bulk chlorination | +0.9% | China, India, and global pricing influence | Short term (≤ 2 years) |
| Shift to continuous-flow chlorination | +0.8% | Global, early adoption in Europe and North America | Medium term (2-4 years) |
| Photo-acid generators for EUV lithography | +0.7% | Taiwan, South Korea, Japan, United States | Long term (≥ 4 years) |
| Rising captive use in specialty surfactants | +0.6% | North America and Europe's personal-care hubs, global spill | Medium term (2-4 years) |
| Source: Mordor Intelligence | |||
Escalating Pharmaceutical API Outsourcing to India and China
India's production-linked incentive scheme, with an allocation of USD 830 million, supports 53 bulk drugs and 215 starting materials through 2025[1]Department of Pharmaceuticals, “Production-Linked Incentive Scheme,” chemicals.gov.in. This has resulted in the establishment of several greenfield chlorination units. In 2025, Laxmi Organic invested USD 22 million to expand its capacity for acetyl intermediates, focusing on anti-diabetic and anti-hypertensive active pharmaceutical ingredients (APIs). In 2024, Shandong Xinhua invested USD 275 million in research and development (R&D) to enhance continuous-process routes, achieving a 40% reduction in cycle time. To address geopolitical risks, major Western pharmaceutical companies are now sourcing chlorinated building blocks from both India and China. This transition has shifted 70% of volumes previously produced in Europe or North America. Additionally, there is a significant increase in capacity certified to current Good Manufacturing Practices (cGMP) and International Organization for Standardization (ISO) 9001 standards, ensuring sustained demand through 2031.
Capacity Expansion Momentum Among Asian Producers
Shivtek Spechemi plans to increase its Indian production capacity from 150,000 tons per year (tpy) to 650,000 tons per year (tpy) by 2029. This expansion will involve two new plants located on an 8-acre parcel adjacent to Bodal’s Rajpura chlor-alkali site. The site provides access to pipeline chlorine and reduces logistics costs by 30%. In Thailand, AGC Vinythai’s caustic soda production expansion in 2026 will double its polyvinyl chloride (PVC) output and generate a chlorine by-product for downstream chlorinated intermediates[2]Chemical Industry Digest, “AGC Vinythai Expansion,” chemindigest.com . Electricity tariffs in Asia are 40% lower compared to Europe, where companies such as Fortischem, Spolana, and Arkema have ceased operations due to high gas prices. This cost difference positions the Asia-Pacific region as a key export hub through 2031.
Shift Toward Continuous-Flow Chlorination
In a 2025 study, a microreactor achieved a yield of 98.5% and a purity of 99.2% while reducing energy consumption by half per kilogram. CABB Group, with a EUR 50 million investment, is retrofitting its site in Kokkola, Finland, targeting a 25% reduction in chlorine usage and compliance with the European Union (EU) Industrial Emissions Directive. Small and medium enterprises (SMEs) in India and China are adopting modular flow reactors priced between USD 0.5 to 1 million, offering a payback period of under two years. This technology enables broader access to high-purity outputs and encourages traditional batch producers to modernize or adapt to changing market dynamics.
Emergence of Photo-Acid Generators for EUV Lithography
Photo-acid generators for extreme ultraviolet (EUV) lithography at 13.5 nm require quantum yields exceeding 0.8 and acid diffusion lengths under 5 nm. In 2025, ASML delivered 70 EUV tools. By 2027, semiconductor fabrication plants (fabs) in Arizona and Texas, both located in the United States, are projected to collectively utilize up to 15 tons of chloroacetyl chloride with a purity of greater than or equal to 99.5%. Anupam Rasayan's acquisition of Jayhawk Fine Chemicals for USD 150 million provides it with ISO 14644-1 Class 5 cleanrooms and strengthens its position in the U.S. semiconductor supply chain. Following the introduction of High-NA EUV tools after 2027, the consumption of photo-acid generators (PAG) per wafer is expected to double, potentially constraining the supply of ultra-high-purity material.
Restraints Impact Analysis*
| Restraints | (~) % Impact on CAGR Forecast | Geographic Relevance | Impact Timeline |
|---|---|---|---|
| Volatile chlorine and acetic-acid prices | −0.8% | Global, most acute in Asia-Pacific and Europe | Short term (≤ 2 years) |
| Hazardous-waste disposal bottlenecks | −0.5% | India, China, Southeast Asia, South America | Medium term (2-4 years) |
| Insurance-premium spikes for chlorinated plants | −0.3% | India, Southeast Asia, Middle East | Short term (≤ 2 years) |
| Source: Mordor Intelligence | |||
Volatile Chlorine and Acetic-Acid Feedstock Prices
In March 2026, acetic acid spot prices ranged between USD 450-550 per ton across key regions. European chlorine prices exceeded USD 220 per ton due to capacity closures. For non-integrated producers, a USD 50 per ton increase in either feedstock results in a 6-8% rise in production costs. Pipeline chlorine agreements, such as the Shivtek-Bodal deal, and backward integration into acetic acid help mitigate some risks. However, earnings before interest, taxes, depreciation, and amortization (EBITDA) for smaller players can still fluctuate by 15-20% within a quarter.
Hazardous-Waste Disposal Bottlenecks in Emerging Markets
China's 2025 regulations limit landfill disposal to 5% of waste volume and require closed-loop solvent recovery, increasing compliance costs by 8-12%. India's 2024 amendment enforces extended-producer responsibility (EPR) for chlorinated solvents. With treatment capacity lagging behind generation by 3.7 million tons annually, stockpiling or higher-cost disposal becomes necessary. Additionally, incineration shortages in Indonesia and Vietnam increase the likelihood of unauthorized waste disposal.
*Our forecasts treat driver/restraint impacts as directional, not additive. The impact forecasts reflect baseline growth, mix effects, and variable interactions.
Segment Analysis
By Purity/Grade: Semiconductor-Driven Shift Toward High Purity
In 2025, industrial-grade material accounted for 55.11% of the chloroacetyl chloride market, addressing the requirements of cost-focused agrochemical producers. Meanwhile, high-purity grade is projected to grow at a 5.77% compound annual growth rate (CAGR) through 2031, driven by manufacturers in the United States, Taiwan, and South Korea, who require metallic impurities below 10 parts per billion (ppb). Tokyo Chemical Industry and Merck KGaA, through proprietary distillation, control over 99% of the supply, while Chinese competitors, utilizing continuous-flow reactors, achieve 98.5% purity at a competitive cost.
Semiconductor-related orders contribute directly to higher profit margins: the installation of each extreme ultraviolet (EUV) tool increases annual demand by 1.5-2 tons for materials with a purity of 99.5% or higher, and after 2027, High-NA upgrades are expected to double material usage per wafer. In contrast, the technical grade, which serves the dye and pigment industries, is experiencing slower growth. As manufacturers impose stricter impurity limits, the gap in purity levels is anticipated to widen, supporting price premiums for ultra-high-purity materials while maintaining stable demand for the cost-efficient industrial grade.


By Application: Pharma Intermediates Overtake Herbicides
In 2025, demand for herbicide intermediates, driven by acetochlor and metolachlor production in China, India, and Brazil, represented 43.11% of the market. However, pharmaceutical intermediates are projected to grow at a compound annual growth rate (CAGR) of 5.97% through 2031, supported by the expansion of tuberculosis and glucagon-like peptide-1 (GLP-1) diabetes therapies in emerging markets.
As the World Health Organization (WHO) intensifies its detection targets, thioacetazone consumption is increasing. Additionally, chloroacetyl chloride is essential for attaching side chains to GLP-1 analogs. Applications in specialty surfactants are driven by the rising demand for sulfate-free personal care products. This growth in pharmaceuticals and surfactants is expected to reduce the application gap with herbicides by the end of the decade.
By End-User Industry: Pharma and Biotech Gain Share
China's output of 1.2 million tons of acetochlor has accounted for agrochemical manufacturing's 48.82% share of the 2025 demand. Meanwhile, the pharmaceutical and biotechnology sectors, supported by India's USD 130 billion Active Pharmaceutical Ingredient (API) export target, are projected to grow at a Compound Annual Growth Rate (CAGR) of 5.88% through 2031.
Fine-chemical companies address specialized demands such as photoresists, fragrances, and antioxidants. Adherence to ISO 9001 (Quality Management System) and ISO 14001 (Environmental Management System) standards is increasingly becoming a requirement for global pharmaceutical clients, benefiting certified suppliers like Laxmi Organic, CABB, and Zhejiang Yongtai. While agrochemicals are expected to retain a share exceeding 40% in 2031, the gap with the pharmaceutical sector is narrowing annually.
Geography Analysis
In 2025, the Asia-Pacific region held a 50.89% share of the chloroacetyl chloride market and is projected to grow at a 6.03% CAGR from 2026 to 2031. In 2025, the region accounted for over half of the global volume. Countries like China, India, Japan, and South Korea benefit from low power costs and an integrated chlor-alkali feed, ensuring the region's profitability in the chloroacetyl chloride market. Additionally, strategies like continuous-flow retrofits, pipeline chlorine deals, and export-oriented tax incentives strengthen this competitive position.
In North America, brownfield semiconductor projects in states like Arizona, Ohio, and Texas are driving demand for chloroacetyl chloride, especially for grades of 99.5% purity and above. While stringent hazardous-material regulations and higher labor costs moderate domestic output in the United States, free-trade agreements with Mexican toll producers ensure a balanced and secure supply. Furthermore, Jayhawk’s acquisition by an Indian entity introduces an Asia-linked cost advantage to its U.S. manufacturing, combining cost efficiency with strategic proximity.
Europe's growth depends on investments in emission-control measures. For instance, CABB's EUR 50 million upgrade in Kokkola reduces chlorine consumption and complies with the Industrial Emissions Directive. However, challenges like European gas price volatility and a shrinking chlor-alkali base limit long-term growth. Meanwhile, South America and the Middle East account for less than 10% of global revenues but offer supply flexibility. For example, Qatar Vinyl's chlorine stream could potentially support a chlorinated-intermediate hub on the Gulf Coast, catering to Africa's growing agrochemical market.

Competitive Landscape
The chloroacetyl chloride market is moderately consolidated. The key companies by volume include CABB Group GmbH, Tokyo Chemical Industry Co., Ltd., Shandong Xinhua Pharma, Hefei TNJ Chemical Industry Co., Ltd., and Kerry Group plc. Regional companies are focusing on ultra-high-purity and environmentally compliant grades.
Technology adoption differentiates market participants: continuous-flow reactors improve yields from 92% to 98.5% and reduce chlorine usage by 15-20%. This advancement allows mid-tier firms to compete on cost while meeting International Organization for Standardization (ISO) 9001 quality standards.
Patent activity is concentrated around extreme ultraviolet (EUV) photo-acid chemistries and electrolytic green-chlorination. Merck KGaA, Tokyo Chemical Industry, and Shin-Etsu hold a significant share of EUV-related intellectual property. Increasing customer requirements for ISO 14001 and International Electrotechnical Commission (IEC) 61511 compliance are raising entry barriers. This trend could result in a more concentrated market by 2031, as smaller, uncertified plants may face challenges in securing global tenders.
Chloroacetyl Chloride Industry Leaders
CABB Group GmbH
Tokyo Chemical Industry Co., Ltd.
Shandong Xinhua Pharma
Hefei TNJ Chemical Industry Co.,Ltd.
Kerry Group plc.
- *Disclaimer: Major Players sorted in no particular order

Recent Industry Developments
- February 2026: Anupam Rasayan acquired Jayhawk Fine Chemicals from CABB Group for USD 150 million, including ISO 14644-1 Class 5 cleanrooms located near U.S. semiconductor fabrication facilities. This acquisition strengthens Anupam Rasayan's position in the production of chloroacetyl chloride, a key chemical used in various applications.
- April 2025: Shivtek Spechemi announced a USD 76 million investment plan to establish two specialty chemical plants in Gujarat and Rajasthan. These facilities aim to enhance India's domestic production capacity for high-grade chlorinated compounds, including Chloroacetyl Chloride (CAC), a key intermediate widely used in agrochemicals, pharmaceuticals, and other industrial applications.


Global Chloroacetyl Chloride Market Report Scope
Chloroacetyl chloride, classified as an acyl chloride, is a reactive organic compound. This colorless to yellowish liquid has a distinct, strong odor.
The chloroacetyl chloride market is segmented by purity/grade, application, end-user industry, and geography. By purity/grade, the market is segmented into 95-99% (industrial grade), greater than or equal to 99% (high-purity grade), and less than 95% (technical grade). By application, the market is segmented into herbicides (e.g., dichloroacetanilide), plant growth regulators and safeners, pharmaceutical intermediates (e.g., thioacetazone), dyes and pigments precursors, fragrances and flavors intermediates, photographic and imaging chemicals, specialty surfactants and quats, and others. By end-use industry, the market is segmented into agrochemical manufacturing, pharmaceutical and biotech, fine and specialty chemical, dye and pigment, fragrance and flavor houses, and others. The report also covers the market size and forecasts for chloroacetyl chloride in 17 countries across major regions. The market sizes and forecasts are provided in terms of value (USD).
| 95-99% (Industrial Grade) |
| Greater than or equal to 99% (High-Purity Grade) |
| Less than 95% (Technical Grade) |
| Herbicides (e.g., Dichloroacetanilide) |
| Plant Growth Regulators and Safeners |
| Pharmaceutical Intermediates (e.g., Thioacetazone) |
| Dyes and Pigments Precursors |
| Fragrances and Flavors Intermediates |
| Photographic and Imaging Chemicals |
| Specialty Surfactants and Quats |
| Others |
| Agrochemical Manufacturing |
| Pharmaceutical and Biotech |
| Fine and Specialty Chemical |
| Dye and Pigment |
| Fragrance and Flavor Houses |
| Others |
| Asia-Pacific | China |
| India | |
| Japan | |
| South Korea | |
| ASEAN Countries | |
| Rest of Asia-Pacific | |
| North America | United States |
| Canada | |
| Mexico | |
| Europe | Germany |
| France | |
| United Kingdom | |
| Italy | |
| Spain | |
| Russia | |
| NORDIC Countries | |
| Rest of Europe | |
| South America | Brazil |
| Argentina | |
| Rest of South America | |
| Middle-East and Africa | Saudi Arabia |
| South Africa | |
| Rest of Middle-East and Africa |
| By Purity/Grade | 95-99% (Industrial Grade) | |
| Greater than or equal to 99% (High-Purity Grade) | ||
| Less than 95% (Technical Grade) | ||
| By Application | Herbicides (e.g., Dichloroacetanilide) | |
| Plant Growth Regulators and Safeners | ||
| Pharmaceutical Intermediates (e.g., Thioacetazone) | ||
| Dyes and Pigments Precursors | ||
| Fragrances and Flavors Intermediates | ||
| Photographic and Imaging Chemicals | ||
| Specialty Surfactants and Quats | ||
| Others | ||
| By End-user Industry | Agrochemical Manufacturing | |
| Pharmaceutical and Biotech | ||
| Fine and Specialty Chemical | ||
| Dye and Pigment | ||
| Fragrance and Flavor Houses | ||
| Others | ||
| By Geography | Asia-Pacific | China |
| India | ||
| Japan | ||
| South Korea | ||
| ASEAN Countries | ||
| Rest of Asia-Pacific | ||
| North America | United States | |
| Canada | ||
| Mexico | ||
| Europe | Germany | |
| France | ||
| United Kingdom | ||
| Italy | ||
| Spain | ||
| Russia | ||
| NORDIC Countries | ||
| Rest of Europe | ||
| South America | Brazil | |
| Argentina | ||
| Rest of South America | ||
| Middle-East and Africa | Saudi Arabia | |
| South Africa | ||
| Rest of Middle-East and Africa | ||


Key Questions Answered in the Report
What is current market size of Chloroacetyl Chloride Market?
The Chloroacetyl Chloride Market size is projected to expand from USD 488.23 million in 2025 and USD 516.01 million in 2026 to USD 680.5 million by 2031, registering a CAGR of 5.69% between 2026 to 2031.
Which region contributes the largest share of chloroacetyl chloride consumption?
Asia-Pacific held 50.89% of global demand in 2025 and remains the fastest-growing region at 6.03% CAGR.
What is driving the switch to high-purity chloroacetyl chloride grades?
Semiconductor photoresist makers need ≥99.5% purity with metallic impurities below 10 ppb to meet EUV lithography requirements.
Which application segment is projected to grow the quickest?
Pharmaceutical intermediates lead growth with a 5.97% CAGR as GLP-1 diabetes drugs and anti-tuberculosis APIs scale up.
Page last updated on:


