Market Overview
| Study Period | 2020 - 2031 |
|---|---|
| Forecast Data Period | 2026 - 2031 |
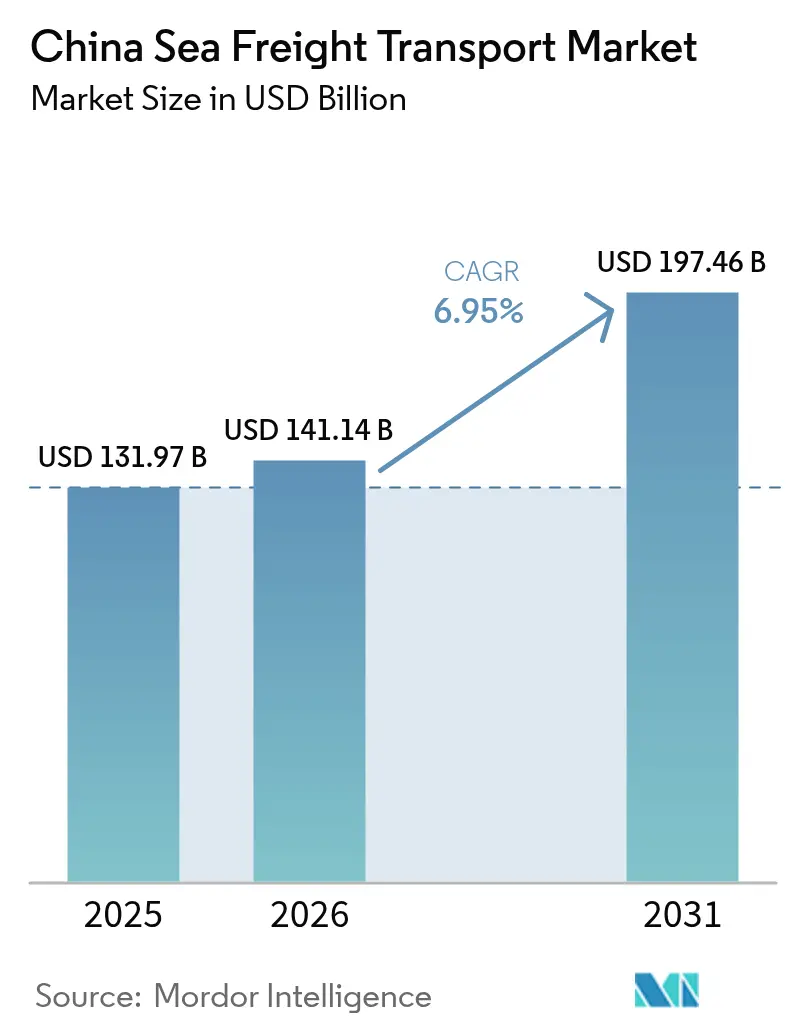
| Base Year Market Size (2025) | USD 131.97 Billion |
| Market Size (2026) | USD 141.14 Billion |
| Market Size (2031) | USD 197.46 Billion |
| Growth Rate (2026 - 2031) | 6.95% CAGR |
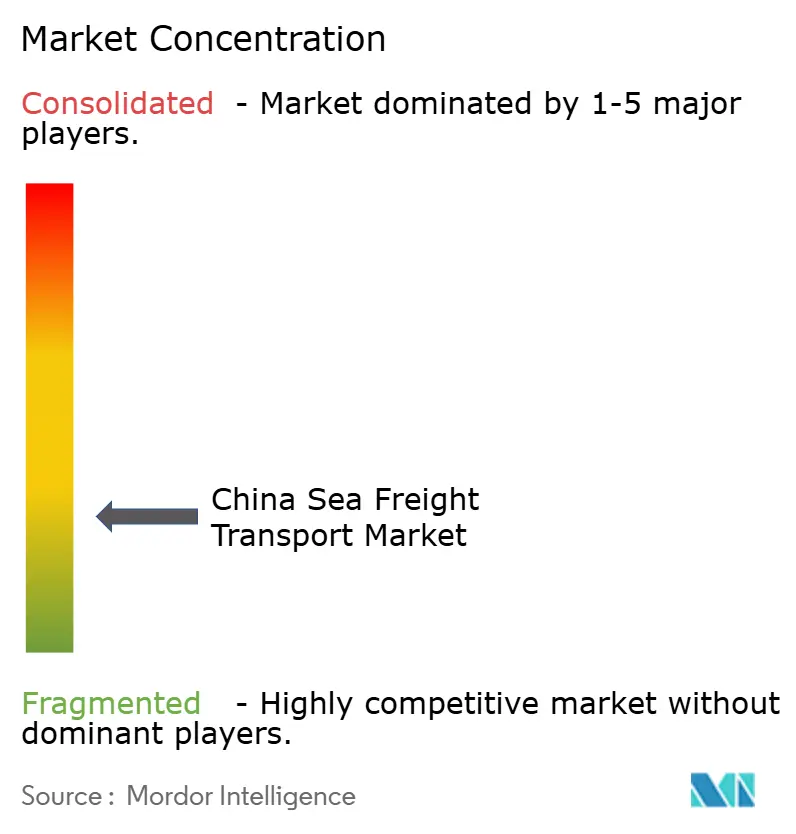
| Market Concentration | Low |
Major Players *Disclaimer: Major Players sorted in no particular order Image © Mordor Intelligence. Reuse requires attribution under CC BY 4.0. | |
China Sea Freight Transport Market Analysis by Mordor Intelligence
The China Sea Freight Transport Market size was valued at USD 131.97 billion in 2025 and estimated to grow from USD 141.14 billion in 2026 to reach USD 197.46 billion by 2031, at a CAGR of 6.95% during the forecast period (2026-2031).
Even amid geopolitical frictions, the country’s dominance endures as multi-billion-dollar Belt and Road port projects unlock fresh trade corridors and anchor long-term shipping contracts. Automation rollouts at flagship terminals—paired with the deployment of ever larger, fuel-efficient vessels—are raising berth productivity while keeping operating costs in check [1]Willow Liu Yang, “Xiamen Port Makes Fully Intelligent Transformation,” China.org.cn, china.org.cn. Surging cross-border e-commerce volumes now fill containers that once sailed with slack capacity, encouraging carriers to refine networks and secure guaranteed load agreements. At the same time, accelerated adoption of dual-fuel and methanol-ready ships is trimming emissions and positioning Chinese lines favorably against impending environmental levies, creating a virtuous cycle in which lower freight costs draw more cargo and justify further investment.
Key Report Takeaways
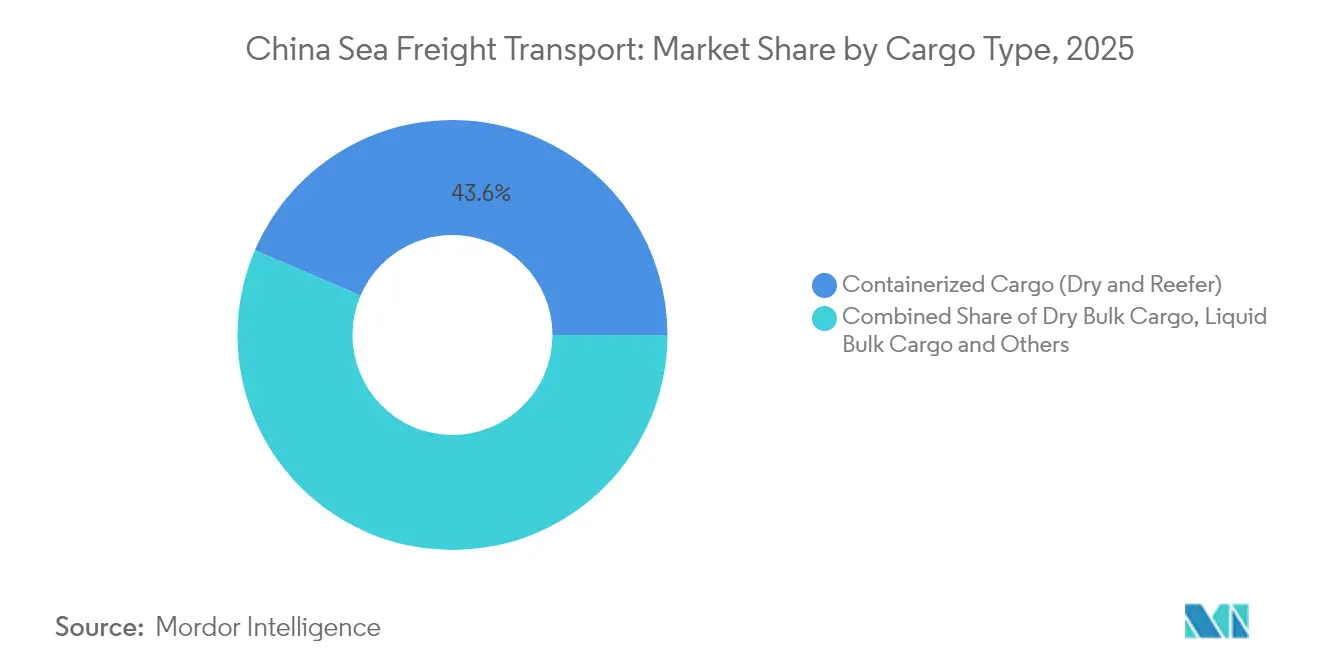
- By cargo type, containerized cargo captured 43.55% of the China Sea Freight Transport market share in 2025, while the China Sea Freight Transport market size for RoRo shipments is projected to expand at an 7.95 % CAGR during 2026-2031.
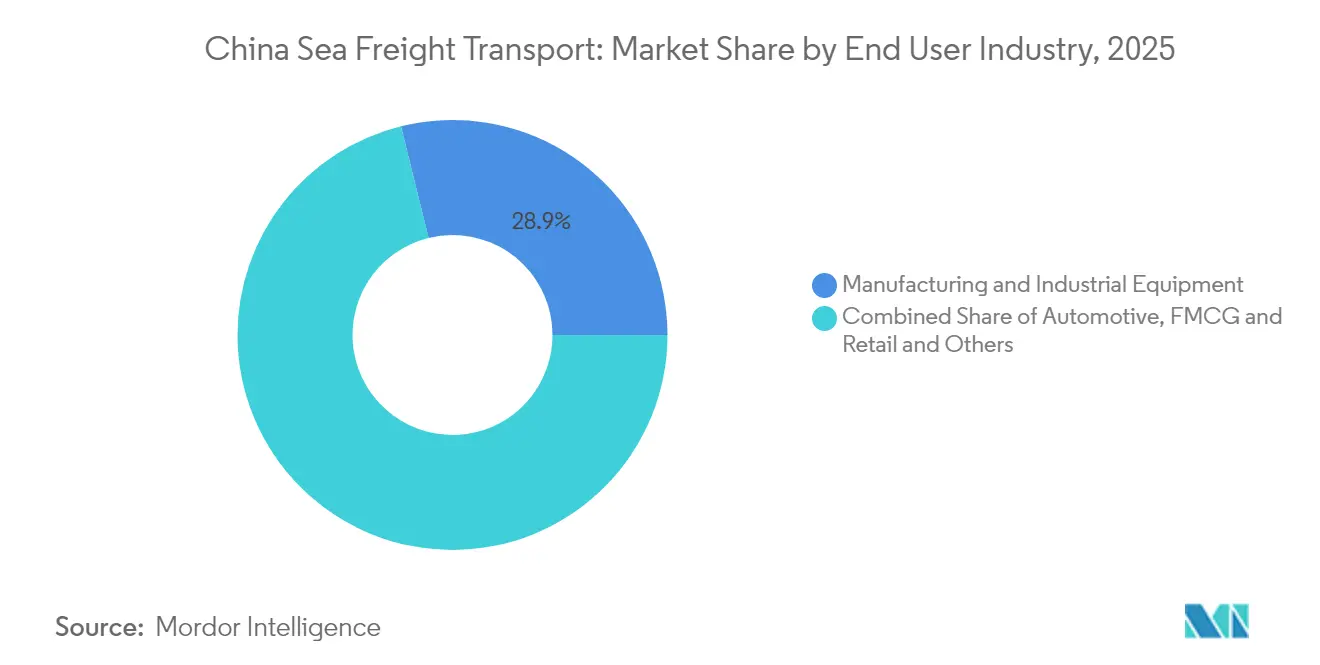
- By end-use industry, manufacturing maintained 28.85 % China Sea Freight Transport market share in 2025, yet the China Sea Freight Transport market size attributed to FMCG and retail is forecast to rise at a 9.45 % CAGR over 2026-2031.
- By trade lane, Intra-Asia services commanded a 37.35% China Sea Freight Transport market share in 2025, and the China Sea Freight Transport market size linked to Africa-bound routes is expected to register an 7.9 % CAGR through 2031
Note: Market size and forecast figures in this report are generated using Mordor Intelligence’s proprietary estimation framework, updated with the latest available data and insights as of 2026.
China Sea Freight Transport Market Trends and Insights
Drivers Impact Analysis*
| Driver | (~) % Impact on CAGR Forecast | Geographic Relevance | Impact Timeline |
|---|---|---|---|
| Belt & Road Maritime Silk Road Infrastructure Build-out Amplifying Outbound Sea Freight Volumes | +1.8% | Global focus on Africa & Latin America | Medium-term |
| Cross-Border E-Commerce Boom Elevating China-Origin Containerized Shipments | +1.5% | North America & Europe | Short-term |
| Port Automation & Mega-Vessel Berth Expansion in Yangtze & Pearl River Deltas Enhancing Throughput Capacity | +1.2% | Yangtze & Pearl River hubs | Medium-term |
| Rising LNG & Petrochemical Import Demand Driving Specialized Tanker Traffic | +0.9% | Middle East & Australia routes | Medium-term |
| Increased High-Grade Iron Ore Imports Fueling Capesize Bulk Carrier Utilization | +0.8% | Australia & Brazil routes | Short-term |
| Government Incentives for Green & Dual-Fuel Vessels Accelerating Fleet Renewal | +0.7% | Domestic & EU routes | Long-term |
| Source: Mordor Intelligence | |||
Belt & Road Maritime Silk Road Infrastructure Build-out Amplifying Outbound Sea Freight Volumes
China’s sustained port investments under the Maritime Silk Road banner are adding throughput faster than most trading partners can absorb, enabling shippers to reroute cargo flows with minimal friction. Newly completed deep-water hubs in Latin America and Southeast Asia shorten transit times on previously underserved corridors, a shift that encourages exporters to diversify destination portfolios. By pairing equity stakes with long-term terminal concessions, Chinese operators ensure preferential berth windows that lock in volume commitments. This integrated approach strengthens bargaining power in freight-rate negotiations, an advantage that is likely to endure as ports monetise ancillary services such as bonded warehousing.
Cross-Border E-Commerce Boom Elevating China-Origin Containerized Shipments
Double-digit growth in cross-border online retail continues to reshape shipping patterns, pulling parcelised goods into consolidated container loads bound for micro-fulfilment centres overseas. Dedicated e-commerce pilot zones inside free-trade areas offer streamlined customs clearance, compressing order-to-ship lead times and making sea freight viable for categories once flown by air. Major platforms are now negotiating annual service contracts directly with carriers, guaranteeing baseline volumes that smooth capacity planning. This predictable demand profile is prompting liners to allocate more reefer and high-cube containers to fast-moving consumer segments, nudging equipment fleets toward greater specialisation.
Port Automation & Mega-Vessel Berth Expansion in Yangtze & Pearl River Deltas Enhancing Throughput Capacity
Smart-port retrofits featuring artificial intelligence, digital twins, and 5G connectivity are lifting crane productivity and reducing labour intensity on China’s busiest quays. The capability to handle 24 000-TEU class vessels at multiple terminals simultaneously spreads operational risk and minimises congestion during peak export seasons. Automated truck-marshalling yards further shrink turnaround times, effectively converting space savings into added berth length for future growth. The cascade effect is that second-tier ports adopt similar technologies to remain relevant, forming a nationwide mesh of high-efficiency gateways that lowers inland logistics costs.
Rising LNG & Petrochemical Import Demand Driving Specialized Tanker Traffic
China’s long-term gasification policy and its commitment to petrochemical self-sufficiency underpin a steady rise in specialised tanker calls [2]National Energy Administration, “China’s LNG Receiving Terminals Construction Report 2025,” National Energy Administration, nea.gov.cn. Additional regasification terminals along the eastern seaboard create incremental berth demand for Q-Max LNG carriers, stimulating orders for locally built cryogenic vessels. Parallel investments in ethane and propane dehydrogenation complexes draw more liquid bulk cargo, encouraging shipyards to prioritise dual-fuel tanker designs. The combined outcome is a fleet mix skewed toward higher-value vessels, which supports charter-rate resilience even amid broader market softness.
Restraints Impact Analysis*
| Restraint | (~) % Impact on CAGR Forecast | Geographic Relevance | Impact Timeline |
|---|---|---|---|
| Container Fleet Overcapacity Post-2023 Newbuild Wave Suppressing Freight Rates | -1.6% | Asia-Europe & Transpacific | Short-term |
| Rail & Pipeline Substitution Curtailing Seaborne Coal and Bulk Commodity Volumes | -0.9% | Domestic inland corridors | Medium-term |
| Escalating IMO / China Emission Compliance Costs Impacting Operator Margins | -0.8% | EU-China lanes | Medium-term |
| Geopolitical Trade Disruptions Introducing Route Volatility & Demand Uncertainty | -1.2% | South China Sea & US-China | Short-term |
| Source: Mordor Intelligence | |||
Container Fleet Overcapacity Post-2023 Newbuild Wave Suppressing Freight Rates
The orderbook expansion that peaked in 2024 is now filtering into active service, outpacing incremental demand and placing downward pressure on spot rates across mainline routes. Carriers respond with strategic blank sailings, but persistent vessel deliveries continue to inflate idle capacity, especially in the 8 000-to-12 000 TEU band. This surplus is pushing some operators to reposition tonnage into secondary trades, a tactic that dampens rate recovery even where demand is firm. An unintended consequence is that shippers gain more leverage in contract talks, encouraging them to negotiate longer validity periods at lower base rates.
Rail & Pipeline Substitution Curtailing Seaborne Coal and Bulk Commodity Volumes
Government incentives for rail-water intermodal corridors are diverting bulk commodities like coal from coastal loading points to inland rail depots, trimming voyage counts for Handymax and Panamax vessels. Container-on-flat-car services now capture a larger share of domestic distribution, indicating that shippers value the lower carbon footprint and predictability of rail. As electrified freight corridors expand westward, some energy producers are revisiting pipeline projects that could bypass coastal export entirely. These shifts introduce a structural headwind for sea-borne bulk growth, yet create complementary demand for last-mile feeder services out of inland ports.
*Our forecasts treat driver/restraint impacts as directional, not additive. The impact forecasts reflect baseline growth, mix effects, and variable interactions.
Segment Analysis
Cargo Type: Containerised Cargo Dominates Amid Diversification
The containerised segment commands a 43.55 % China Sea Freight Transport market share in 2025, a position anchored by the country’s manufacturing scale and flourishing e-commerce exports. Continuous berth enhancements at flagship ports allow 24,000-TEU vessels to call without tidal restrictions, giving shippers confidence in schedule reliability. Within the container pool, demand for reefer boxes grows faster than dry units as pharmaceutical and fresh-produce exporters seek temperature-controlled integrity. This evolution nudges carriers to rebalance fleet mix toward higher-power generator sets, an investment that raises slot yields per voyage.
Roll-on/Roll-off cargo is expanding at a forecast CAGR of 7.95 %, fuelled by rising vehicle exports and new-energy-vehicle shipments that require purpose-built car carriers. The segment’s momentum is prompting specialised terminals to add multistorey ramps, which increases hourly throughput and reduces berth time variance. Dry-bulk flows remain substantial, yet incremental gains concentrate in premium-grade ores that support steel decarbonisation targets, indicating a qualitative shift rather than pure volume growth. In liquid bulk, robust LNG import programmes sustain demand for membrane-type tankers, reinforcing the strategic value of shipyards capable of cryogenic construction.


End-Use Industry: Manufacturing Dominance Challenged by Retail Growth
Manufacturing retains a 28.85 % share of the China Sea Freight Transport market size in 2025, underlining its enduring weight in national GDP despite marginal year-on-year contractions. Machinery and consumer electronics occupy the largest container slots, and their complexity sustains a requirement for value-added logistics such as kitting and postponement. A fresh implication is that carriers offering integrated supply-chain visibility tools are now more strongly preferred by exporters, suggesting technology capability is supplanting simple scale as a differentiator.
Fast-moving consumer goods and retail exhibit a forecast 9.45 % CAGR, marking them as the most dynamic cargo class in the China Sea Freight Transport industry. High-frequency promotions by online platforms compress replenishment cycles, compelling shippers to treat seaborne freight as a quasi-inventory buffer rather than a cost centre. This behavioural change increases the appeal of time-definite ocean services, creating an opening for premium no-roll guarantees that carry higher margins. Automotive exports also rise sharply, with new-energy models boosting the utilisation of RoRo decks while underscoring the need for enhanced fire-suppression standards onboard.
Trade Lane / Destination: Intra-Asia Dominates as Africa Emerges
Intra-Asia corridors account for a 37.35 % China Sea Freight Transport market share in 2025, illustrating the gravitational pull of regional supply-chain clustering under the Regional Comprehensive Economic Partnership. Short-haul services benefit from weekly sailing frequencies that smooth inventory planning for just-in-time manufacturers, an arrangement that tightens economic links across the region. Because voyage distances are shorter, carriers deploy smaller gearless vessels that cycle faster, indirectly freeing larger tonnage for long-haul trades.
Africa-bound volumes register the fastest forecast CAGR at 7.9 %, buoyed by tariff-free access for agricultural imports and a wave of Chinese-financed port concessions that guarantee berth priority. The emerging traffic supports a rise in direct services from South-central China, avoiding transhipment and reducing cargo dwell times. North American and European lanes remain critical for container line profitability, yet heightened compliance and security levies are tempering growth, prompting shippers to weigh alternate gateways such as Mexico and the Mediterranean.
Competitive Landscape
State-owned enterprises dominate the China Sea Freight Transport market, but their competitive posture is increasingly shaped by technology adoption rather than fleet tonnage alone. COSCO Shipping, the market leader, operates 1,417 vessels with 116 million deadweight tons of capacity, giving it unmatched scheduling flexibility and bargaining power with terminals [3]COSCO SHIPPING, “COSCO SHIPPING Pioneers With the Nation’s First Initiative of Methanol Refueling for Large Dual-Fuel Container Ship,” COSCO SHIPPING, en.coscoshipping.com. The group’s decision to standardise digital platforms across subsidiaries signals a pivot toward data-driven network orchestration that compresses cost per box.
Second-tier players hedge against scale disadvantages through strategic alliances that provide global reach without duplicating assets. Joint ventures with port operators secure priority berths and safeguard service integrity during peak seasons, illustrating how relationship capital translates into operational resilience. Smaller niche carriers differentiate by focusing on specialised trades such as project cargo or short-sea feeder loops, where agility and local knowledge trump sheer size. This tiered structure yields a market that is concentrated yet competitive, encouraging continual service upgrades and rate discipline.
Technology is the new fault line in competitive positioning. Real-time cargo visibility, predictive maintenance powered by machine learning, and blockchain-enabled documentation are transitioning from optional add-ons to baseline expectations. Firms that embed these capabilities report lower detention and demurrage charges, effectively converting tech spend into revenue protection. The cascading benefit is a widening performance gap that accelerates consolidation, as laggards struggle to secure investor confidence amid rising compliance costs.
China Sea Freight Transport Industry Leaders
COSCO Shipping Lines
SINOTRANS Limited
China Merchants Group
SITC International Holdings Company Limited
Hebei Ocean Shipping (HOSCO)
- *Disclaimer: Major Players sorted in no particular order

Recent Industry Developments
- March 2025: COSCO conducted parallel refueling with B24 biofuel on two container vessels, gathering operational data to guide a broader transition toward bio-blended fuels.
- December 2024: SAIC Group, COSCO Shipping and Shanghai International Port Group sealed a broad agreement designed to move Chinese automobiles around the world more efficiently. COSCO and SIPG each put USD 137.2 million into SAIC Anji Logistics, lifting the company’s registered capital to USD 102.9 million. The deal sets the stage for a larger roll-on/roll-off fleet and stronger door-to-door services that already link more than 600 Chinese cities with over 100 overseas markets.
- November 2024: China opened the USD 3.6 billion Chancay megaport in Peru, a deep-water gateway that COSCO can use exclusively for up to 60 years. With capacity for one million containers and six million tons of bulk cargo a year, the terminal is expected to cut transit costs for Latin-bound exports and anchor COSCO’s expansion in South America.
- July 2024: China Merchants Group, COSCO Shipping and CHN Energy unveiled parallel fleet-growth plans that call for roughly 100 additional vessels each. Within that push, China Merchants Energy Shipping ordered ten bulk carriers worth RMB 5.45 billion (USD 750 million), while CHN Energy picked up eleven bulk carriers through a finance-leasing deal.


Research Methodology Framework and Report Scope
Market Definitions and Key Coverage
Our study defines the China sea freight transport market as the revenue generated inside China from moving commercial goods by ocean-going vessels, covering liner, bulk, and roll-on/roll-off services plus the supporting activities that a carrier bundles into the freight invoice (terminal handling, bunker surcharges, documentation). Coastal cabotage, port authority fees, third-party warehousing, and inland haulage beyond the port gate are outside scope.
Scope exclusion: ferry passenger services and pure port real-estate income are not counted.
Segmentation Overview
- By Cargo Type
- Containerized Cargo
- Dry
- Reefer
- Dry Bulk Cargo
- Liquid Bulk Cargo
- General Cargo
- Roll-On/Roll-Off Cargo
- Containerized Cargo
- By End-Use Industry
- Manufacturing & Industrial Equipment
- Automotive
- FMCG & Retail (incl. E-commerce)
- Agriculture & Food Products
- Energy & Mining (Coal, Minerals & Ores)
- Chemicals & Petrochemicals
- Pharmaceutical & Healthcare
- Others
- By Trade Lane / Destination Region
- Intra-Asia
- North America
- Europe
- Middle East
- Africa
- South America
- Oceania
Detailed Research Methodology and Data Validation
Primary Research
We interviewed senior planners at eastern deep-water ports, operations managers of Chinese liner groups, and freight forwarder associations in Shenzhen and Qingdao. Their insights on contract versus spot rate spreads, expected TEU flow during tariff rollovers, and empty-container repositioning costs filled gaps that public data could not cover and allowed us to adjust model assumptions for realistic yield per move.
Desk Research
Mordor analysts began with authoritative datasets such as the Ministry of Transport port throughput bulletin, General Administration of Customs export-import value tables, Shanghai Shipping Exchange composite freight index, UNCTAD Review of Maritime Transport, and China Ports & Harbors Association annuals. They then layered firm-level intelligence from D&B Hoovers and audited carrier reports. Trade press notes from Drewry and Lloyd's List supplied weekly pricing signals that helped sanity-check average freight rates. Company filings, policy white papers on the Belt & Road maritime corridor, and patent alerts on automated terminal equipment rounded out context. The sources listed illustrate, not exhaust, the wider pool consulted for data gathering and cross-validation.
Market-Sizing & Forecasting
A top-down reconstruction starts with loaded TEU and bulk tonnage reported by 20 major Chinese ports; these are multiplied by average revenue per TEU or ton (derived from Shanghai Containerized Freight Index bands and stakeholder interviews) to build the 2024 baseline, which is then rolled to 2025. Supplier roll-ups of leading carriers' China-origin revenue and sampled freight bills act as a bottom-up sense check. Key model drivers include (1) annual loaded TEU at Shanghai, Ningbo-Zhoushan, and Qingdao, (2) China merchandise export growth, (3) bunker fuel price trajectory, (4) port automation-led productivity gains, and (5) cross-border e-commerce parcel volume. Forecasts employ multivariate regression with scenario bounds reviewed by interviewed experts; gaps in smaller regional ports are bridged using volume-share proxies from customs data.
Data Validation & Update Cycle
Outputs pass three filters: variance testing against independent freight indices, peer review by a second analyst team, and a senior sign-off. Models refresh annually, with interim updates triggered by material shocks such as tariff hikes or force-majeure port closures, ensuring buyers receive the latest vetted view.
Why Mordor's China Sea Freight Transport Baseline Commands Confidence
Published estimates seldom align because firms choose different activity sets, pricing bases, and refresh cadences. By focusing strictly on carrier-earned freight revenue for ocean moves executed within China's jurisdiction and by updating models every twelve months, Mordor minimizes these distortions.
Key gap drivers are scope breadth (some studies fold port services or inland forwarding; others count only container lines), pricing approach (nominal tariff sheets versus blended contract-spot yields), and currency timing. Our disciplined variable selection and dual-check modelling temper extremes, giving decision-makers a balanced reference point.
Benchmark comparison
| Market Size | Anonymized source | Primary gap driver |
|---|---|---|
| USD 131.97 B (2025) | Mordor Intelligence | - |
| USD 250 B (2023) | Regional Consultancy A | Combines coastal and inland waterway freight plus port concession revenue, inflating total |
| USD 185 B (2024) | Trade Journal B | Uses tariff sheet rates without adjusting for contract discounts or empty repositioning |
| USD 23.82 B (2024) | Research Boutique C | Restricts scope to container freight only, omitting bulk and Ro-Ro segments |
In sum, the disciplined scoping, transparent driver set, and annual refresh give Mordor's baseline a reliability that competing figures, though useful for perspective, often lack for board-level planning.


Key Questions Answered in the Report
What is the current China Sea Freight Transport market size?
The market is valued at USD 141.14 billion in 2026, reflecting solid demand across container, bulk, and liquid cargo categories.
How fast is the China Sea Freight Transport market expected to grow?
Analysts forecast a CAGR of 6.95% through 2031, supported by infrastructure investment, technology adoption, and expanding trade partnerships.
Which cargo type holds the largest China Sea Freight Transport market share?
Containerized cargo accounts for the largest share at 43.55%, driven by robust manufacturing and surging cross-border e-commerce volumes.
Why is Africa becoming a key destination for Chinese sea freight?
China-funded port developments and tariff-free access for African imports are propelling rapid growth in China-to-Africa trade lanes.
How are environmental regulations affecting the China Sea Freight Transport industry?
Lifecycle emissions standards and FuelEU Maritime rules are raising compliance costs but also accelerating the shift to dual-fuel and alternative-fuel vessels.
Which companies dominate the China Sea Freight Transport market?
Large state-owned enterprises, led by COSCO Shipping, control the majority of fleet capacity and terminal investments, setting service benchmarks for the industry.
Page last updated on:


