Market Overview
| Study Period | 2021 - 2031 |
|---|---|
| Forecast Data Period | 2026 - 2031 |
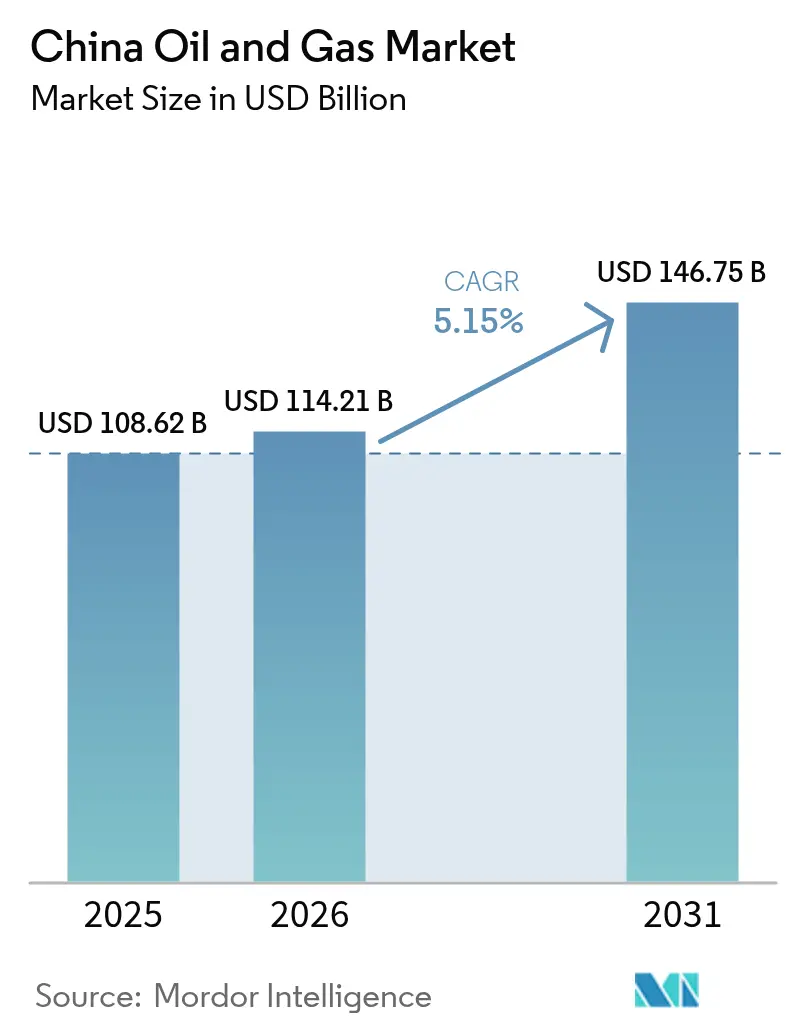
| Base Year Market Size (2025) | USD 108.62 Billion |
| Market Size (2026) | USD 114.21 Billion |
| Market Size (2031) | USD 146.75 Billion |
| Growth Rate (2026 - 2031) | 5.15% CAGR |
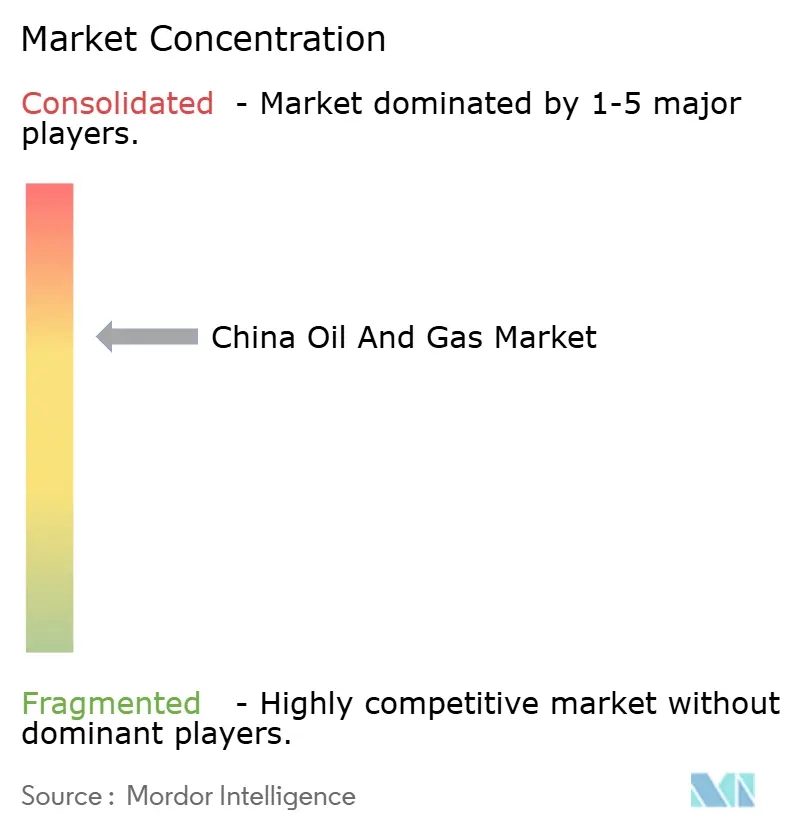
| Market Concentration | Medium |
Major Players *Disclaimer: Major Players sorted in no particular order Image © Mordor Intelligence. Reuse requires attribution under CC BY 4.0. | |
China Oil And Gas Market Analysis by Mordor Intelligence
China Oil And Gas Market size in 2026 is estimated at USD 114.21 billion, growing from 2025 value of USD 108.62 billion with 2031 projections showing USD 146.75 billion, growing at 5.15% CAGR over 2026-2031.
Ongoing domestic production mandates, petrochemical feedstock requirements, and a rapid expansion of transmission infrastructure sustain volume growth, even as the electrification of transportation moderates fuel demand. State policy favors upstream capital allocation, and a national pipeline grid now links western basins to eastern industrial clusters. Carbon-capture retrofits in refineries provide producers with a route to align with the 2060 net-zero pledge without compromising throughput. Advanced seismic imaging, AI-guided drilling, and predictive maintenance programs lower lifting costs and defer the decline of mature fields, while joint ventures with international majors accelerate the transfer of deep-water and emissions-control technologies.
Key Report Takeaways
- By sector, upstream operations led with a 70.88% share of China's oil and gas market in 2025, while the downstream sector is expected to grow at a rate of 5.44% through 2031.
- By location, Onshore activities accounted for 67.55% of the China oil and gas market size in 2025, while offshore is projected to deliver the fastest 7.28% CAGR through 2031.
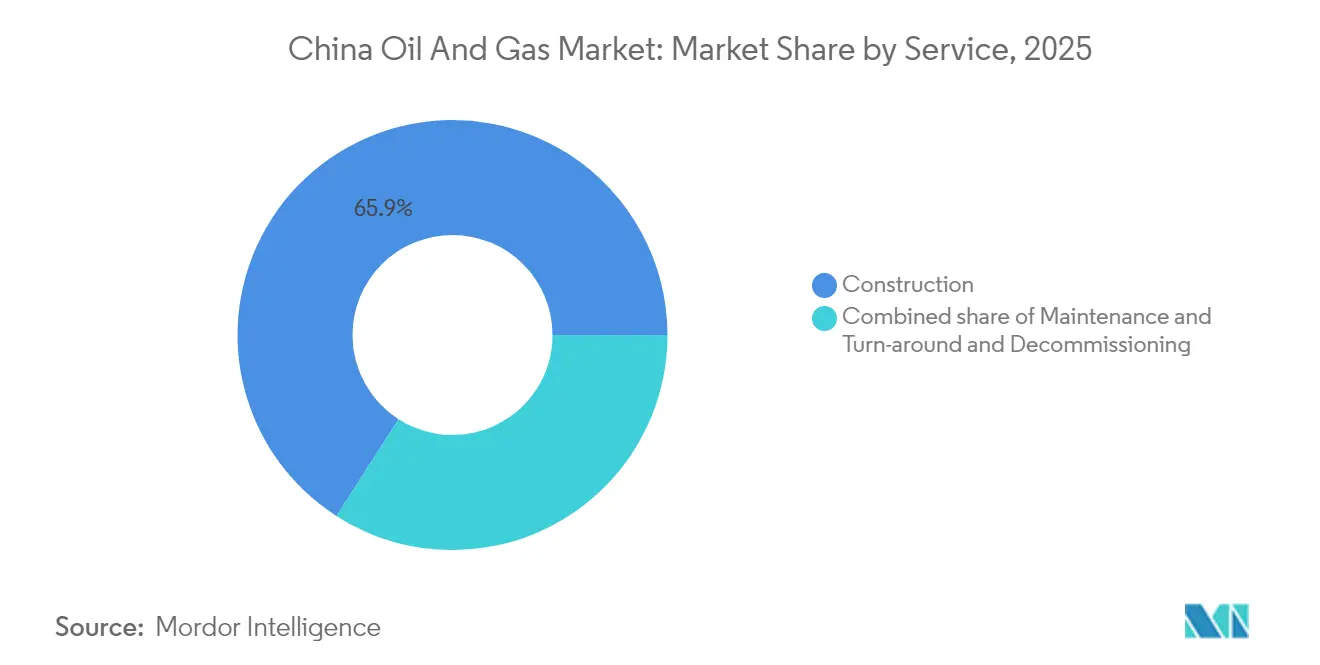
- By service, construction held 65.92% of the China oil gas market size in 2025, whereas decommissioning is projected to post the fastest 7.86% CAGR through 2031.
Note: Market size and forecast figures in this report are generated using Mordor Intelligence’s proprietary estimation framework, updated with the latest available data and insights as of 2026.
China Oil And Gas Market Trends and Insights
Drivers Impact Analysis*
| Driver | (~) % Impact on CAGR Forecast | Geographic Relevance | Impact Timeline |
|---|---|---|---|
| Energy-security push & import-substitution mandates | 1.50% | Xinjiang, Sichuan, offshore basins | Long term (≥ 4 years) |
| Petrochemical feedstock demand from dual-circulation strategy | 1.20% | Guangdong, Jiangsu, Zhejiang | Medium term (2-4 years) |
| Shale-gas commercialisation in Sichuan & Chongqing | 0.80% | Sichuan Basin | Medium term (2-4 years) |
| National pipeline network build-out (PipeChina) | 0.60% | Nationwide | Long term (≥ 4 years) |
| CCS-ready refinery upgrades | 0.40% | Shandong, Liaoning, Guangdong | Long term (≥ 4 years) |
| AI-optimised E&P in mature basins | 0.30% | Daqing, Shengli, Changqing | Short term (≤ 2 years) |
| Source: Mordor Intelligence | |||
Energy-security Push & Import-Substitution Mandates
Beijing requires crude oil output to remain above 200 million tons per year, thereby reducing reliance on imports, which currently account for 73% of demand.[1]Ministry of Industry and Information Technology, “Domestic Crude Production Targets,” miit.gov.cn CNPC and Sinopec secure low-cost policy-bank financing for infill drilling, while CNOOC accelerates offshore exploration to diversify reserves. A larger strategic petroleum reserve insulates domestic supply, and mandated local-content rules spur procurement of Chinese-made rigs, pumps, and subsea umbilicals. Petrochemical producers increase off-take contracts for domestic naphtha and ethane, locking in baseline consumption even as gasoline sales flatten. Together, these policies underpin a security premium that cushions the Chinese oil and gas market against price shocks.
Petrochemical Feedstock Demand from Dual-Circulation Strategy
China’s economic planners channel investment into integrated refinery-chemical complexes that convert more barrels of crude oil into aromatics and olefins, thereby boosting hydrocarbon demand beyond transport fuels. CNOOC’s Daxie Island revamp lifts crude-run capacity 50% and doubles chemical yield, mirroring upgrades in Guangdong and Jiangsu.[2]China National Offshore Oil Corporation, “South China Sea Block 23/21 Discovery,” cnooc.com.cn Domestic ethylene output climbed 12% in 2024, absorbing extra condensate and LPG flows from inland basins. Petrochemical feedstock contracts typically have five-year tenures, providing producers with predictable cash flow and anchoring the Chinese oil and gas market during shifts in the energy transition.
Shale-Gas Commercialisation in Sichuan & Chongqing
Annual shale-gas output tops 70 billion m³ after operators drilled ultra-deep horizontals at more than 8,000 m TVD. Multi-stage fracturing and high-strength proppants achieve 18% higher initial flow rates compared to 2023. Recycled flowback water addresses scarcity constraints, and pad-drilling layouts minimize land disturbance in populated valleys. With breakeven prices now under USD 3.5 per MMBtu, Sichuan shale becomes margin-positive at prevailing spot prices, encouraging acreage bids from private independents and foreign service firms. As power generators switch from coal to gas for winter peaking, local pipeline expansions lift offtake capacity, supporting continuous development.
National Pipeline Network (PipeChina) Capacity Expansion
PipeChina operates 98,000 km of trunk lines, in addition to seven LNG terminals that unload 30 million tonnes per annum (tpa), thereby separating transport from production and facilitating third-party access. New west-to-east arteries move Xinjiang gas to Shanghai in under four days, trimming citygate prices by 8%. The network interconnects with the Power of Siberia pipeline and coastal LNG regasification plants, providing dispatchers with the optionality to balance domestic and imported volumes. Stable transport tariffs allow provincial utilities to sign firm supply contracts, removing a historical constraint on gas demand growth inside the Chinese oil and gas market.
Restraints Impact Analysis*
| Restraint | (~) % Impact on CAGR Forecast | Geographic Relevance | Impact Timeline |
|---|---|---|---|
| Windfall-profit tax on upstream majors | -0.6% | National, affecting all major state-owned oil companies | Short term (≤ 2 years) |
| Stringent methane-emission regulations (2025 action plan) | -0.4% | National, with emphasis on shale gas and coal-bed methane operations | Medium term (2-4 years) |
| Accelerated electrification of road transport | -0.8% | Eastern coastal provinces, major urban centers | Medium term (2-4 years) |
| Water-stress limits on fracking in Tarim & Ordos | -0.3% | Western regions, Tarim Basin, Ordos Basin, Inner Mongolia | Long term (≥ 4 years) |
| Source: Mordor Intelligence | |||
Windfall-Profit Tax on Upstream Majors
A tiered levy skims exceptional earnings during high-price cycles, trimming reinvestment budgets at CNPC, Sinopec, and CNOOC. Management prioritises core blocks with quick payback and delays marginal frontier wells. The tax coincides with rising CCS outlays, intensifying cash-flow pressure, and slightly tempering expansion inside the Chinese oil and gas market.
Stringent Methane-Emission Regulations (2025 Action Plan)
The 2025 action plan requires continuous monitoring and quarterly leak repairs, which raises compliance costs for shale and coal-bed methane producers.[3]National Development and Reform Commission, “Methane Emission Control Action Plan,” ndrc.gov.cn Operators retrofit pneumatic valves and install vapour-recovery units, lifting unit OPEX by 3% but cutting emissions intensity by 40%. Equipment makers of optical gas-imaging cameras are seeing bumper orders; however, temporary shutdowns for retrofits are shaving the near-term outlook for output.
*Our forecasts treat driver/restraint impacts as directional, not additive. The impact forecasts reflect baseline growth, mix effects, and variable interactions.
Segment Analysis
By Sector: Upstream Dominance Drives Market Structure
Upstream activities accounted for 70.88% of China's oil and gas market share in 2025, underpinned by aggressive state-funded exploration in the Bohai, South China Sea, and Ordos regions. Meanwhile, the downstream sector is projected to drive market growth with a CAGR of 5.44% through 2031. Integrated majors utilize AI-assisted seismic inversion, reducing exploration cycle times by 20% and reinforcing their upstream preeminence.
Upstream spend focuses on reservoir management tools that enhance recovery factors in mature blocks. Carbon-capture pilots in producing wells store CO₂ in depleted formations, allowing incremental barrels under stricter emission norms. Although downstream gasoline cracks narrow with EV adoption, aromatics margins remain firm, propelling refinery utilization and sustaining chemical demand that ripples upstream.


By Location: Onshore Operations Maintain Strategic Advantage
Onshore wells accounted for 67.55% of China's oil and gas market size in 2025, led by the Ordos, Tarim, and Sichuan basins. Offshore registers a 7.28% CAGR to 2031 as output increases with large discoveries in the Lingshui and Liuhua blocks, but remains more expensive on a barrel-equivalent basis.
Shunbei set a depth record at 8,000 m, proving onshore ultra-deep prospects viable at moderate oil prices. Hydro-fracturing water recycling halves freshwater draw in arid Tarim, keeping regulators supportive. Offshore platforms now utilize subsea cables to tap renewable power from Guangdong, reducing lifecycle emissions by 15%; however, high capital expenditure limits broader replication.
By Service: Construction Dominance Shifts Toward Decommissioning Growth
Construction services captured 65.92% of the Chinese oil and gas market share in 2025 as PipeChina laid new transmission lines and CNOOC assembled deep-water topsides. Massive pipeline corridors linking Xinjiang fields to the Yangtze River deltas required thousands of kilometres of trenching and compressor-station builds, while offshore jacket fabrication peaked to support South China Sea developments.
Decommissioning services, however, are expected to log the fastest 7.86% CAGR through 2031, as the first-generation offshore platforms installed in the late 1980s approach the end of their life. Regulatory guidelines now compel full jacket removal and seabed clearance, creating a market for heavy-lift vessels, well-plugging gear, and subsea debris mapping. Early contracts in the Bohai and Pearl River Mouth basins indicate a growing demand for specialist contractors with global removal experience. Meanwhile, maintenance and turnaround work remains steady as AI and IoT sensors enable predictive strategies that reduce labour needs amid a shrinking skilled-worker pool. Digital project-management suites streamline cost estimating and permit tracking, raising efficiency throughout the service stack.
The service-mix evolution signals a maturing China oil and gas market that balances greenfield construction in frontier zones with asset renewal and environmental compliance projects in legacy areas. Construction spending remains anchored in Xinjiang pipelines and new LNG tanks; however, a larger slice of future budgets is shifting toward lifecycle retirement solutions, reflecting global best practices and stricter domestic standards.
Geography Analysis
China’s west produces and the east consumes, creating bulk east-bound flows that define logistics in the China oil and gas market. Xinjiang and Sichuan together delivered more than 160 million tons of oil equivalent in 2024, whereas coastal provinces house 65% of the refining capacity and most petrochemical crackers. PipeChina’s new arteries cut transit time and balance inland surpluses with eastern deficits.
Ordos basin remains the single largest producing hub with 97.5 million tons, aided by steam flooding in tight-sand reservoirs. Sichuan emerges as the unconventional gas core, aided by nearby proppant plants that reduce material-haul costs. Bohai Bay hosts mature shallow-water fields that are now entering secondary recovery, while deep-water plays in the South China Sea, such as Lingshui, add reserves rich in condensate.
Northern Heilongjiang and Inner Mongolia produce conventional barrels that feed Liaoning’s refineries, whereas Guangdong leads in LPG imports and cracking. Seasonal LNG demand spikes draw cargoes into Zhoushan and Shenzhen, smoothing winter supply. Cross-border pipelines from Kazakhstan and Russia provide central dispatchers with flexibility, while the proposed Myanmar corridor gasifies Yunnan and Guangxi, thereby closing regional gaps.
Participation in Belt and Road projects secures equity barrels abroad that backstop domestic shortages. CNPC’s stake in Power of Siberia 2 will deliver 50 billion cubic meters annually to the Chinese oil and gas market starting in 2030. Similar deals in Turkmenistan, Iraq, and Mozambique ensure optionality, offering geopolitical hedges and supply diversification.
Regulatory Landscape
China's oil and gas sector is governed by a framework led by the National Development and Reform Commission (NDRC), the National Energy Administration (NEA), and the Ministry of Ecology and Environment (MEE). The Measures for Fair Open Supervision of Oil and Gas Pipeline Network Facilities (Order No. 33) took effect on November 1, 2025, reinforcing third-party access and supervision as China moves toward a unified pipeline network.
The Measures for the Administration of Planning, Construction, and Operation of Oil and Natural Gas Infrastructure (Order No. 35) took effect on January 1, 2026, tightening planning and operating requirements for major oil and gas infrastructure. MEE issued HJ 1461-2026 on solid waste control for oil and gas exploitation, approved January 19, 2026 and implemented July 1, 2026, along with compliance tools that include T/CASEI 076-2026 (pipeline integrity management platform), implemented March 20, 2026, and GB/T 34163-2026 (shale gas development planning specifications), released May 25, 2026 and implemented December 1, 2026.
Competitive Landscape
A state-dominated oligopoly prevails, as CNPC, Sinopec, and CNOOC collectively account for roughly 80% of the national output.[5]State-owned Assets Supervision and Administration Commission, “Oil and Gas SOE Performance Report,” sasac.gov.cn SASAC aligns investment priorities while allowing for technical differentiation: CNPC excels in onshore drilling, Sinopec in refining and chemicals, and CNOOC in offshore and LNG operations. Managed competition averts pricing wars and protects balance-sheet strength.
Foreign majors maintain minority joint ventures offering deep-water expertise, enhanced oil recovery, or emissions control. Shell co-owns the Daya Bay petrochemical complex, BP teams with Sinopec in retail fuel, and ExxonMobil licenses high-olefins cracking technology. Service firms from Norway and the United States win contracts in subsea controls, well cementing, and CCS monitoring, provided they localise critical components.
Domestic independents flourish in niche shale blocks or strip-gas processing, but face capital constraints and pipeline-access fees on a similar scale to that of big companies. Digital services start-ups deploy cloud-based reservoir simulators and drone-enabled leak detection, providing agility that complements the scale of big companies. ESG metrics and carbon audit requirements are increasing in procurement, prompting all suppliers to adopt low-carbon solutions.
China Oil And Gas Industry Leaders
China National Petroleum Corporation (CNPC)
China Petroleum & Chemical Corporation (Sinopec)
China National Offshore Oil Corporation (CNOOC)
PipeChina
Sinochem Holdings
- *Disclaimer: Major Players sorted in no particular order

Market Opportunities and Future Outlook
Domestic supply security and regulated network opening are shaping opportunities across upstream reinvestment, gas-system flexibility, and compliance-led services. The late 2025 and early 2026 infrastructure rules formalize planning and operating requirements, which can broaden demand for pipeline construction, integrity management systems, and third-party services that operate under regulated access.
Offshore development, trunkline build-out, and emissions and waste compliance continue to influence activity in 2026. In May 2026, CNOOC's Bohai Kenli 10-2 development progressed to production, pointing to ongoing offshore monetization and upstream-to-midstream service needs. In July 2026, Sinopec Oilfield Service secured a major EPC contract for a key pipeline segment, highlighting renewed midstream capex and growing requirements for pipeline integrity and project-management support.
Recent Industry Developments
- July 2026: Sinopec Oilfield Service Corporation subsidiary won a contract for Section I of the Heihe-Daqing and Daqing-Changling natural gas pipelines. The award highlights continued pipeline EPC and integrity management capability expansion in China. This action also fits national efforts to strengthen inter-provincial gas transport.
- May 2025: CNOOC announced a significant offshore discovery in the South China Sea. The find highlights the continued importance of offshore exploration and related services. It reinforces the strategic role of offshore energy in domestic supply security.
- September 2024: CNOOC began shore-powered operation for an offshore field as part of a broader emissions reduction program. Shore-power integration expands subsea cabling and emissions-reduction retrofits across offshore assets. This project reflects ongoing investments in digital and grid-enabled offshore infrastructure.


Research Methodology Framework and Report Scope
Market Definition and Coverage
For this study, the China oil and gas market is sized as the value generated from upstream, midstream, and downstream activities within China, covering services and operations tied to oil and natural gas production, transport, processing, and related field services.
Scope exclusions: We exclude non-oil-and-gas energy value chains, and we do not count downstream end product retail consumption value outside the oil and gas operations and service boundary.
Segmentation Overview
- By Sector
- Upstream
- Midstream
- Downstream
- By Location
- Onshore
- Offshore
- By Service
- Construction
- Maintenance and Turn-around
- Decommissioning
Data Sources, Market Sizing, and Validation
Desk Research
Desk work starts by building a clean fact base on China hydrocarbons activity, and then it is translated into usable model drivers. We rely on public and official sources such as the National Bureau of Statistics of China, the National Energy Administration, customs trade releases, and international datasets such as IEA and EIA for production, imports, and consumption signals.
To keep the numbers grounded in real project activity, we also review company annual reports, investor presentations, and credible industry news for capex direction, new field developments, and pipeline or terminal additions. Patent databases are used selectively to understand where technical effort is moving (for example, enhanced recovery and gas processing), and a paid subscription for company financials and a news and financials feed is used to cross-check revenue exposure and event timing. These desk sources are illustrative and not exhaustive, and many other public references were also used for data collection, validation, and clarification.
Primary Interviews and Surveys
Primary inputs were gathered through expert interviews and structured surveys with participants across operators, service providers, midstream infrastructure stakeholders, and downstream plant-linked teams, so the assumptions do not rely only on published statistics. Since this is a single-country market, we focused on coverage across major producing basins and key consuming provinces in China, and then used re-contacts to confirm pricing logic and activity shifts when desk signals did not align with on-the-ground work levels.
Distribution of primary research fieldwork respondents
| Company type | Respondent position | Region |
|---|---|---|
| Top tier: 35% | CXOs: 15% | |
| Mid tier: 49% | Functional/Unit leaders: 26% | |
| Smaller Players: 16% | Managers: 59% |
Market-Sizing & Forecasting
Sizing is built using a top-down and bottom-up approach, where the core totals are reconstructed from China activity indicators and then checked using supplier and channel realities. The top-down side uses production and trade data to map the demand pool, followed by allocation across upstream, midstream, and downstream activity where spend intensity is validated through interviews.
Key model inputs include crude oil and natural gas output levels, import dependency and LNG intake trends, refinery throughput direction, pipeline capacity additions and utilization, and typical service intensity for maintenance and turn-around cycles. When any metric is reported in different units across sources, it is normalized before conversion to value, and then tested against what practitioners see in current bidding and work orders. Forecasts are developed using scenario analysis, where oil and gas demand outlook, planned projects, and policy-driven shifts are translated into a base case and alternative paths, and then the final trajectory is aligned to consensus ranges discussed with primary respondents. Where bottom-up roll ups have gaps, the missing portion is handled through conservative interpolation using comparable asset types and region-level activity signals, and then the totals are adjusted back to the country-level control totals.
Data Validation & Update Cycle
Validation is done in layers so that a single source does not decide the outcome. Outputs are checked against independent signals such as production balance, trade flows, and major project commissioning timelines in China, and then large variances are traced back to the specific driver that caused them.
Before sign-off, the model undergoes peer review with step-by-step checks on unit conversions, price assumptions, and segment allocations, and any outliers trigger a targeted re-check through additional desk reads or a call-back to a relevant expert. The report is refreshed annually, and interim updates are made when material events occur (such as policy changes, major capacity starts, or sharp price shifts). Right before delivery, a final review pass is completed so clients receive the latest updated view.
Mordor Intelligence's China Oil and Gas Market Estimate Compared With Other Published Estimates
Published numbers for the China oil and gas market can look far apart because the underlying scope is not always the same, even when the titles look similar. Differences usually come from what is counted as market value, how upstream, midstream, and downstream are treated, and whether the estimate follows activity-linked indicators or relies more on broad revenue multipliers.
A second driver is the price and currency timing used in the conversion to USD, since oil and gas value shifts quickly with commodity prices and contract cycles. Some studies also mix operational value with end product sales value, or they extend the definition to adjacent energy services, which can inflate totals even if the direction of growth is similar.
Benchmark comparison
| Source | Market Size | Gaps in Research Methodology |
|---|---|---|
| Mordor Intelligence | USD 108.62 B (2025) | |
| Global Consultancy A | USD 323.95 B (2024) | This figure appears to use a much broader value construct that likely blends downstream product value and wider oil and gas revenue pools, which can lift the total above an operations and service-linked market definition. |
| Industry Publisher B | USD 100.60 B (2024) | The smaller total is consistent with a narrower scope and a different base-year price deck, where refinery and midstream value capture may be treated more selectively and pricing is not rechecked against recent project and maintenance cycles. |
The spread across the table mainly comes from whether downstream is treated as operational activity or as end product value, plus how the base-year pricing is translated into USD. By anchoring the model to production, trade, throughput, and infrastructure activity checks, and then stress-testing the value conversion through interviews, the estimate stays traceable to repeatable drivers, a discipline applied by Mordor Intelligence.


Key Questions Answered in the Report
How large is the China oil gas market in 2026?
The China oil gas market size stands at USD 114.21 billion in 2026.
What growth rate is expected through 2031?
The market is forecast to expand at a 5.15% CAGR, reaching USD 146.75 billion by 2031.
Which service segment currently dominates?
Construction services led with 65.92% China oil gas market share in 2025.
Which service segment will grow the fastest?
Decommissioning is projected to grow at an 7.86% CAGR through 2031.
What share does upstream hold today?
Upstream commands 70.88% of the China oil gas market.
Who are the leading companies?
CNPC, Sinopec, and CNOOC together control about 80% of domestic production.
Page last updated on:


