United Kingdom Engineering Plastics Market Size and Share
Market Overview
| Study Period | 2020 - 2031 |
|---|---|
| Forecast Data Period | 2026 - 2031 |
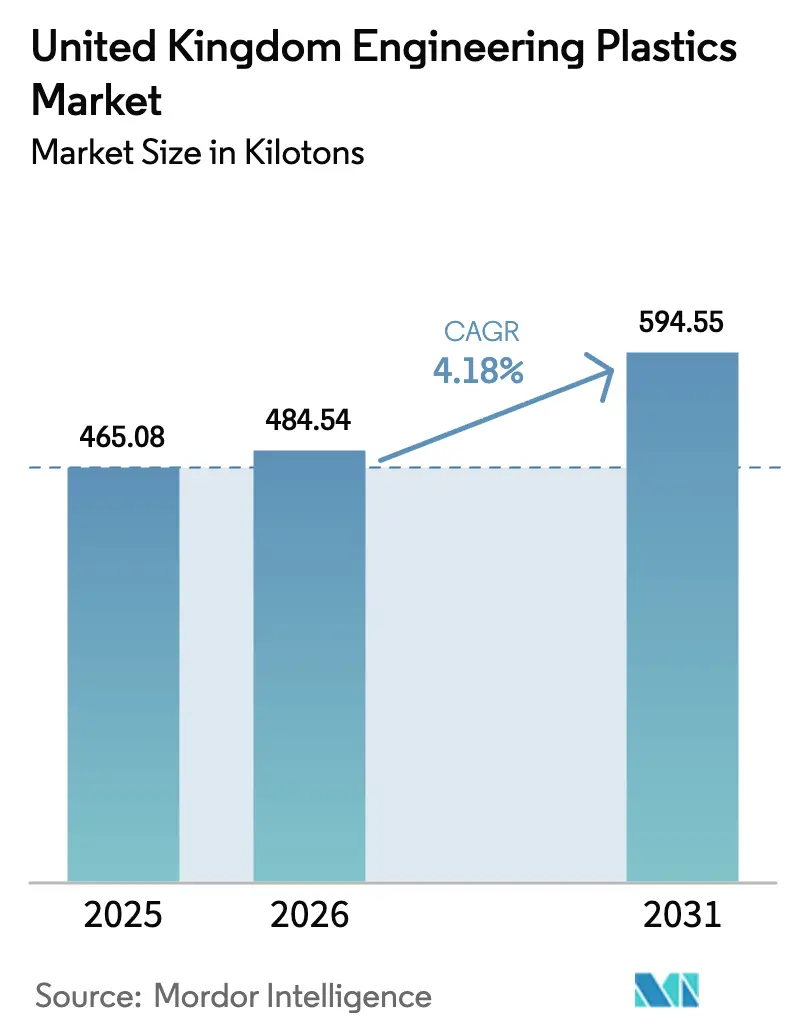
| Base Year Market Size (2025) | 465.08 kilotons |
| Market Volume (2026) | 484.54 kilotons |
| Market Volume (2031) | 594.55 kilotons |
| Growth Rate (2026 - 2031) | 4.18% CAGR |
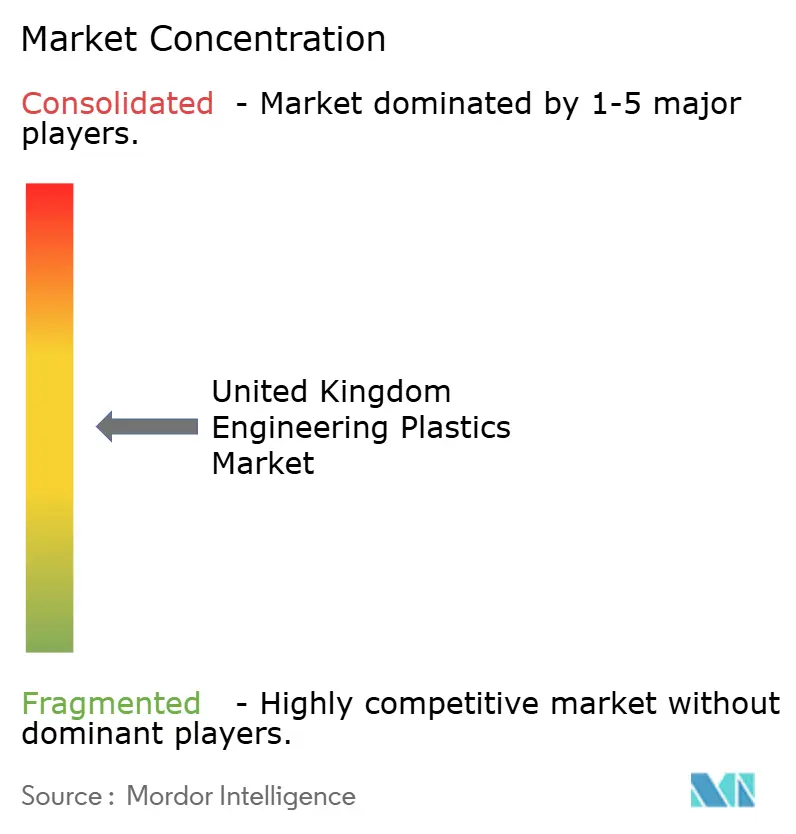
| Market Concentration | Medium |
Major Players *Disclaimer: Major Players sorted in no particular order Image © Mordor Intelligence. Reuse requires attribution under CC BY 4.0. | |
United Kingdom Engineering Plastics Market Analysis by Mordor Intelligence
The United Kingdom Engineering Plastics Market size in 2026 is estimated at 484.54 kilotons, growing from 2025 value of 465.08 kilotons with 2031 projections showing 594.55 kilotons, growing at 4.18% CAGR over 2026-2031. Resilient growth continues despite energy-cost headwinds, as demand is concentrated in high-value aerospace, automotive electrification, and advanced electronics applications, where performance outweighs price. Regulatory momentum toward net-zero emissions adds urgency to lightweighting and recyclability, while post-Brexit supply-chain realignment nudges OEMs to source materials locally. Companies, therefore, focus on specialty grades that command premium pricing, cushioning margins against the United Kingdom’s elevated power tariffs. Persistent investment in the Lancashire PEEK cluster and the Cambridge–London technology corridor confirms that the UK engineering plastics market remains strategically important for global chemical majors even as commodity processing relocates to lower-cost regions.
Key Report Takeaways
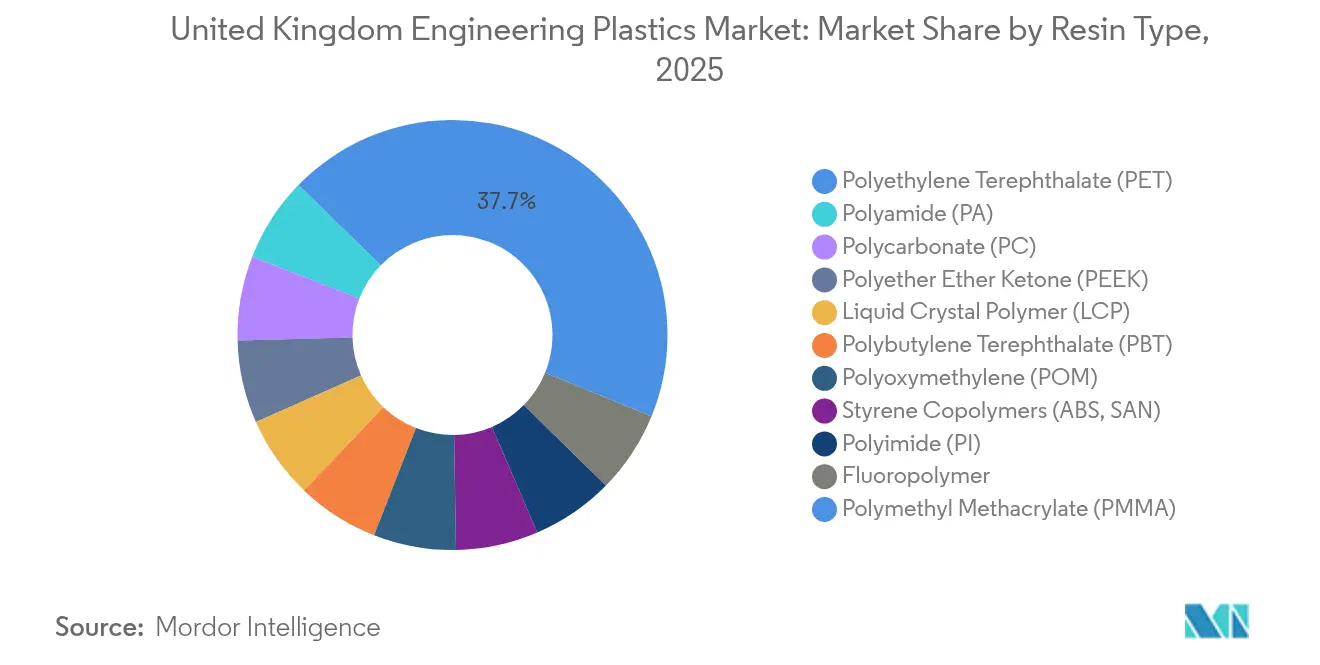
- By resin type, PET held 37.72% of the United Kingdom engineering plastics market share in 2025; styrene copolymers are advancing at a 5.84% CAGR through 2031.
- By end-user industry, packaging accounted for 37.25% of the United Kingdom engineering plastics market size in 2025, while electrical and electronics is expanding at a 6.45% CAGR through 2031.
Note: Market size and forecast figures in this report are generated using Mordor Intelligence’s proprietary estimation framework, updated with the latest available data and insights as of 2026.
United Kingdom Engineering Plastics Market Trends and Insights
Drivers Impact Analysis*
| Driver | (~) % Impact on CAGR Forecast | Geographic Relevance | Impact Timeline |
|---|---|---|---|
| Electrification of Automotive & EV Manufacturing | +1.20% | UK automotive clusters (West Midlands, North East) | Medium term (2-4 years) |
| Lightweighting Demand Across Aerospace & Transport | +0.80% | UK aerospace corridor (Bristol, Derby, Preston) | Long term (≥ 4 years) |
| Growth in Electrical & Electronics Production (5G & IoT) | +1.10% | National, concentrated in Cambridge-London corridor | Short term (≤ 2 years) |
| Regulatory Push for Sustainable & Recyclable Plastics | +0.60% | National, EU alignment requirements | Medium term (2-4 years) |
| Expansion of UK's PEEK Production Cluster & Uses | +0.40% | Lancashire cluster, global export markets | Long term (≥ 4 years) |
| Source: Mordor Intelligence | |||


Electrification of Automotive & EV Manufacturing
Battery pack housings now specify flame-retardant polycarbonate and glass-fiber-reinforced polyamide because these polymers balance structural integrity with dielectric protection required under UN ECE R100. Jaguar Land Rover, Nissan, and other OEMs estimate that electric drivetrains raise engineering-plastic content by 40–60% per vehicle. Styrene copolymers capture interior trim upgrades, while fluoropolymers coat high-voltage cables for thermal insulation. Localization pressures, intensified by post-Brexit customs paperwork, favor compounding plants inside the UK engineering plastics market that can deliver just-in-time volumes to EV lines in the West Midlands. Peak material intensity is expected between 2027 and 2029 as ICE models retire and volume EV output scales[1]Automotive Council UK, “Electric Vehicle Supply Chain Development,” automotivecouncil.co.uk .
Lightweighting Demand Across Aerospace & Transport
Aerospace primes such as BAE Systems and Rolls-Royce adopt carbon-fiber-reinforced PEEK in wing and engine parts that reduce weight 50–70% versus aluminum while meeting EASA Part 21 fatigue thresholds. High-speed rail interiors under EN 45545 standards call for flame-retardant polyimide films and polycarbonate panels that lower energy use. Because certification takes years, approved polymers enjoy multi-decade production runs that stabilize revenue for suppliers embedded within the UK engineering plastics market. Export contracts account for 60% of Lancashire PEEK output, underscoring the UK’s role in global aircraft supply chains.
Growth in Electrical & Electronics Production (5G & IoT)
Liquid-crystal polymers and fluoropolymers dominate antenna housings and substrate laminates where low dielectric loss enables 5G frequencies. The 6.77% CAGR in electronics end-use value stems both from higher volumes of small-cell equipment and from specifications that require tighter tolerances than 4G components. Cambridge chip-design firms rely on local molders to prototype IoT casings made of polyoxymethylene and polycarbonate, shortening design cycles that the broader UK engineering plastics market converts into volume orders. Export demand rises as European telecom builders source UK-qualified parts for cross-border 5G backhaul.
Regulatory Push for Sustainable & Recyclable Plastics
The 2024 plastic-packaging tax of GBP 200 per tonne on material containing less than 30% recycled content prompts beverage bottlers to invest in chemical recycling units that can depolymerize PET back to monomer. Simultaneously, PFAS phase-outs under the Stockholm Convention accelerate the adoption of halogen-free phosphorus systems in electronics flame retardants. Although reformulation lifts unit costs by 15–30%, early movers capture brand-value premiums and secure future market access. The UK engineering plastics market, therefore, shifts toward bio-based polyamides and closed-loop polycarbonate grades that satisfy both performance and compliance criteria.
Restraints Impact Analysis*
| Restraint | (~) % Impact on CAGR Forecast | Geographic Relevance | Impact Timeline |
|---|---|---|---|
| High Raw-Material & Energy-Cost Volatility | -1.80% | National, particularly energy-intensive processing | Short term (≤ 2 years) |
| Tightening PFAS / Flame-Retardant Regulations | -0.70% | National, EU regulatory alignment | Medium term (2-4 years) |
| Skill Shortage in High-Precision Polymer Processing | -0.50% | Industrial clusters (North West, Yorkshire) | Long term (≥ 4 years) |
| Source: Mordor Intelligence | |||
High Raw-Material & Energy-Cost Volatility
Industrial power tariffs run 50–70% above mainland Europe, pushing energy to 15–25% of injection-molding cost at UK processing plants. Feedstock imports pass through new customs procedures that add 8–12% to delivered monomer prices. Smaller specialty compounders struggle to qualify for Energy Intensive Industry relief, widening the gap between integrated majors and SME molders. To defend margins, producers narrow portfolios to grades where performance premiums offset volatility, but this approach caps overall tonnage growth in the UK engineering plastics market[2]MAKE UK, “Manufacturing Outlook 2024,” makeuk.org .
Tightening PFAS / Flame-Retardant Regulations
Upcoming bans on fluorinated additives demand phosphorus-based alternatives which may cut thermal stability in electronics housings. Compliance testing under UL 94 and IEC 60695 can extend project timelines by 12–18 months, delaying revenue. Automakers balancing stricter flame retardancy with EV thermal loads face longer qualification cycles, slowing program launches. Reformulation raises compound cost up to 30%, squeezing price-sensitive segments of the UK engineering plastics market and prompting some OEMs to explore metal substitutes despite weight penalties.
*Our forecasts treat driver/restraint impacts as directional, not additive. The impact forecasts reflect baseline growth, mix effects, and variable interactions.
Segment Analysis
By Resin Type: PET Dominance Faces Sustainability Pressures
PET controlled a 37.72% UK engineering plastics market share in 2025, largely through beverage and food packaging lines that rely on its clarity and barrier performance. However, plastic-packaging tax obligations intensify demand for recycled content and chemical recycling technologies that can lower virgin PET reliance. Styrene copolymers, led by ABS, post the fastest 5.84% CAGR as electronics and interior automotive trims demand dimensional stability, fuelled by IoT enclosures and EV dashboards. Polycarbonate adoption rises in sunroof modules and headlamp housings, while polyamide grades such as aramid fibers steadily penetrate aerospace composites because weight penalties translate directly into fuel burn.
High-heat fluoropolymers continue to serve niche semiconductor fabrication and chemical processing equipment though PFAS curbs may constrain future volumes. The Lancashire PEEK hub anchors the premium tier of the UK engineering plastics market size, manufacturing more than 8,000 tons annually for aerospace, energy, and medical implants that require sustained exposure to 260 °C without property loss. Polyimide films protect flexible circuitry in 5G smartphones, and liquid-crystal polymers enable fine-pitch connectors, albeit from a small tonnage base. Across all resins, compliance with UK REACH drives substitution toward safer additives, nudging formulators to upgrade flame-retardant packages without sacrificing mechanical integrity.


By End-User Industry: Electronics Growth Outpaces Traditional Applications
Packaging retained 37.25% of the UK engineering plastics market size in 2025 because large CPG companies already operate dedicated bottle-to-bottle loops that guard against material substitution. Yet the electrical and electronics sector is expanding at a 6.45% CAGR on robust 5G rollouts and sensor-rich Industry 4.0 installations. Miniaturized devices require polymers with both dielectric strength and dimensional accuracy, pushing demand for high-flow ABS, polyoxymethylene, and liquid-crystal polymer.
Automotive lines adopt engineering plastics rapidly as EV batteries, power electronics, and lightweight body panels multiply polymer use per vehicle. Aerospace retains stable demand as new aircraft programs seek qualified PEEK and polyimide composites. Buildings incorporate multi-wall polycarbonate glazing and polyamide thermal breaks to reach stricter insulation codes, while industrial machinery deploys chemically resistant fluoropolymers in pump and valve parts. Each of these shifts keeps the UK engineering plastics market diversified across consumer-facing and capital-goods segments, insulating overall growth from cyclical swings in any single end use.

Geography Analysis
England remains the core production and consumption base of the UK engineering plastics market, with the Lancashire cluster producing ultra-high-performance PEEK and the West Midlands automotive corridor consuming large volumes of polyamide and polycarbonate. Scotland’s renewable-energy build-out, including offshore wind farms, generates specialty demand for salt-water-resistant fluoropolymers and PEEK bearings that promise 25-year service lives. Wales hosts aerospace composite facilities that tap PEEK and carbon-fiber-reinforced polyamide for lightweight interiors, while Northern Ireland’s pharmaceutical hub specifies biocompatible PEEK and medical-grade polycarbonate housings under MHRA oversight.
Post-Brexit customs regimes add paperwork and 8-12% landed-cost premiums to imported feedstocks, encouraging local polymerization where feasible. Yet the UK lacks large-scale petrochemical crackers, so most monomers still arrive by ship or rail. To hedge volatility, compounders sign multiyear offtake agreements with North Sea ethylene traders and broaden supplier bases beyond continental Europe. Regional economic-development agencies co-fund recycling and bio-polymer pilots, aiming to anchor circular-economy jobs in areas affected by petrochemical plant closures.
Electricity-price disparity with mainland competitors drives extrusion and injection-molding operations to the country’s energy-efficiency schemes, but location near OEM factories often outweighs utility bills. As a result, processors cluster around automotive and electronics plants to meet just-in-time delivery windows that tolerate minimal customs delay. Universities in Manchester, Birmingham, and Cambridge supply R&D talent and pilot lines that accelerate commercial-scale transitions, reinforcing regional hubs within the wider UK engineering plastics market.
Competitive Landscape
The United Kingdom Engineering Plastics Market exhibits moderately fragmented concentration. Global majors BASF, SABIC, and Covestro compete on technical service and integrated supply chains. They leverage European cracker feedstock into UK compounding lines to maintain market presence despite energy-cost headwinds. Each now offers in-country laboratories to speed regulatory certification and tailor flame-retardant systems for local customers. Victrex stands out as the sole domestic producer of PEEK, commanding high margins in aerospace, medical, and semiconductor uses where substitution risk is negligible.
Mid-tier firms such as Solvay (Syensqo) and Mitsubishi Chemical push additive packages and bio-based grades that satisfy impending PFAS and packaging-tax rules. Niche compounders Goodfish and Scott Bader grow through acquisitions that broaden color masterbatch, fiber-reinforcement, and high-precision tooling capabilities. Vertical integration into recycling appears frequently in strategic roadmaps as OEMs demand closed-loop solutions from resin down to molded part.
R&D spending targets reactive extrusion, precision molding, and advanced characterization. Patent filings cluster in phosphorus flame retardants and solvent-free depolymerization processes that promise lower carbon footprints. Because application know-how and regulatory dossiers create switching costs, incumbents sustain advantage even as raw-material prices fluctuate. The resulting UK engineering plastics market balances a handful of scale suppliers against dozens of specialty players that provide bespoke compounds for critical parts.
United Kingdom Engineering Plastics Industry Leaders
BASF
Celanese Corporation
Covestro AG
INEOS
Victrex
- *Disclaimer: Major Players sorted in no particular order

Recent Industry Developments
- October 2024: BASF is set to expand its Neopor expandable polystyrene production capacity in Ludwigshafen by 50,000 metric tonnes annually, with the startup scheduled for 2027. This initiative aims to support lightweight insulation applications in the construction sector.
- October 2024: Covestro is investing approximately EUR 100 million in its global R&D infrastructure and assets over three years, concluding in 2025. This move reinforces its competitiveness and supports innovation in the United Kingdom engineering plastics market by advancing material development to meet industry demands.


United Kingdom Engineering Plastics Market Report Scope
Aerospace, Automotive, Building and Construction, Electrical and Electronics, Industrial and Machinery, Packaging are covered as segments by End User Industry. Fluoropolymer, Liquid Crystal Polymer (LCP), Polyamide (PA), Polybutylene Terephthalate (PBT), Polycarbonate (PC), Polyether Ether Ketone (PEEK), Polyethylene Terephthalate (PET), Polyimide (PI), Polymethyl Methacrylate (PMMA), Polyoxymethylene (POM), Styrene Copolymers (ABS and SAN) are covered as segments by Resin Type.| Fluoropolymer | Ethylenetetrafluoroethylene (ETFE) |
| Fluorinated Ethylene-propylene (FEP) | |
| Polytetrafluoroethylene (PTFE) | |
| Polyvinylfluoride (PVF) | |
| Polyvinylidene Fluoride (PVDF) | |
| Other Sub Resin Types | |
| Liquid Crystal Polymer (LCP) | |
| Polyamide (PA) | Aramid |
| Polyamide (PA) 6 | |
| Polyamide (PA) 66 | |
| Polyphthalamide | |
| Polybutylene Terephthalate (PBT) | |
| Polycarbonate (PC) | |
| Polyether Ether Ketone (PEEK) | |
| Polyethylene Terephthalate (PET) | |
| Polyimide (PI) | |
| Polymethyl Methacrylate (PMMA) | |
| Polyoxymethylene (POM) | |
| Styrene Copolymers (ABS, SAN) |
| Aerospace |
| Automotive |
| Building and Construction |
| Electrical and Electronics |
| Industrial and Machinery |
| Packaging |
| Other End-user Industries |
| By Resin Type | Fluoropolymer | Ethylenetetrafluoroethylene (ETFE) |
| Fluorinated Ethylene-propylene (FEP) | ||
| Polytetrafluoroethylene (PTFE) | ||
| Polyvinylfluoride (PVF) | ||
| Polyvinylidene Fluoride (PVDF) | ||
| Other Sub Resin Types | ||
| Liquid Crystal Polymer (LCP) | ||
| Polyamide (PA) | Aramid | |
| Polyamide (PA) 6 | ||
| Polyamide (PA) 66 | ||
| Polyphthalamide | ||
| Polybutylene Terephthalate (PBT) | ||
| Polycarbonate (PC) | ||
| Polyether Ether Ketone (PEEK) | ||
| Polyethylene Terephthalate (PET) | ||
| Polyimide (PI) | ||
| Polymethyl Methacrylate (PMMA) | ||
| Polyoxymethylene (POM) | ||
| Styrene Copolymers (ABS, SAN) | ||
| By End-User Industry | Aerospace | |
| Automotive | ||
| Building and Construction | ||
| Electrical and Electronics | ||
| Industrial and Machinery | ||
| Packaging | ||
| Other End-user Industries | ||


Market Definition
- End-user Industry - Electrical & Electronics, Industrial & Machinery, Automotive, and Others are the end-user industries considered under the polyvinylidene fluoride market.
- Resin - Under the scope of the study, consumption of virgin polyvinylidene fluoride resin in the primary forms such as powder, pellet, etc. are considered.
- Report Name - Global PVDF Market
| Keyword | Definition |
|---|---|
| Acetal | This is a rigid material that has a slippery surface. It can easily withstand wear and tear in abusive work environments. This polymer is used for building applications such as gears, bearings, valve components, etc. |
| Acrylic | This synthetic resin is a derivative of acrylic acid. It forms a smooth surface and is mainly used for various indoor applications. The material can also be used for outdoor applications with a special formulation. |
| Cast film | A cast film is made by depositing a layer of plastic onto a surface then solidifying and removing the film from that surface. The plastic layer can be in molten form, in a solution, or in dispersion. |
| Colorants & Pigments | Colorants & Pigments are additives used to change the color of the plastic. They can be a powder or a resin/color premix. |
| Composite material | A composite material is a material that is produced from two or more constituent materials. These constituent materials have dissimilar chemical or physical properties and are merged to create a material with properties unlike the individual elements. |
| Degree of Polymerization (DP) | The number of monomeric units in a macromolecule, polymer, or oligomer molecule is referred to as the degree of polymerization or DP. Plastics with useful physical properties often have DPs in the thousands. |
| Dispersion | To create a suspension or solution of material in another substance, fine, agglomerated solid particles of one substance are dispersed in a liquid or another substance to form a dispersion. |
| Fiberglass | Fiberglass-reinforced plastic is a material made up of glass fibers embedded in a resin matrix. These materials have high tensile and impact strength. Handrails and platforms are two examples of lightweight structural applications that use standard fiberglass. |
| Fiber-reinforced polymer (FRP) | Fiber-reinforced polymer is a composite material made of a polymer matrix reinforced with fibers. The fibers are usually glass, carbon, aramid, or basalt. |
| Flake | This is a dry, peeled-off piece, usually with an uneven surface, and is the base of cellulosic plastics. |
| Fluoropolymers | This is a fluorocarbon-based polymer with multiple carbon-fluorine bonds. It is characterized by high resistance to solvents, acids, and bases. These materials are tough yet easy to machine. Some of the popular fluoropolymers are PTFE, ETFE, PVDF, PVF, etc. |
| Kevlar | Kevlar is the commonly referred name for aramid fiber, which was initially a Dupont brand for aramid fiber. Any group of lightweight, heat-resistant, solid, synthetic, aromatic polyamide materials that are fashioned into fibers, filaments, or sheets is called aramid fiber. They are classified into Para-aramid and Meta-aramid. |
| Laminate | A structure or surface composed of sequential layers of material bonded under pressure and heat to build up to the desired shape and width. |
| Nylon | They are synthetic fiber-forming polyamides formed into yarns and monofilaments. These fibers possess excellent tensile strength, durability, and elasticity. They have high melting points and can resist chemicals and various liquids. |
| PET preform | A preform is an intermediate product that is subsequently blown into a polyethylene terephthalate (PET) bottle or a container. |
| Plastic compounding | Compounding consists of preparing plastic formulations by mixing and/or blending polymers and additives in a molten state to achieve the desired characteristics. These blends are automatically dosed with fixed setpoints usually through feeders/hoppers. |
| Plastic pellets | Plastic pellets, also known as pre-production pellets or nurdles, are the building blocks for nearly every product made of plastic. |
| Polymerization | It is a chemical reaction of several monomer molecules to form polymer chains that form stable covalent bonds. |
| Styrene Copolymers | A copolymer is a polymer derived from more than one species of monomer, and a styrene copolymer is a chain of polymers consisting of styrene and acrylate. |
| Thermoplastics | Thermoplastics are defined as polymers that become soft material when it is heated and becomes hard when it is cooled. Thermoplastics have wide-ranging properties and can be remolded and recycled without affecting their physical properties. |
| Virgin Plastic | It is a basic form of plastic that has never been used, processed, or developed. It may be considered more valuable than recycled or already used materials. |


Research Methodology
Mordor Intelligence follows a four-step methodology in all our reports.
- Step-1: Identify Key Variables: The quantifiable key variables (industry and extraneous) pertaining to the specific product segment and country are selected from a group of relevant variables & factors based on desk research & literature review; along with primary expert inputs. These variables are further confirmed through regression modeling (wherever required).
- Step-2: Build a Market Model: In order to build a robust forecasting methodology, the variables and factors identified in Step-1 are tested against available historical market numbers. Through an iterative process, the variables required for market forecast are set and the model is built on the basis of these variables.
- Step-3: Validate and Finalize: In this important step, all market numbers, variables and analyst calls are validated through an extensive network of primary research experts from the market studied. The respondents are selected across levels and functions to generate a holistic picture of the market studied.
- Step-4: Research Outputs: Syndicated Reports, Custom Consulting Assignments, Databases & Subscription Platforms


