South Korea Engineering Plastics Market Size and Share
Market Overview
| Study Period | 2020 - 2031 |
|---|---|
| Forecast Data Period | 2026 - 2031 |
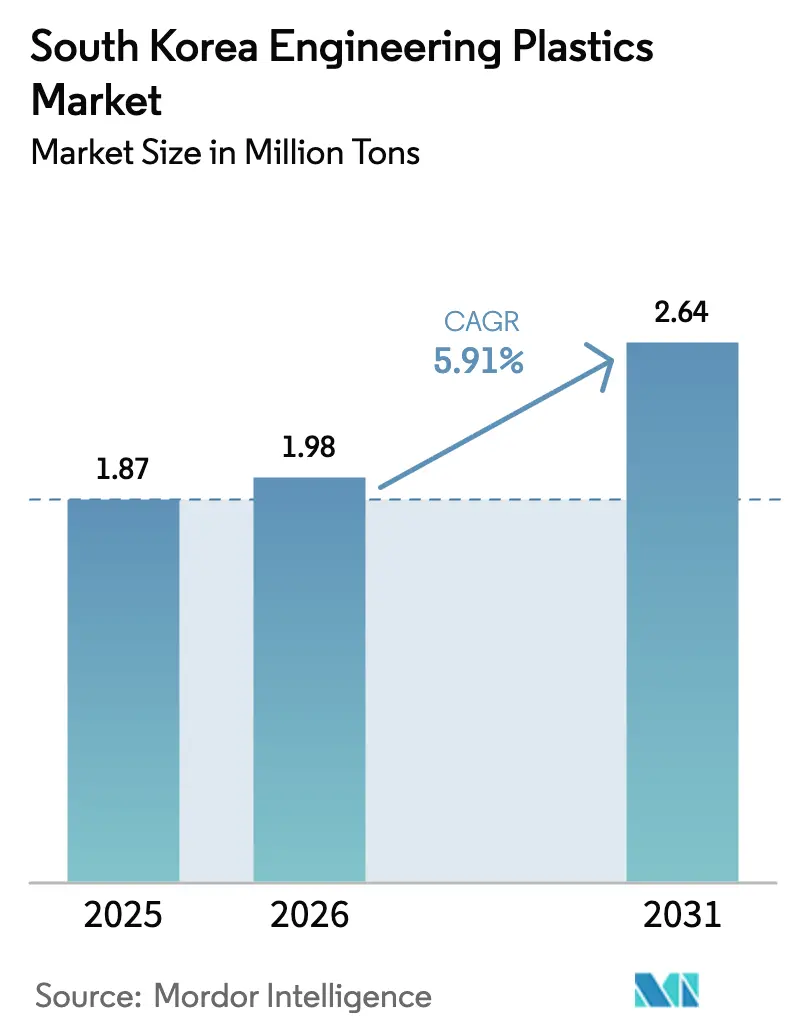
| Base Year Market Size (2025) | 1.87 Million tons |
| Market Volume (2026) | 1.98 Million tons |
| Market Volume (2031) | 2.64 Million tons |
| Growth Rate (2026 - 2031) | 5.91% CAGR |
| Market Concentration | High |
Major Players *Disclaimer: Major Players sorted in no particular order Image © Mordor Intelligence. Reuse requires attribution under CC BY 4.0. | |
South Korea Engineering Plastics Market Analysis by Mordor Intelligence
South Korea Engineering Plastics Market size in 2026 is estimated at 1.98 million tons, growing from 2025 value of 1.87 million tons with 2031 projections showing 2.64 million tons, growing at 5.91% CAGR over 2026-2031. Robust demand from automotive lightweighting, semiconductor encapsulation, and hydrogen-economy components anchors steady volume growth while shielding producers from commodity-grade price erosion. Local suppliers leverage integrated naphtha crackers and downstream compounding capacity to cut logistics costs and speed product customization for Samsung, Hyundai, and LG affiliates, strengthening the South Korea engineering plastics market against low-cost Chinese imports. Portfolio shifts toward bio-based resins, chemically recycled ABS, and electrically heated steam-cracker feedstocks align with national net-zero pledges and help maintain premium pricing. Government grants under the Materials-Parts-Equipment program and cluster incentives in Gumi and Ulsan accelerate scale-up of high-performance grades that service emerging battery, fuel-cell, and 5G infrastructure applications.
Key Report Takeaways
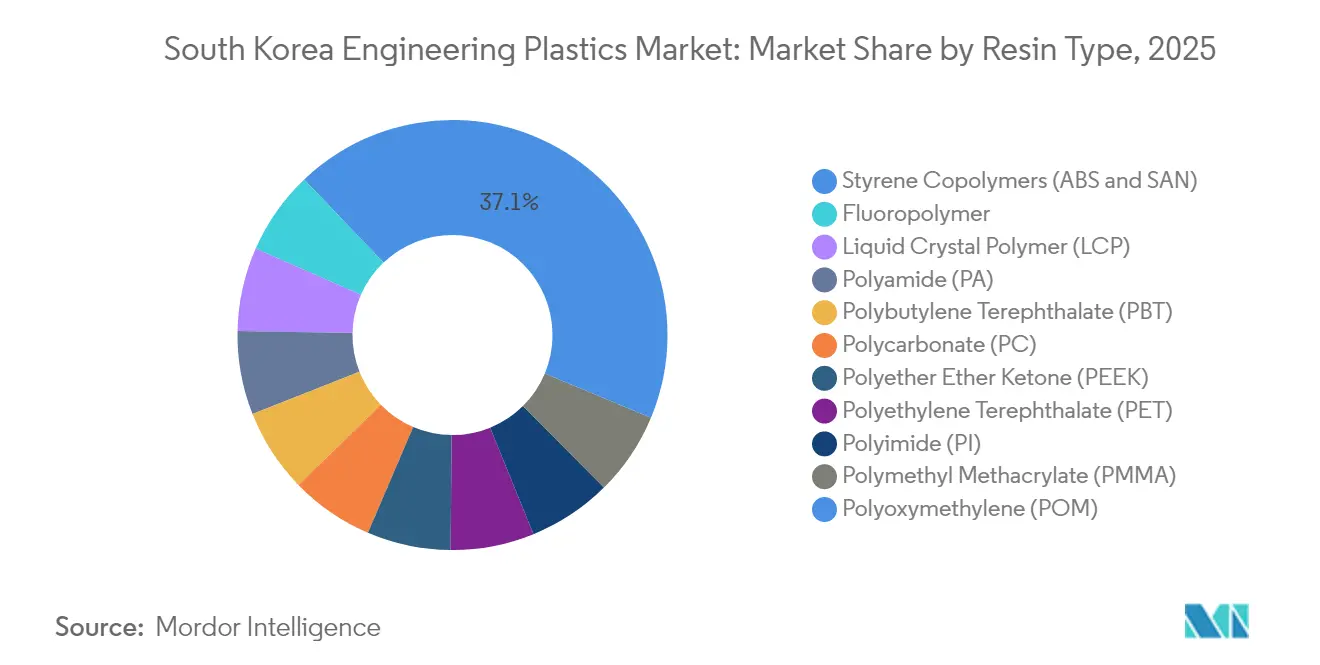
- By resin type, styrene copolymers led with 37.12% South Korea engineering plastics market share in 2025; fluoropolymers are projected to expand at a 7.32% CAGR to 2031.
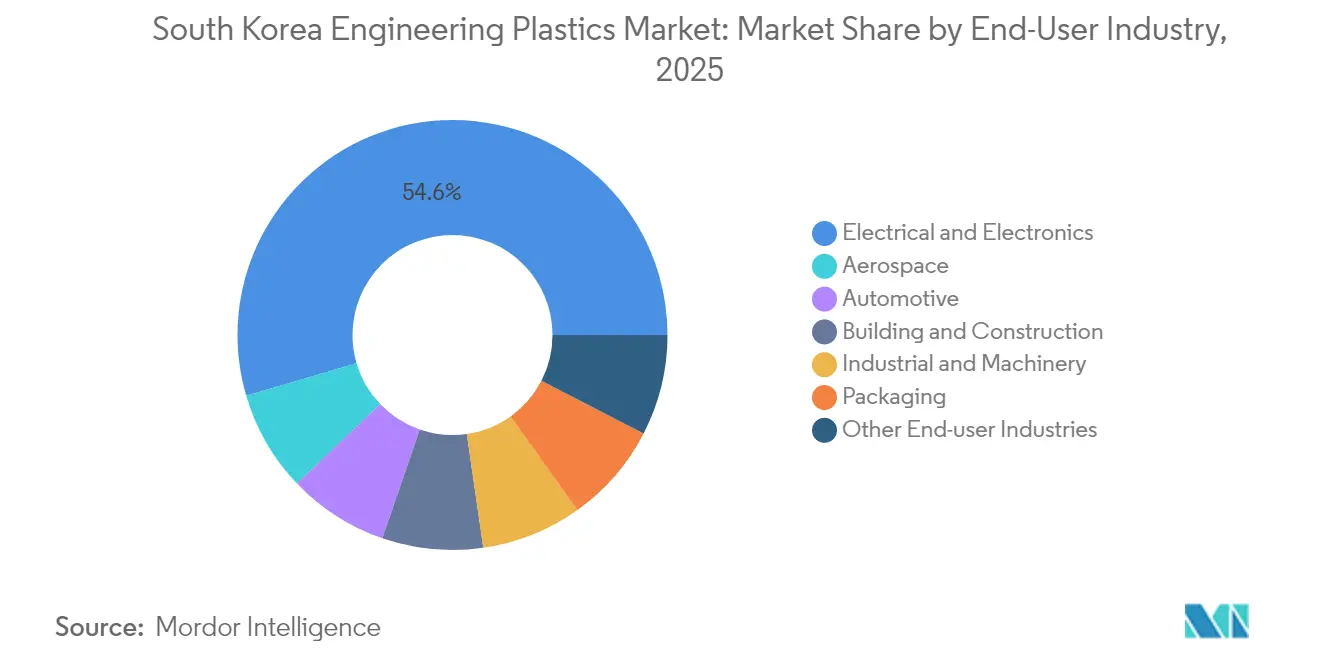
- By end-user industry, electrical & electronics held 54.55% of the South Korea engineering plastics market size in 2025, while automotive is advancing at a 6.78% CAGR through 2031.
Note: Market size and forecast figures in this report are generated using Mordor Intelligence’s proprietary estimation framework, updated with the latest available data and insights as of 2026.
South Korea Engineering Plastics Market Trends and Insights
Drivers Impact Analysis*
| Driver | (~) % Impact on CAGR Forecast | Geographic Relevance | Impact Timeline |
|---|---|---|---|
| Lightweight automotive components | +1.80% | Ulsan, Asan automotive corridors | Medium term (2-4 years) |
| Semiconductor & electronics encapsulation | +2.10% | Gyeonggi, Chungcheong semiconductor hubs | Short term (≤ 2 years) |
| Government incentives for high-performance R&D | +0.90% | National research institutes | Long term (≥ 4 years) |
| EV battery enclosure & thermal control | +1.20% | Ulsan, Gwangju EV plants | Medium term (2-4 years) |
| Hydrogen-economy component demand | +0.70% | Ulsan, Changwon hydrogen valleys | Long term (≥ 4 years) |
| Source: Mordor Intelligence | |||


Growing Demand for Lightweight Automotive Components
Hyundai Motor Group’s plan to electrify 50% of its sales portfolio by 2030 accelerates the substitution of polymers for metals in under-the-hood brackets, battery enclosures, and interior modules[1]Hyundai Motor Company, “Hyundai Motor Group to Invest in Electric and Hydrogen Mobility,” hyundai.com . Weight savings of 10-15 kg per vehicle deliver a one-for-one range extension of 0.6 km per kilogram, making polyamide and polycarbonate grades a direct enabler of consumer-valued mileage. Software-defined vehicles concentrate more sensors and domain controllers behind slim instrument panels that require electromagnetic-shielded ABS blends. Korean Tier-1 suppliers co-design over-molded seat frames and thermally conductive motor housings, creating sticky long-term contracts that insulate the South Korea engineering plastics market from spot price swings.
Rising Adoption in Semiconductor & Electronics Encapsulation
Samsung’s high-bandwidth memory expansion and SK Hynix’s next-gen NAND lines specify liquid-crystal polymers and high-temperature polyimides to survive 260 °C reflow without warpage. Local sourcing of these niche resins reduces geopolitical risk tied to Japanese supply routes while shortening lead times by 30%. Packaging moves from wire-bond to flip-chip architectures, increasing stress on mold compounds, pushing demand for silica-filled epoxy-modified engineering plastics with 0.5 W/m·K thermal conductivity. Cluster subsidies in Gyeonggi fund shared metrology labs, letting SMEs verify coefficient-of-thermal-expansion compliance at lower cost.
Government Incentives for High-Performance Material R&D
The KRW 1.7 trillion MPE program offers 50% matching funds for pilot polymer lines and tax credits up to 30% for bio-based resin R&D. KRICT and KIST collaborate with LG Chem on chemically recycled ABS that retains 92% of virgin impact strength after two cycles. Funds also underwrite process-intensive license fees for PEEK and polyphthalamide, closing capability gaps against imported grades. Policy certainty encourages private capex: Lotte Engineering Plastics earmarked KRW 300 billion for compounding lines able to blend 40% recycled ABS without color drift.
Hydrogen-Economy Component Requirements
Demonstration fuel-cell trucks in Ulsan incorporate perfluoroalkoxy tubing and PEEK valve seats resistant to acidic membranes and 100 °C operating cycles. Hydrogen storage modules adopt carbon-fiber-reinforced polyamide liners, trimming 30% weight against steel and supporting 700 bar service pressure. Government-designated hydrogen valleys create anchor orders that secure payback for fluoropolymer investments by Daikin and KEP, providing a nascent yet strategic volume stream for the South Korea engineering plastics market.
Restraints Impact Analysis*
| Restraint | (~) % Impact on CAGR Forecast | Geographic Relevance | Impact Timeline |
|---|---|---|---|
| Feedstock price volatility | -1.40% | Yeosu, Ulsan, Daesan crackers | Short term (≤ 2 years) |
| Circular-economy & recycling mandates | -0.80% | Nationwide | Medium term (2-4 years) |
| HF constraints for fluoropolymers | -0.60% | Specialty chemical producers | Short term (≤ 2 years) |
| Source: Mordor Intelligence | |||
Feedstock Price Volatility
Average naphtha import cost climbed to USD 720/ton in 2024 while polymer selling prices slipped 4%, squeezing EBITDA margins by 220 basis points. Integrated sites hedge up to 50% of their monthly volume through Dubai crude-linked swaps, yet ethylene-propylene spreads remain 15% below their five-year means. Deferred maintenance on Yeosu steam crackers threatens unplanned outages during price spikes, compelling producers to operate at sub-optimal load factors that raise per-unit energy cost by 7%. These gyrations limit long-cycle investments essential for next-generation resin capacity.
Stringent Circular-Economy & Recycling Mandates
The Revised Resource Recycling Act requires 10% recycled content in PET by 2025, increasing to 30% and expanding to engineering plastics by 2030, while also imposing upfront sorting and de-inking costs. Automotive OEMs resist inconsistent color and odor traits in recycled ABS, causing re-qualification cycles that delay product launches. Producers invest in solvent-based depolymerization lines costing USD 180 million each, yet offtake contracts cover only 60% capacity, clouding ROI. Non-compliance leads to deposit fees equal to 4% of annual turnover, presenting a meaningful earnings risk.
*Our forecasts treat driver/restraint impacts as directional, not additive. The impact forecasts reflect baseline growth, mix effects, and variable interactions.
Segment Analysis
By Resin Type: Styrene Copolymers Lead Dual Performance
Styrene copolymers held 37.12% South Korea engineering plastics market share in 2025 and are projected to expand at a 7.48% CAGR through 2031, positioning the segment atop both volume and growth rankings. Chemical recycling pilots achieve 92% yield, letting ABS compounds include 30% recycled feed while retaining IZOD impact of 250 J/m. Fluoropolymers capture premium niches in semiconductor wet benches and EV gasket films, commanding prices 8-10 times higher than ABS yet limited by HF feedstock risk. Polyamide advances shift toward long-chain and aromatic variants such as PA610 and polyphthalamide, improving hydrolysis resistance for fuel-cell plates. Polycarbonate maintains relevance for panoramic sunroofs and OLED TV frames; new anti-yellowing stabilizers extend lifetime by 25%. Bio-based PBT from corn-derived 1,4-butanediol debuts at LG Chem’s Yeosu site, addressing EPR scoring metrics without sacrificing melt flow for high-speed injection.


By End-User Industry: Electronics Sector Dominance Intensifies
Electrical & electronics captured 54.55% South Korea engineering plastics market size in 2025 and is set to rise at a 7.45% CAGR on the back of advanced node migration and foldable device rollouts. Increased multilayer ceramic capacitor (MLCC) adoption drives polyphenylene sulfide consumption, while 5G base-station antennas utilize glass-fiber-reinforced LCP radomes that reduce dielectric loss by 15%. Driven by the expansion of EV production, the automotive sector is anticipated to sustain a consistent demand for flame-retardant polymer blends. Building & construction applications leverage high-R-value foam panels; Koreans adopt polyisocyanurate-modified PET core structures that meet strict fire codes. Industrial machinery uses self-lubricating POM gears, cutting maintenance downtime 20%, and aerospace interests explore Ketone-Ether-Ketone-Ketone alternates for bleed-air ducts, though volume remains niche.
Geography Analysis
Yeosu, Ulsan, and Daesan petrochemical belts host 84% of national resin capacity, enabling integrated naphtha cracking, polymerization, and compounding within a 30 km radius that lowers inbound feedstock logistics by USD 15/ton. Local governments offer 10-year property-tax holidays to attract extrusion and injection molding SMEs, reinforcing the South Korea engineering plastics market cluster model that speeds new-grade qualification for Samsung’s nearby appliance plants.
Gyeonggi Province houses the world’s densest semiconductor packaging zone, consuming 40% of domestic liquid crystal polymer and polyimide supply for high-density interconnect (HDI) boards. The presence of shared cleanroom pilot lines at the Gumi Engineering Plastics Park cuts prototype iteration time to two weeks, providing a critical speed edge against overseas competitors. Inland transport via the Gyeongbu Expressway ensures 24-hour delivery to Chungcheong testing labs, minimizing downtime for line trials.
Southern clusters in Ulsan and Gwangju evolve as EV power-train hubs; Ulsan’s hydrogen valley blends PEEK fuel-cell plates with carbon-fiber reinforcements, while Gwangju’s AI-based molding centers automate defect detection, slashing scrap by 3%. Export-oriented firms ship 38% of engineering plastics to ASEAN and India, leveraging RCEP tariff cuts that phased to zero in 2025. Yet import dependence on HF and specialty monomers from Japan remains a vulnerability that firms mitigate through Thai and U.S. JV investments.
Competitive Landscape
The South Korea engineering plastics market is highly consolidated. International majors such as BASF, Daikin, and Mitsubishi Chemical round out premium application spaces[2]BASF Korea, “World’s First Electrically Heated Steam Cracker Pilot,” basf.com . Domestic champions exploit full-chain integration from naphtha cracking to compounding, granting cost and service advantages that offset Chinese commodity inflows. Strategic pivots emphasize chemically recycled ABS, bio-PET, and electrically heated crackers; BASF’s pilot in Ludwigshafen validates 90% CO₂ reduction potential that LG Chem aims to replicate at Yeosu by 2028.
M&A and JVs proliferate: SK C and Teijin co-invest in high-toughness PEEK lines for EV gears, while Daikin partners with KEP on fluoropolymer recycling to hedge HF risk. Smaller players such as Samyang exit low-margin PC sheets to focus on food-contact bio-PBS, showing rationalization pressure in commodity niches. Foreign players hedge currency swings via local toll compounding, integrating Korean color-matching expertise into global supply.
Customer intimacy is a durable moat; LG Chem embeds engineers inside Hyundai research centers to co-tune flame-retardant PA66, while Lotte runs a “House of ABS” technical center offering mold-flow simulation within 48 hours. Producers also sign renewable-power PPAs covering up to 60% of electricity needs, a differentiator for electronics OEMs tracking Scope 3 emissions. Despite cost headwinds, R&D spend averages 3.5% of sales, underscoring the sector’s innovation bias.
South Korea Engineering Plastics Industry Leaders
Kolon Industries Inc.
KEP (Korea Engineering Plastics Co. Ltd.)
Kumho Petrochemical
LG Chem
Lotte Chemical
- *Disclaimer: Major Players sorted in no particular order


Recent Industry Developments
- September 2024: Lotte Engineering Plastics, a subsidiary of Lotte Chemical, has announced a significant investment of KRW 300 billion (~USD 225 million). This initiative aims to increase its annual production capacity to 500,000-700,000 tons. The company is strategically targeting automotive and electronics applications, with a focus on enhancing recycled content capabilities.
- July 2024: LG Chem has completed the construction of a 50,000-tonne ABS production facility in India, marking the company's strategic expansion into high-growth Asian markets while continuing to support its Korean operations for premium applications.


South Korea Engineering Plastics Market Report Scope
Aerospace, Automotive, Building and Construction, Electrical and Electronics, Industrial and Machinery, Packaging are covered as segments by End User Industry. Fluoropolymer, Liquid Crystal Polymer (LCP), Polyamide (PA), Polybutylene Terephthalate (PBT), Polycarbonate (PC), Polyether Ether Ketone (PEEK), Polyethylene Terephthalate (PET), Polyimide (PI), Polymethyl Methacrylate (PMMA), Polyoxymethylene (POM), Styrene Copolymers (ABS and SAN) are covered as segments by Resin Type.| Fluoropolymer | Ethylenetetrafluoroethylene (ETFE) |
| Fluorinated Ethylene-propylene (FEP) | |
| Polytetrafluoroethylene (PTFE) | |
| Polyvinylfluoride (PVF) | |
| Polyvinylidene Fluoride (PVDF) | |
| Other Sub Resin Types | |
| Liquid Crystal Polymer (LCP) | |
| Polyamide (PA) | Aramid |
| Polyamide (PA) 6 | |
| Polyamide (PA) 66 | |
| Polyphthalamide | |
| Polybutylene Terephthalate (PBT) | |
| Polycarbonate (PC) | |
| Polyether Ether Ketone (PEEK) | |
| Polyethylene Terephthalate (PET) | |
| Polyimide (PI) | |
| Polymethyl Methacrylate (PMMA) | |
| Polyoxymethylene (POM) | |
| Styrene Copolymers (ABS, SAN) |
| Aerospace |
| Automotive |
| Building and Construction |
| Electrical and Electronics |
| Industrial and Machinery |
| Packaging |
| Other End-user Industries |
| By Resin Type | Fluoropolymer | Ethylenetetrafluoroethylene (ETFE) |
| Fluorinated Ethylene-propylene (FEP) | ||
| Polytetrafluoroethylene (PTFE) | ||
| Polyvinylfluoride (PVF) | ||
| Polyvinylidene Fluoride (PVDF) | ||
| Other Sub Resin Types | ||
| Liquid Crystal Polymer (LCP) | ||
| Polyamide (PA) | Aramid | |
| Polyamide (PA) 6 | ||
| Polyamide (PA) 66 | ||
| Polyphthalamide | ||
| Polybutylene Terephthalate (PBT) | ||
| Polycarbonate (PC) | ||
| Polyether Ether Ketone (PEEK) | ||
| Polyethylene Terephthalate (PET) | ||
| Polyimide (PI) | ||
| Polymethyl Methacrylate (PMMA) | ||
| Polyoxymethylene (POM) | ||
| Styrene Copolymers (ABS, SAN) | ||
| By End-User Industry | Aerospace | |
| Automotive | ||
| Building and Construction | ||
| Electrical and Electronics | ||
| Industrial and Machinery | ||
| Packaging | ||
| Other End-user Industries | ||


Market Definition
- End-user Industry - Packaging, Electrical & Electronics, Automotive, Building & Construction, and Others are the end-user industries considered under the engineering plastics market.
- Resin - Under the scope of the study, consumption of virgin resins like Fluoropolymer, Polycarbonate, Polyethylene Terephthalate, Polybutylene Terephthalate, Polyoxymethylene, Polymethyl Methacrylate, Styrene Copolymers, Liquid Crystal Polymer, Polyether Ether Ketone, Polyimide, and Polyamide in the primary forms are considered. Recycling has been provided separately under its individual chapter.
| Keyword | Definition |
|---|---|
| Acetal | This is a rigid material that has a slippery surface. It can easily withstand wear and tear in abusive work environments. This polymer is used for building applications such as gears, bearings, valve components, etc. |
| Acrylic | This synthetic resin is a derivative of acrylic acid. It forms a smooth surface and is mainly used for various indoor applications. The material can also be used for outdoor applications with a special formulation. |
| Cast film | A cast film is made by depositing a layer of plastic onto a surface then solidifying and removing the film from that surface. The plastic layer can be in molten form, in a solution, or in dispersion. |
| Colorants & Pigments | Colorants & Pigments are additives used to change the color of the plastic. They can be a powder or a resin/color premix. |
| Composite material | A composite material is a material that is produced from two or more constituent materials. These constituent materials have dissimilar chemical or physical properties and are merged to create a material with properties unlike the individual elements. |
| Degree of Polymerization (DP) | The number of monomeric units in a macromolecule, polymer, or oligomer molecule is referred to as the degree of polymerization or DP. Plastics with useful physical properties often have DPs in the thousands. |
| Dispersion | To create a suspension or solution of material in another substance, fine, agglomerated solid particles of one substance are dispersed in a liquid or another substance to form a dispersion. |
| Fiberglass | Fiberglass-reinforced plastic is a material made up of glass fibers embedded in a resin matrix. These materials have high tensile and impact strength. Handrails and platforms are two examples of lightweight structural applications that use standard fiberglass. |
| Fiber-reinforced polymer (FRP) | Fiber-reinforced polymer is a composite material made of a polymer matrix reinforced with fibers. The fibers are usually glass, carbon, aramid, or basalt. |
| Flake | This is a dry, peeled-off piece, usually with an uneven surface, and is the base of cellulosic plastics. |
| Fluoropolymers | This is a fluorocarbon-based polymer with multiple carbon-fluorine bonds. It is characterized by high resistance to solvents, acids, and bases. These materials are tough yet easy to machine. Some of the popular fluoropolymers are PTFE, ETFE, PVDF, PVF, etc. |
| Kevlar | Kevlar is the commonly referred name for aramid fiber, which was initially a Dupont brand for aramid fiber. Any group of lightweight, heat-resistant, solid, synthetic, aromatic polyamide materials that are fashioned into fibers, filaments, or sheets is called aramid fiber. They are classified into Para-aramid and Meta-aramid. |
| Laminate | A structure or surface composed of sequential layers of material bonded under pressure and heat to build up to the desired shape and width. |
| Nylon | They are synthetic fiber-forming polyamides formed into yarns and monofilaments. These fibers possess excellent tensile strength, durability, and elasticity. They have high melting points and can resist chemicals and various liquids. |
| PET preform | A preform is an intermediate product that is subsequently blown into a polyethylene terephthalate (PET) bottle or a container. |
| Plastic compounding | Compounding consists of preparing plastic formulations by mixing and/or blending polymers and additives in a molten state to achieve the desired characteristics. These blends are automatically dosed with fixed setpoints usually through feeders/hoppers. |
| Plastic pellets | Plastic pellets, also known as pre-production pellets or nurdles, are the building blocks for nearly every product made of plastic. |
| Polymerization | It is a chemical reaction of several monomer molecules to form polymer chains that form stable covalent bonds. |
| Styrene Copolymers | A copolymer is a polymer derived from more than one species of monomer, and a styrene copolymer is a chain of polymers consisting of styrene and acrylate. |
| Thermoplastics | Thermoplastics are defined as polymers that become soft material when it is heated and becomes hard when it is cooled. Thermoplastics have wide-ranging properties and can be remolded and recycled without affecting their physical properties. |
| Virgin Plastic | It is a basic form of plastic that has never been used, processed, or developed. It may be considered more valuable than recycled or already used materials. |


Research Methodology
Mordor Intelligence follows a four-step methodology in all our reports.
- Step-1: Identify Key Variables: The quantifiable key variables (industry and extraneous) pertaining to the specific product segment and country are selected from a group of relevant variables & factors based on desk research & literature review; along with primary expert inputs. These variables are further confirmed through regression modeling (wherever required).
- Step-2: Build a Market Model: In order to build a robust forecasting methodology, the variables and factors identified in Step-1 are tested against available historical market numbers. Through an iterative process, the variables required for market forecast are set and the model is built on the basis of these variables.
- Step-3: Validate and Finalize: In this important step, all market numbers, variables and analyst calls are validated through an extensive network of primary research experts from the market studied. The respondents are selected across levels and functions to generate a holistic picture of the market studied.
- Step-4: Research Outputs: Syndicated Reports, Custom Consulting Assignments, Databases & Subscription Platforms


