Middle East Engineering Plastics Market Size and Share
Market Overview
| Study Period | 2020 - 2031 |
|---|---|
| Forecast Data Period | 2026 - 2031 |
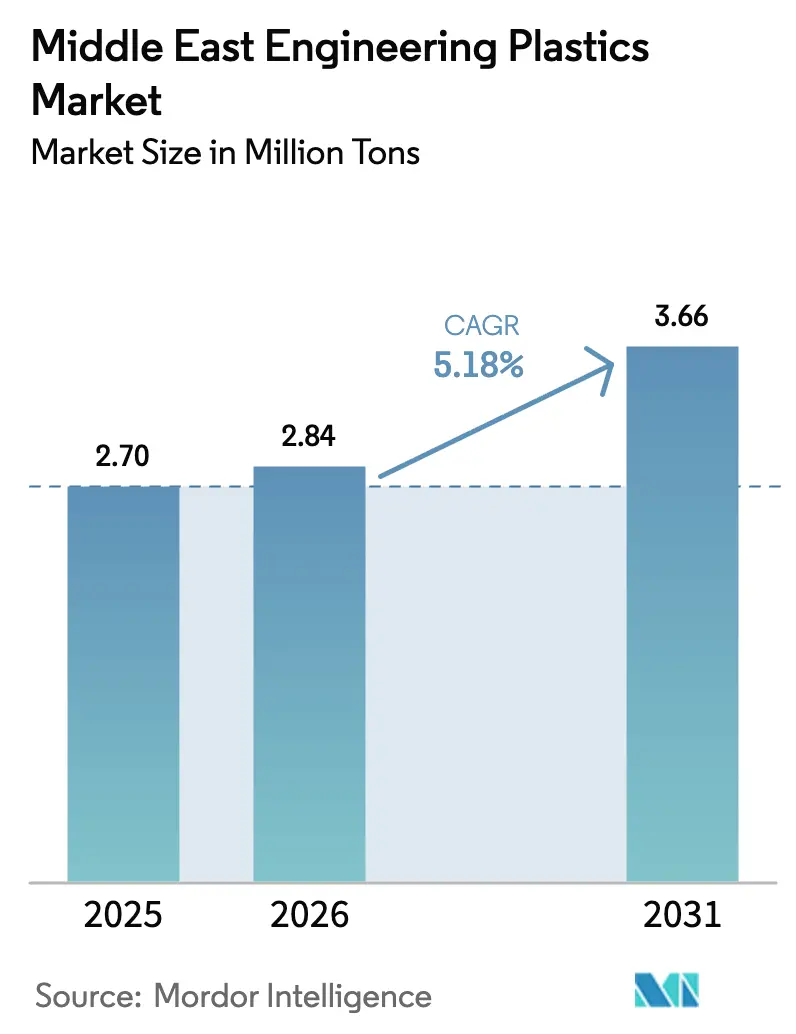
| Base Year Market Size (2025) | 2.70 Million tons |
| Market Volume (2026) | 2.84 Million tons |
| Market Volume (2031) | 3.66 Million tons |
| Growth Rate (2026 - 2031) | 5.18% CAGR |
| Market Concentration | Medium |
Major Players *Disclaimer: Major Players sorted in no particular order Image © Mordor Intelligence. Reuse requires attribution under CC BY 4.0. | |
Middle East Engineering Plastics Market Analysis by Mordor Intelligence
The Middle East Engineering Plastics Market size is expected to grow from 2.70 million tons in 2025 to 2.84 million tons in 2026 and is forecast to reach 3.66 million tons by 2031 at 5.18% CAGR over 2026-2031. This healthy growth confirms that robust downstream petrochemical integration, abundant hydrocarbon feedstocks, and infrastructure mega-projects are combining to lift regional demand for high-performance resins. Rising specification requirements in smart-city construction, automotive lightweighting, and additive manufacturing keep average selling prices firm even as new capacity comes onstream. Regional producers also retain a structural cost advantage because gas-based ethane cracking yields far greater ethylene per unit of feedstock than naphtha routes, protecting margins when global spreads tighten. In parallel, sovereign wealth funds are steering billions of US dollars toward specialty polymer platforms, accelerating the shift from commodity grades to engineered formulations across the Middle East engineering plastics market.
Key Report Takeaways
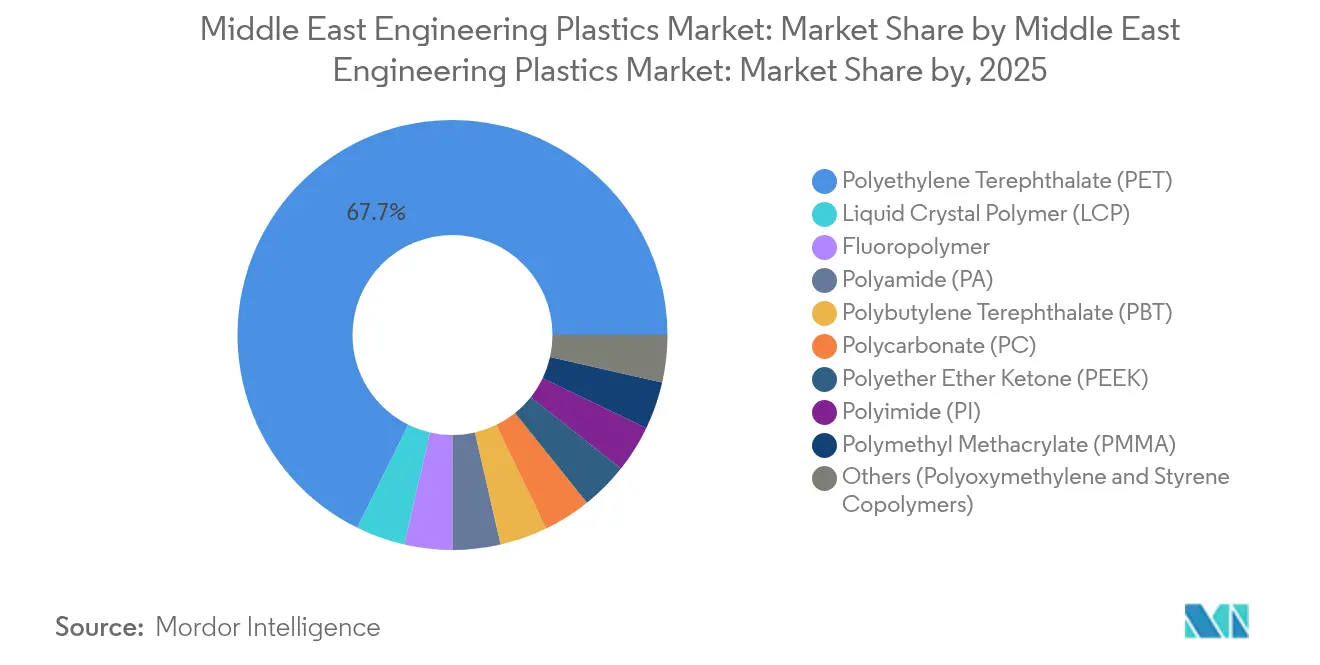
- By resin type, polyethylene terephthalate held 67.70% of the Middle East engineering plastics market share in 2025, while liquid crystal polymer is projected to post the fastest growth rate of 6.72% through 2031.
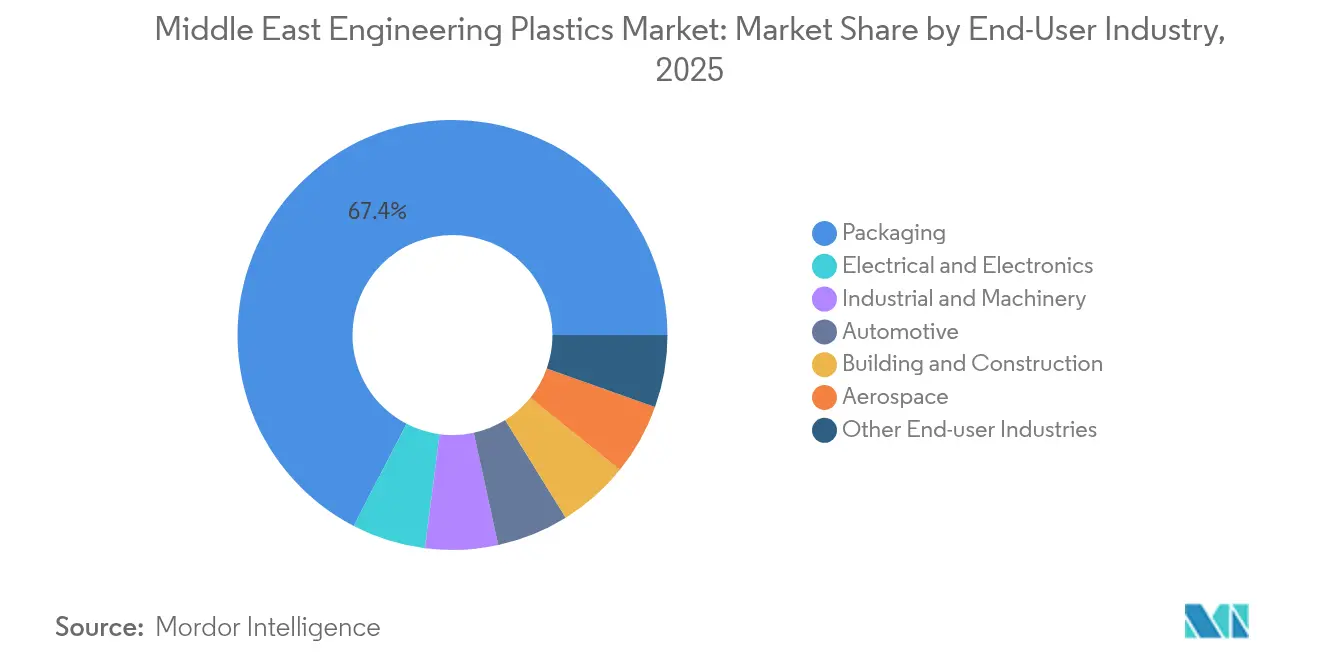
- By end-user industry, packaging accounted for a dominant 67.40% share of the Middle East engineering plastics market size in 2025; electrical and electronics is set to expand at an 8.25% CAGR to 2031.
- By geography, the Rest of the Middle East and Africa captured 40.55% of the Middle East engineering plastics market size in 2025, whereas Saudi Arabia is forecast to lead growth at a 5.62% CAGR through 2031.
Note: Market size and forecast figures in this report are generated using Mordor Intelligence’s proprietary estimation framework, updated with the latest available data and insights as of 2026.
Middle East Engineering Plastics Market Trends and Insights
Drivers Impact Analysis*
| Driver | (~) % Impact on CAGR Forecast | Geographic Relevance | Impact Timeline |
|---|---|---|---|
| Downstream conversion capacity expansion | +1.2% | Saudi Arabia, UAE, Qatar | Medium term (2-4 years) |
| Automotive lightweighting mandates | +0.8% | Saudi Arabia, UAE | Long term (≥ 4 years) |
| Mega-projects specifying FR-rated PC & PA | +1.0% | Saudi Arabia, UAE, Qatar | Medium term (2-4 years) |
| Sovereign funds’ push into specialty polymers | +0.7% | GCC-wide | Long term (≥ 4 years) |
| Additive-manufacturing hubs shifting to PEEK&LCP | +0.6% | Dubai, Riyadh | Medium term (2-4 years) |
| Source: Mordor Intelligence | |||


Surge in Downstream Conversion Capacity Across GCC
QatarEnergy and Chevron Phillips Chemical are constructing a USD 6 billion Ras Laffan complex that will add 2.08 million tons of ethylene and 1.68 million tons of HDPE, cementing Qatar’s role as a low-cost supplier to global engineering-grade resin markets. Oman's USD 6.7 billion Liwa Plastics Industries Complex brings polyethylene production to the sultanate for the first time, raising OQ’s combined PE and PP output to 1.4 million tons per year. Kuwait Integrated Petroleum Industries Company is executing the PRIZe project, which will increase polypropylene output by 1,000% and aromatics capacity by 200%. These investments anchor the Middle East engineering plastics market by securing resin availability, shortening lead times for regional converters, and enabling manufacturers to meet stricter performance specifications without relying on imports. Local feedstock economics enable producers to price competitively in Asian export markets while maintaining attractive margins at home, thereby further reinforcing supply-chain resilience.
Automotive Lightweighting Mandates in Saudi CAFE Program & UAE EV Roadmap
Saudi Arabia has enacted Corporate Average Fuel Economy standards that compel vehicle assemblers to cut fleet emissions, spurring demand for polyamide intake manifolds, polycarbonate lighting modules, and advanced thermoplastic composites. The Saudi Standards Organization defines detailed part-level requirements that favor engineering plastics over metals in powertrain and interior components[1]Saudi Standards, Metrology and Quality Organization, “Corporate Average Fuel Economy Regulations,” saso.gov.sa. The UAE’s electric-vehicle roadmap complements these rules by encouraging light, energy-efficient battery enclosures and thermal-management systems based on engineering resins instead of aluminum. Regional automakers partnering with local compounders can reduce component weight by 15-30%, enabling them to meet regulatory targets without compromising safety or durability. These policies anchor long-term resin offtake agreements that underpin capacity-utilization plans across the Middle East engineering plastics market.
Surge of Mega-Projects Specifying FR-Rated PC & PA for Smart-City Infrastructure
NEOM, Red Sea Global, and other giga-projects impose flame-retardancy, UV stability, and thermal-shock thresholds that only high-performance polycarbonate, polyamide, and PBT grades can satisfy. Dubai’s 3D Printing Strategy mandates that 25% of new buildings integrate additive manufacturing by 2030, pushing contractors to adopt PEEK and liquid crystal polymers with higher heat-deflection temperatures than commodity PLA. Saudi Building Codes SBC 201, 501, and 601 strengthen fire-safety requirements, locking in demand for V-0-rated engineering plastics in conduits, panels, and smart-grid housings. Suppliers that can certify compliance with these codes gain preferred-vendor status, enabling premium pricing amid tight delivery windows.
GCC Sovereign Funds’ Push into Specialty Polymers Drives Local Availability
Abu Dhabi National Oil Company’s USD 60 billion combination of Borouge, Borealis, and Nova Chemicals has created a 13.6 million-ton polyolefins powerhouse, offering downstream customers a broader portfolio of specialty grades produced within the region. Saudi Arabia’s Public Investment Fund is directing capital into fourth-industrial-revolution technologies, encouraging domestic precision compounding lines for polycarbonates, PPO blends, and polyetherimides. These moves translate into faster qualification cycles and just-in-time deliveries, reducing working-capital burdens for converters across the Middle East engineering plastics market.
Restraints Impact Analysis*
| Restraint | (~) % Impact on CAGR Forecast | Geographic Relevance | Impact Timeline |
|---|---|---|---|
| Volatile naphtha / condensate feedstock prices | -0.9% | Region-wide | Short term (≤ 2 years) |
| Shortage of certified recycling streams for engineering resins | -0.6% | GCC, especially UAE and Saudi Arabia | Long term (≥ 4 years) |
| Skills gap in precision injection-molding labor | -0.4% | Saudi Arabia, UAE | Medium term (2-4 years) |
| Source: Mordor Intelligence | |||
Volatile Naphtha / Condensate Feedstock Prices Amid Geopolitical Risk
Shipping disruptions in the Red Sea threaten 11% of global trade flows, increasing insurance premiums and driving up naphtha costs for regional crackers that rely on condensate imports[2]International Monetary Fund, “Red Sea Shipping Chokepoints,” imf.org. Ethylene-propylene spreads narrowed by 14.1% in 2024, eroding profitability for producers that cannot fully pass cost spikes to converters. While gas-based ethane routes immunize part of the chain, specialty polyesters and polyamides still depend on aromatic intermediates derived from volatile naphtha. Volatility complicates annual offtake contracts and may delay expansions until price stability returns.
Chronic Shortage of Certified Recycling Streams Limits Circular-Grade Engineering Resins
Saudi Investment Recycling Company has earmarked USD 10 billion for waste-management assets, yet existing collection covers only a fraction of post-industrial engineering plastic waste. High-performance resins contain fillers, fibers, and additives that require advanced sorting and compatibilization, which are not available at conventional mechanical recycling plants. OEMs pursuing global recycled-content targets, therefore, continue to import certified circular grades, leaving a gap in domestic supply and limiting the Middle East engineering plastics market's ability to capture full value in sustainable applications.
*Our forecasts treat driver/restraint impacts as directional, not additive. The impact forecasts reflect baseline growth, mix effects, and variable interactions.
Segment Analysis
By Resin Type: PET Dominance Drives Packaging Applications
Polyethylene terephthalate accounted for 67.70% of the Middle East's engineering plastics market share in 2025, underscoring the significant role of beverage and food packaging in regional consumption. PET’s clarity and barrier properties suit long-haul distribution between the Gulf and export destinations. Producers capitalize on the Middle East engineering plastics market size advantage by integrating bottling-grade PET with downstream preform molding, reducing logistics costs and greenhouse-gas emissions. Liquid crystal polymer (LCP) is the fastest riser, with a 6.72% CAGR through 2031, because electronics assemblers require high-frequency connectors that LCP’s low dielectric constant supports. Regional demand for polyamide 6 and 66 is expanding as local OEMs substitute metal components to reduce vehicle mass and fuel consumption. Fluoropolymers, such as PVDF and ETFE, maintain a niche status in corrosive oil-and-gas services, where performance takes precedence over price. PEEK demand gains momentum in the aerospace and medical device sectors, thanks to its continuous-use temperature of 260°C.
The Middle East engineering plastics market remains supply-secure because ADNOC, SABIC, and QatarEnergy operate backward-integrated units that produce PTA, caprolactam, and bisphenol-A on-site. New compounding lines in Ruwais and Jubail offer flame-retarded, UV-stabilized, and glass-fiber-reinforced grades, tightening technical support loops for converters. Import dependence shifts to additive packages and small-volume resins such as polyetherimide, although regional research centers are piloting local synthesis. OEMs welcome shorter lead times and reduced currency risk exposures, thereby reinforcing their loyalty to domestic suppliers.


By End-User Industry: Electronics Growth Accelerates Beyond Packaging Leadership
Packaging preserved a commanding 67.40% share of the Middle East engineering plastics market in 2025, as food, beverage, and personal-care products expanded through Gulf logistics hubs. PET, HDPE, and PP converted into preforms, films, and closures moved swiftly thanks to automated handling and climate-controlled storage that guard product integrity. The electrical and electronics sector is the fastest-growing sector, with an 8.25% CAGR, driven by telecom operators rolling out 5G base stations and data centers that require heat-stable, flame-retardant housings. High-CTI PBT and halogen-free PC/ABS blends replace legacy materials in connectors and enclosures to meet IEC 60695 fire standards.
Automotive demand gains traction as local assembly plants qualify glass-fiber-filled PP and polyamide air-intake manifolds, cutting weight while tolerating under-hood temperatures. Building and construction applications utilize polycarbonate sheets and PA conduits that meet the tougher GCC fire codes. The aerospace and medical segments, although smaller in terms of tonnage, command premium prices for PEEK and PEI components that require stringent certifications. Industrial machinery absorbs acetal and PBT in pumps and valves exposed to aggressive chemicals, safeguarding uptime in petrochemical and desalination plants.
Geography Analysis
Saudi Arabia is expected to contribute the highest growth trajectory, with a 5.62% CAGR anticipated through 2031, as Vision 2030’s National Industrial Development and Logistics Program channels capital into automotive, chemicals, and advanced manufacturing. Public Investment Fund investments exceeding USD 100 billion drive petrochemical capacity additions and downstream diversification, anchoring long-term resin demand across automotive interiors, electric components, and smart infrastructure devices. New regulations covering corporate average fuel economy and stricter Saudi Building Codes reinforce the uptake of technical-grade polymers, elevating the Middle East's engineering plastics market presence within the kingdom.
The United Arab Emirates leverages Operation 300bn and the “Make it in the Emirates” campaign to boost industrial GDP to AED 300 billion by 2031. Free-zone incentives, 100% foreign ownership, and competitive utilities encourage international compounders to co-locate in Ruwais and KIZAD. Dubai’s 3D Printing Strategy accelerates the adoption of PEEK and LCP in architectural facades and medical implants, elevating the average resin value. The Borouge Group International formation secures polyolefin and specialty-grade supply for domestic converters while granting export reach into Asia and Europe.
The rest of the Middle East and Africa accounted for 40.55% of the Middle East engineering plastics market size in 2025, driven by Qatar, Kuwait, Oman, and emerging North African economies. QatarEnergy’s Ras Laffan complex supplies HDPE and swing-grade LLDPE, supporting local demand for pipe, film, and 3D printing feedstock. Kuwait’s PRIZe complex lifts polypropylene exports, displacing Asian suppliers in regional film and automotive compounding. Oman’s Liwa Plastics Industries Complex supplies domestic conversion clusters in Sohar and Duqm, reducing lead times for Gulf Cooperation Council customers. Cross-border trade and pan-Arab free-trade agreements help smaller markets tap into the broader Middle East engineering plastics market, smoothing seasonal demand swings.
Competitive Landscape
The Middle East Engineering Plastics market shows moderate consolidation, with integrated incumbents retaining cost leadership while nimble specialty players carve out high-margin niches. Sustainability is emerging as a competitive battlefield. Producers also deploy digital twins and predictive-maintenance systems to maximize uptime and energy efficiency, further raising entry barriers. Market entrants must therefore combine technology, feedstock security, and sustainability credentials to gain share in the Middle East engineering plastics market.
Middle East Engineering Plastics Industry Leaders
SABIC
Petro Rabigh
Sipchem Company
BASF
Celanese Corporation
- *Disclaimer: Major Players sorted in no particular order


Recent Industry Developments
- January 2025: Time Technoplast Ltd., via its subsidiary Gulf Powerbeat in KSA, unveiled plans for a production facility in Saudi Arabia's MODON Industrial Area. The new plant will focus on manufacturing 1,000-litre Intermediate Bulk Containers (IBCs) and plastic drums. This can benefit the country's engineering plastics industry.
- February 2024: QatarEnergy and Chevron Phillips Chemical started the construction of a USD 6 billion integrated polymers complex in Ras Laffan Industrial City, Qatar. The project will feature an ethane cracker and two high-density polyethylene derivative units, poised to significantly bolster the nation's engineering plastics market.


Middle East Engineering Plastics Market Report Scope
Aerospace, Automotive, Building and Construction, Electrical and Electronics, Industrial and Machinery, Packaging are covered as segments by End User Industry. Fluoropolymer, Liquid Crystal Polymer (LCP), Polyamide (PA), Polybutylene Terephthalate (PBT), Polycarbonate (PC), Polyether Ether Ketone (PEEK), Polyethylene Terephthalate (PET), Polyimide (PI), Polymethyl Methacrylate (PMMA), Polyoxymethylene (POM), Styrene Copolymers (ABS and SAN) are covered as segments by Resin Type. Saudi Arabia, United Arab Emirates are covered as segments by Country.| Fluoropolymer | Ethylenetetrafluoroethylene (ETFE) |
| Fluorinated Ethylene-propylene (FEP) | |
| Polytetrafluoroethylene (PTFE) | |
| Polyvinylfluoride (PVF) | |
| Polyvinylidene Fluoride (PVDF) | |
| Other Sub Resin Types | |
| Liquid Crystal Polymer (LCP) | |
| Polyamide (PA) | Aramid |
| Polyamide (PA) 6 | |
| Polyamide (PA) 66 | |
| Polyphthalamide | |
| Polybutylene Terephthalate (PBT) | |
| Polycarbonate (PC) | |
| Polyether Ether Ketone (PEEK) | |
| Polyethylene Terephthalate (PET) | |
| Polyimide (PI) | |
| Polymethyl Methacrylate (PMMA) | |
| Polyoxymethylene (POM) | |
| Styrene Copolymers (ABS, SAN) |
| Aerospace |
| Automotive |
| Building and Construction |
| Electrical and Electronics |
| Industrial and Machinery |
| Packaging |
| Other End-user Industries |
| Saudi Arabia |
| United Arab Emirates |
| Rest of Middle East |
| By Resin Type | Fluoropolymer | Ethylenetetrafluoroethylene (ETFE) |
| Fluorinated Ethylene-propylene (FEP) | ||
| Polytetrafluoroethylene (PTFE) | ||
| Polyvinylfluoride (PVF) | ||
| Polyvinylidene Fluoride (PVDF) | ||
| Other Sub Resin Types | ||
| Liquid Crystal Polymer (LCP) | ||
| Polyamide (PA) | Aramid | |
| Polyamide (PA) 6 | ||
| Polyamide (PA) 66 | ||
| Polyphthalamide | ||
| Polybutylene Terephthalate (PBT) | ||
| Polycarbonate (PC) | ||
| Polyether Ether Ketone (PEEK) | ||
| Polyethylene Terephthalate (PET) | ||
| Polyimide (PI) | ||
| Polymethyl Methacrylate (PMMA) | ||
| Polyoxymethylene (POM) | ||
| Styrene Copolymers (ABS, SAN) | ||
| By End-User Industry | Aerospace | |
| Automotive | ||
| Building and Construction | ||
| Electrical and Electronics | ||
| Industrial and Machinery | ||
| Packaging | ||
| Other End-user Industries | ||
| By Geography | Saudi Arabia | |
| United Arab Emirates | ||
| Rest of Middle East | ||


Market Definition
- End-user Industry - Packaging, Electrical & Electronics, Automotive, Building & Construction, and Others are the end-user industries considered under the engineering plastics market.
- Resin - Under the scope of the study, consumption of virgin resins like Fluoropolymer, Polycarbonate, Polyethylene Terephthalate, Polybutylene Terephthalate, Polyoxymethylene, Polymethyl Methacrylate, Styrene Copolymers, Liquid Crystal Polymer, Polyether Ether Ketone, Polyimide, and Polyamide in the primary forms are considered. Recycling has been provided separately under its individual chapter.
| Keyword | Definition |
|---|---|
| Acetal | This is a rigid material that has a slippery surface. It can easily withstand wear and tear in abusive work environments. This polymer is used for building applications such as gears, bearings, valve components, etc. |
| Acrylic | This synthetic resin is a derivative of acrylic acid. It forms a smooth surface and is mainly used for various indoor applications. The material can also be used for outdoor applications with a special formulation. |
| Cast film | A cast film is made by depositing a layer of plastic onto a surface then solidifying and removing the film from that surface. The plastic layer can be in molten form, in a solution, or in dispersion. |
| Colorants & Pigments | Colorants & Pigments are additives used to change the color of the plastic. They can be a powder or a resin/color premix. |
| Composite material | A composite material is a material that is produced from two or more constituent materials. These constituent materials have dissimilar chemical or physical properties and are merged to create a material with properties unlike the individual elements. |
| Degree of Polymerization (DP) | The number of monomeric units in a macromolecule, polymer, or oligomer molecule is referred to as the degree of polymerization or DP. Plastics with useful physical properties often have DPs in the thousands. |
| Dispersion | To create a suspension or solution of material in another substance, fine, agglomerated solid particles of one substance are dispersed in a liquid or another substance to form a dispersion. |
| Fiberglass | Fiberglass-reinforced plastic is a material made up of glass fibers embedded in a resin matrix. These materials have high tensile and impact strength. Handrails and platforms are two examples of lightweight structural applications that use standard fiberglass. |
| Fiber-reinforced polymer (FRP) | Fiber-reinforced polymer is a composite material made of a polymer matrix reinforced with fibers. The fibers are usually glass, carbon, aramid, or basalt. |
| Flake | This is a dry, peeled-off piece, usually with an uneven surface, and is the base of cellulosic plastics. |
| Fluoropolymers | This is a fluorocarbon-based polymer with multiple carbon-fluorine bonds. It is characterized by high resistance to solvents, acids, and bases. These materials are tough yet easy to machine. Some of the popular fluoropolymers are PTFE, ETFE, PVDF, PVF, etc. |
| Kevlar | Kevlar is the commonly referred name for aramid fiber, which was initially a Dupont brand for aramid fiber. Any group of lightweight, heat-resistant, solid, synthetic, aromatic polyamide materials that are fashioned into fibers, filaments, or sheets is called aramid fiber. They are classified into Para-aramid and Meta-aramid. |
| Laminate | A structure or surface composed of sequential layers of material bonded under pressure and heat to build up to the desired shape and width. |
| Nylon | They are synthetic fiber-forming polyamides formed into yarns and monofilaments. These fibers possess excellent tensile strength, durability, and elasticity. They have high melting points and can resist chemicals and various liquids. |
| PET preform | A preform is an intermediate product that is subsequently blown into a polyethylene terephthalate (PET) bottle or a container. |
| Plastic compounding | Compounding consists of preparing plastic formulations by mixing and/or blending polymers and additives in a molten state to achieve the desired characteristics. These blends are automatically dosed with fixed setpoints usually through feeders/hoppers. |
| Plastic pellets | Plastic pellets, also known as pre-production pellets or nurdles, are the building blocks for nearly every product made of plastic. |
| Polymerization | It is a chemical reaction of several monomer molecules to form polymer chains that form stable covalent bonds. |
| Styrene Copolymers | A copolymer is a polymer derived from more than one species of monomer, and a styrene copolymer is a chain of polymers consisting of styrene and acrylate. |
| Thermoplastics | Thermoplastics are defined as polymers that become soft material when it is heated and becomes hard when it is cooled. Thermoplastics have wide-ranging properties and can be remolded and recycled without affecting their physical properties. |
| Virgin Plastic | It is a basic form of plastic that has never been used, processed, or developed. It may be considered more valuable than recycled or already used materials. |


Research Methodology
Mordor Intelligence follows a four-step methodology in all our reports.
- Step-1: Identify Key Variables: The quantifiable key variables (industry and extraneous) pertaining to the specific product segment and country are selected from a group of relevant variables & factors based on desk research & literature review; along with primary expert inputs. These variables are further confirmed through regression modeling (wherever required).
- Step-2: Build a Market Model: In order to build a robust forecasting methodology, the variables and factors identified in Step-1 are tested against available historical market numbers. Through an iterative process, the variables required for market forecast are set and the model is built on the basis of these variables.
- Step-3: Validate and Finalize: In this important step, all market numbers, variables and analyst calls are validated through an extensive network of primary research experts from the market studied. The respondents are selected across levels and functions to generate a holistic picture of the market studied.
- Step-4: Research Outputs: Syndicated Reports, Custom Consulting Assignments, Databases & Subscription Platforms


