Australia Engineering Plastics Market Size and Share
Market Overview
| Study Period | 2020 - 2031 |
|---|---|
| Forecast Data Period | 2026 - 2031 |
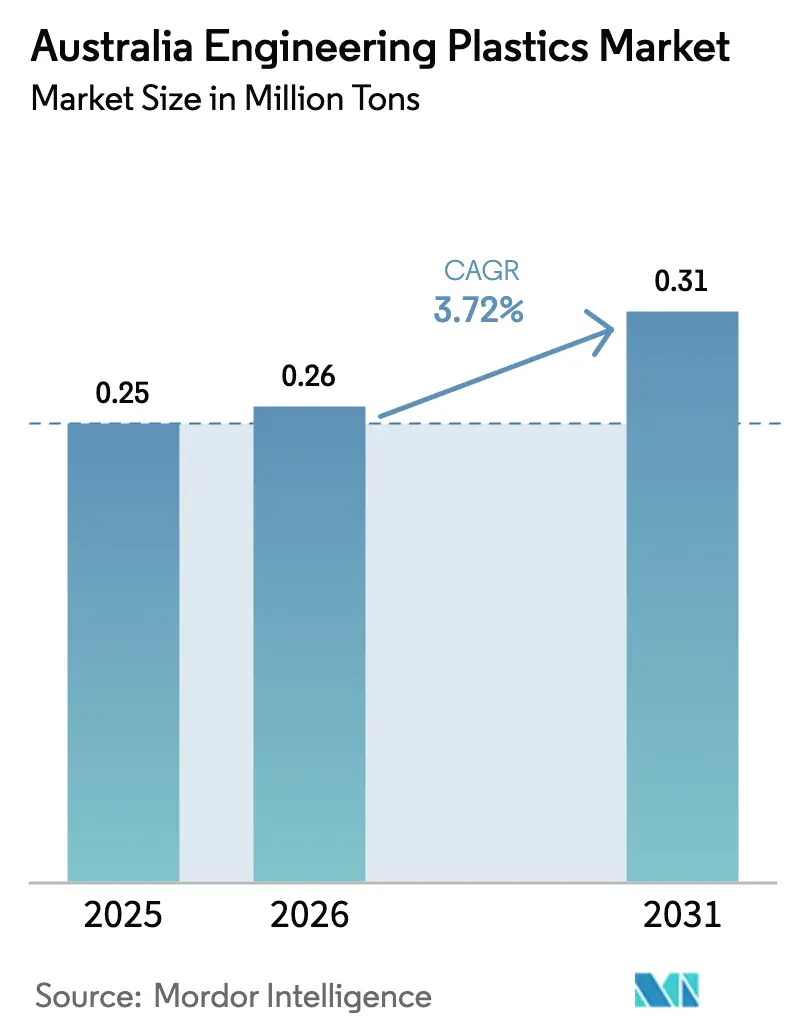
| Base Year Market Size (2025) | 0.25 Million tons |
| Market Volume (2026) | 0.26 Million tons |
| Market Volume (2031) | 0.31 Million tons |
| Growth Rate (2026 - 2031) | 3.72% CAGR |
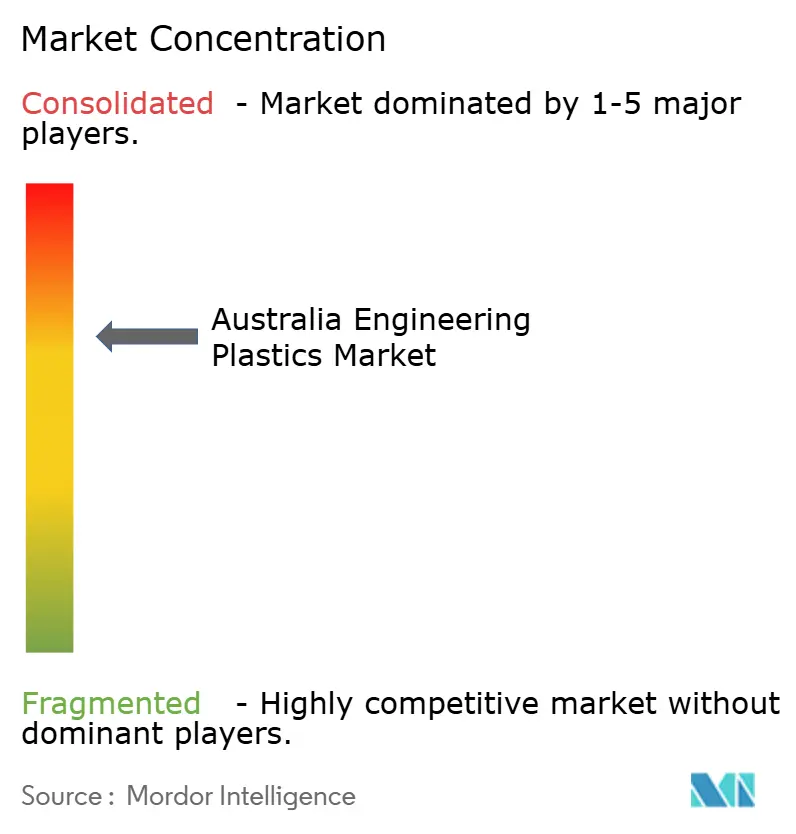
| Market Concentration | Medium |
Major Players *Disclaimer: Major Players sorted in no particular order Image © Mordor Intelligence. Reuse requires attribution under CC BY 4.0. | |
Australia Engineering Plastics Market Analysis by Mordor Intelligence
The Australia Engineering Plastics Market size was valued at 0.25 million tons in 2025 and estimated to grow from 0.26 million tons in 2026 to reach 0.31 million tons by 2031, at a CAGR of 3.72% during the forecast period (2026-2031). Heightened defense procurement under the AUD 330 billion AUKUS submarine program, recycled-content mandates in packaging, and the electrification of transport together underpin steady volume gains even as intensifying import competition constrains pricing power. Automotive lightweighting programs accelerate demand for high-heat polymers, while electronics miniaturization spurs interest in tight-tolerance molding grades. Mandatory 30–65% recycled PET requirements force converters to redesign formulations around a domestic recycling network that still operates at only 58% utilization, creating supply imbalances that favor integrated players. At the same time, feedstock price swings linked to currency volatility compress converter margins, and Qenos’s 2024 closure heightens exposure to offshore suppliers. Strategic partnerships between material producers and recyclers—typified by Samsara Eco’s enzyme-based plant—signal a pivot toward circular business models that could reshape competitive dynamics over the next decade.
Key Report Takeaways
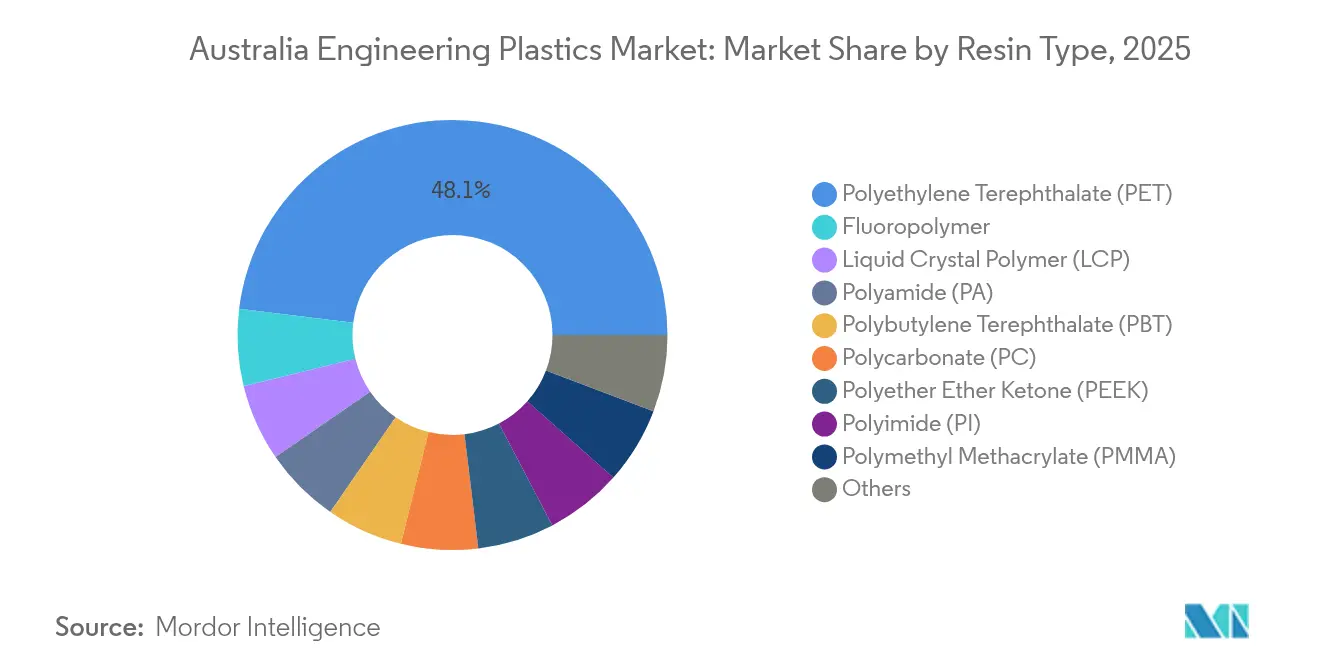
- By resin type, polyethylene terephthalate held 48.05% of the Australia engineering plastics market share in 2025, while styrene copolymers are projected to expand at a 6.17% CAGR through 2031.
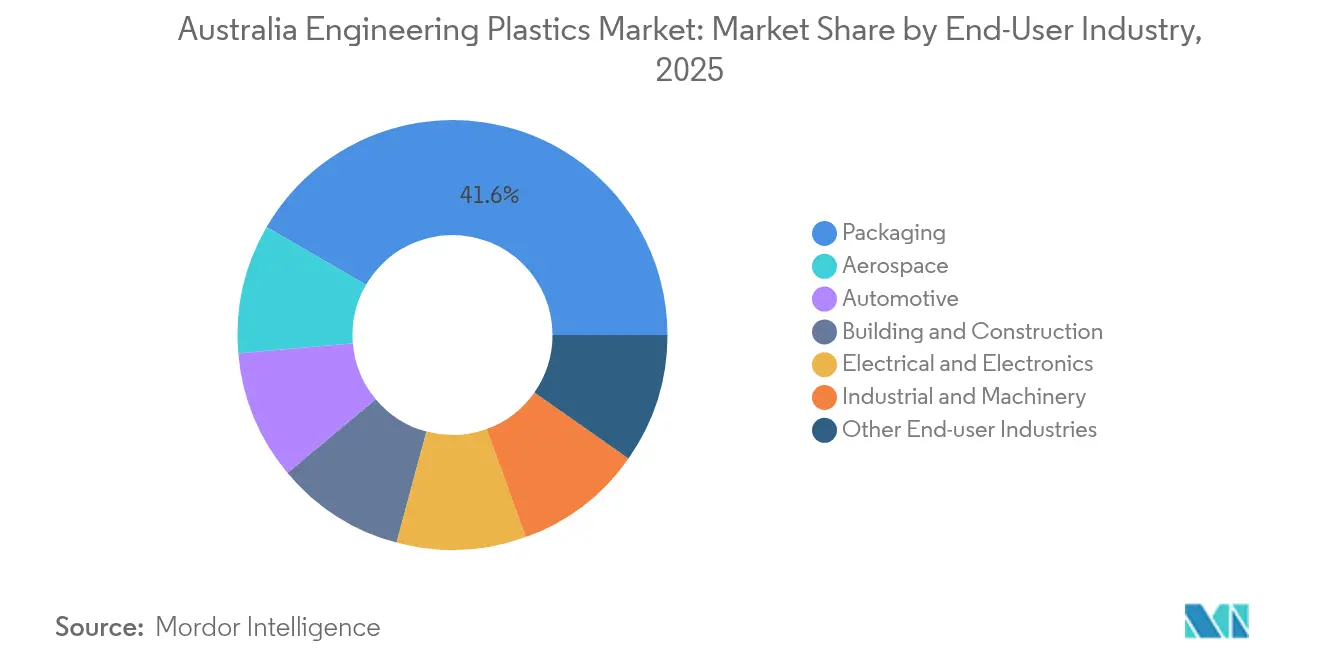
- By end-user industry, packaging led with 41.62% of the Australia engineering plastics market size in 2025; aerospace is advancing at a 6.63% CAGR through 2031.
Note: Market size and forecast figures in this report are generated using Mordor Intelligence’s proprietary estimation framework, updated with the latest available data and insights as of 2026.
Australia Engineering Plastics Market Trends and Insights
Drivers Impact Analysis*
| Driver | (~) % Impact on CAGR Forecast | Geographic Relevance | Impact Timeline |
|---|---|---|---|
| Automotive lightweighting & rapid EV uptake | +0.80% | Victoria, South Australia | Medium term (2-4 years) |
| Expansion of E&E manufacturing base | +0.60% | Victoria, NSW, Queensland | Medium term (2-4 years) |
| Government infrastructure & construction pipeline | +0.50% | National; focus on Western Sydney & Bruce Highway | Short term (≤ 2 years) |
| Growth in high-performance food & pharma packaging | +0.40% | National | Long term (≥ 4 years) |
| Emergence of defense & space-grade composites | +0.70% | South Australia, Western Australia | Long term (≥ 4 years) |
| Source: Mordor Intelligence | |||


Automotive Lightweighting & Rapid EV Uptake
Australia engineering plastics market demand accelerates as automakers prepare for a fleet in which 97% of light vehicles could be electric by 2050. Model redesigns substitute metals with engineering plastics, each kilogram saved potentially extending driving range by 2–3 km. Thermal-management housings, battery enclosures, and precision connectors increasingly specify high-temperature polyamides and polycarbonates that can contain flammable electrolytes and withstand 150 °C operating windows. Government incentives for local vehicle assembly drive interest in nearby resin supply, positioning domestic compounders to capture import-substitution gains. Vehicle-to-grid demonstrations amplify requirements for flame-retardant grades with superior dielectric strength.
Expansion of E&E Manufacturing Base
Rising output from electronics clusters in Victoria, NSW, and Queensland elevates specialty-compound demand. Miniaturization pushes tolerances below 30 µm, favoring low-warpage polyphenylene sulfide and liquid-crystal polymers that sustain dielectric strength across –40 °C to 150 °C operating ranges. The rollout of 5G small-cell networks needs UL94 V-0 compliant housings that do not attenuate radio signals, while smart-meter deployments require UV-stable polycarbonate blends for 20-year outdoor lifetimes. Local brands increasingly mandate take-back schemes, rewarding suppliers able to close the material loop through post-industrial scrap reclamation.
Government Infrastructure & Construction Pipeline
The AUD 17.1 billion 2025-26 federal works program allocates funds to the Bruce Highway and Western Sydney transport corridors, specifying cable conduits, bridge bearings, and transparent noise barriers fabricated from engineering plastics[1]Australian Government Department of Infrastructure, “Infrastructure Investment Program,” infrastructure.gov.au . Snowy 2.0’s pumped-hydro tunnels rely on corrosion-proof polyamide liners that defend against abrasive silt. Prefabricated façades incorporating polycarbonate glazing panels slash on-site labor and trucking costs by 25%, strengthening adoption in multistory builds. New procurement guidelines now stipulate minimum recycled-content thresholds, directing orders toward suppliers that can certify traceability.
Growth in High-Performance Food & Pharma Packaging
Mandatory 30–65% recycled-content thresholds for PET, HDPE, and PP packaging take effect in 2025, reshaping converter sourcing and process economics[2]Australian Packaging Covenant Organisation, “Recycled Content Targets,” packagingcovenant.org.au . Food Standards Australia New Zealand migration limits restrict the use of recycled feedstock that lacks purity certification, favoring technologies such as enzymatic depolymerization to deliver virgin-grade polymer chains. Pharmaceutical blister packs migrate to cyclic olefin copolymer laminates, combining moisture barriers and gamma-sterilization resistance. As the population ages, prescription volumes climb, driving sustainable pharmaceutical-packaging demand that protects active ingredients through lengthy supply chains to remote regions.
Restraints Impact Analysis*
| Restraint | (~) % Impact on CAGR Forecast | Geographic Relevance | Impact Timeline |
|---|---|---|---|
| Feedstock price volatility & FX swings | –0.9% | Import-dependent supply chains | Short term (≤ 2 years) |
| Influx of low-priced Asian imports | –0.7% | National; commodity grades | Medium term (2-4 years) |
| Recycling-capacity shortfall | –0.3% | National | Long term (≥ 4 years) |
| Source: Mordor Intelligence | |||
Feedstock Price Volatility & FX Swings
Ethylene and propylene costs move with global oil and naphtha fundamentals, and every 10% depreciation of the AUD against the USD can lift resin costs by up to 8% for local converters. Spot purchasing fills the gap left by Qenos’s exit, exposing buyers to Asian benchmark price spikes. Smaller processors struggle to hedge exposure, squeezing working capital and delaying capital-equipment upgrades that could enhance competitiveness.
Influx of Low-Priced Asian Imports
Chinese, Malaysian, and Vietnamese plants commissioned after the 2023 flood the Australian market with commodity-grade PBT and ABS priced 15–20% below domestic offers. Players with no scale advantage pivot to niche compounding or technical-service bundles. However, foreign producers now build Sydney and Melbourne distribution depots, slowly eroding delivery-time advantages held by local distributors.
*Our forecasts treat driver/restraint impacts as directional, not additive. The impact forecasts reflect baseline growth, mix effects, and variable interactions.
Segment Analysis
By Resin Type: PET Dominance Faces Recycling Disruption
Polyethylene terephthalate accounted for 48.05% of the Australia engineering plastics market share in 2025. Producers with integrated depolymerization facilities attract bottlers seeking closed-loop certification, while converters without access to food-grade rPET risk margin erosion in a price-sensitive environment. Styrene copolymers—ABS and SAN—exhibit the fastest expansion at 6.17% CAGR, propelled by EV interior trim, infotainment bezels, and medical-device housings. Meanwhile, polycarbonate holds share in automotive glazing despite Asian price competition, and polyamide gains in aircraft ducting where 30% glass-fiber PA 12 replaces aluminum to cut weight by 40%.
Innovations such as liquid-crystal polymers for 5G antenna frames and polyether ether ketone (PEEK) in down-hole mining tools demonstrate the widening scope of high-end resins. Fluoropolymer usage remains niche but profitable, with demand in semiconductor etch-gas delivery lines where less than 1 ppb extractables are permitted. Polyoxymethylene retains relevance for precision gears in resource-sector equipment, its low coefficient of friction outperforming metal alternatives in dusty environments.


By End-User Industry: Packaging Leadership Challenged by Aerospace Momentum
Packaging retained 41.62% share of the Australia engineering plastics market size in 2025, yet forward momentum tilts toward aerospace, which is forecast to expand at 6.63% CAGR to 2031. Defense contractors sourcing for the AUKUS submarine initiative demand polyetherimide and high-temperature polyamide for components exposed to 200 °C seawater environments. Composite pressure-vessel liners for rocket propulsion feed a burgeoning domestic space sector supported by Gilmour Space’s small-launch platform. Automotive uptake also strengthens; battery-pack housings molded in flame-retardant PP-GF30 cut mass by 20 kg per vehicle, aiding range targets under forthcoming fleet-average CO₂ regulations. In building and construction, transparent polycarbonate noise barriers specified for the WestConnex project deliver 12 dB attenuation while trimming structural steel by 15%.
Electrical and electronics manufacturers adopt halogen-free flame-retardant PBT for smart-meter enclosures and connectors, benefiting from supply-chain proximity to consumer markets in eastern states. Industrial machinery retains dependable, if slower, growth driven by replacement demand in the mining belt for abrasion-resistant components that withstand red-dust infiltration and corrosive slurries.
Geography Analysis
Victoria anchors demand with its legacy automotive hub and the Port of Melbourne facilitating resin imports. State payroll-tax rebates entice molders to co-locate with EV-assembly lines, shortening lead times for interior trim parts. New South Wales follows, buoyed by Sydney’s packaging cluster and fast-growing medical-device firms in the Macquarie Park corridor. Queensland’s resource exports sustain industrial-equipment consumption, while water-infrastructure upgrades in regional areas rely on large-diameter HDPE pressure pipe. Western Australia remains a specialized market characterized by long lead times; Perth’s remoteness paradoxically shields local distributors from some Asian price competition, allowing pass-through of freight surcharges.
Recycling capacity is uneven: Victoria operates Australia’s largest PET bottle-to-bottle plant, whereas Northern Territory relies on interstate shipment of post-consumer flakes, raising transport emissions and compliance costs. State environmental levies differ, with South Australia’s container-deposit scheme achieving 76% recovery, outperforming NSW’s 67% rate. Such disparities influence converter location decisions as mandates tighten. Trade lanes matter: 40-ft containers from Shanghai to Melbourne average a 14-day transit, compared with 24 days to Fremantle via Singapore, affecting just-in-time inventory strategies. Currency-hedging sophistication also varies by region; Queensland SMEs often buy resin spot in AUD, while multi-state groups negotiate USD-linked contracts with built-in swap clauses to mitigate FX risk.
Competitive Landscape
The Australia engineering plastics market remains moderately fragmented. Global majors such as BASF and SABIC leverage Asian mega-plants to supply Australian customers, integrating digital ordering portals that compress quoting cycles from one week to 24 hours. Local distributors Ixom and Dotmar Engineering Plastics differentiate through application-development labs in Melbourne and Brisbane that co-design parts with OEMs.
Circular-economy capabilities are emerging as key competitive levers. Samsara Eco’s enzyme-based depolymerization partnership with Lululemon enables brand owners to close material loops and secure rPET at predictable quality, challenging petrochemical incumbents that lack recycling assets. Meanwhile, Viva Energy’s polypropylene line in Geelong remains the country’s last domestic bulk resin source, offering supply security that commanded a 7% price premium in 2025.
Strategic partnerships proliferate. Northrop Grumman’s Global Supply Chain Program channels USD 67 million into capacity upgrades at SME molders, cementing long-term resin off-take agreements. Moog Australia’s expansion includes autoclave composite cures, boosting demand for high-temperature polyimide prepregs. Players unable to offer aerospace-grade traceability face displacement despite historical customer ties.
Australia Engineering Plastics Industry Leaders
Arkema
BASF
Covestro AG
Mitsubishi Chemical Corporation
SABIC
- *Disclaimer: Major Players sorted in no particular order

Recent Industry Developments
- September 2025: Samsara Eco has opened a 20,000-tonne recycling facility in Jerrabomberra, New South Wales, utilizing enzymatic processes to break down mixed polymers. Equipped with its innovative EosEco technology, the facility uses AI-designed enzymes to depolymerize plastics like nylon 6,6 and PET into reusable raw monomers for manufacturing.
- May 2025: Viva Energy processed over 9.5 tonnes of plastic pyrolysis oil (PPO) at its Geelong refinery, showcasing the facility's potential for large-scale waste plastic operations in Australia. The Geelong refinery, one of only two operational oil refineries in the country, processes up to 120,000 barrels of oil daily and produces products such as polypropylene.


Australia Engineering Plastics Market Report Scope
Aerospace, Automotive, Building and Construction, Electrical and Electronics, Industrial and Machinery, Packaging are covered as segments by End User Industry. Fluoropolymer, Liquid Crystal Polymer (LCP), Polyamide (PA), Polybutylene Terephthalate (PBT), Polycarbonate (PC), Polyether Ether Ketone (PEEK), Polyethylene Terephthalate (PET), Polyimide (PI), Polymethyl Methacrylate (PMMA), Polyoxymethylene (POM), Styrene Copolymers (ABS and SAN) are covered as segments by Resin Type.| Fluoropolymer | Ethylenetetrafluoroethylene (ETFE) |
| Fluorinated Ethylene-propylene (FEP) | |
| Polytetrafluoroethylene (PTFE) | |
| Polyvinylfluoride (PVF) | |
| Polyvinylidene Fluoride (PVDF) | |
| Other Sub Resin Types | |
| Liquid Crystal Polymer (LCP) | |
| Polyamide (PA) | Aramid |
| Polyamide (PA) 6 | |
| Polyamide (PA) 66 | |
| Polyphthalamide | |
| Polybutylene Terephthalate (PBT) | |
| Polycarbonate (PC) | |
| Polyether Ether Ketone (PEEK) | |
| Polyethylene Terephthalate (PET) | |
| Polyimide (PI) | |
| Polymethyl Methacrylate (PMMA) | |
| Polyoxymethylene (POM) | |
| Styrene Copolymers (ABS, SAN) |
| Aerospace |
| Automotive |
| Building and Construction |
| Electrical and Electronics |
| Industrial and Machinery |
| Packaging |
| Other End-user Industries |
| By Resin Type | Fluoropolymer | Ethylenetetrafluoroethylene (ETFE) |
| Fluorinated Ethylene-propylene (FEP) | ||
| Polytetrafluoroethylene (PTFE) | ||
| Polyvinylfluoride (PVF) | ||
| Polyvinylidene Fluoride (PVDF) | ||
| Other Sub Resin Types | ||
| Liquid Crystal Polymer (LCP) | ||
| Polyamide (PA) | Aramid | |
| Polyamide (PA) 6 | ||
| Polyamide (PA) 66 | ||
| Polyphthalamide | ||
| Polybutylene Terephthalate (PBT) | ||
| Polycarbonate (PC) | ||
| Polyether Ether Ketone (PEEK) | ||
| Polyethylene Terephthalate (PET) | ||
| Polyimide (PI) | ||
| Polymethyl Methacrylate (PMMA) | ||
| Polyoxymethylene (POM) | ||
| Styrene Copolymers (ABS, SAN) | ||
| By End-User Industry | Aerospace | |
| Automotive | ||
| Building and Construction | ||
| Electrical and Electronics | ||
| Industrial and Machinery | ||
| Packaging | ||
| Other End-user Industries | ||


Market Definition
- End-user Industry - Packaging, Electrical & Electronics, Building & Construction, and Others are the end-user industries considered under the engineering plastics market.
- Resin - Under the scope of the study, consumption of virgin resins like Fluoropolymer, Polycarbonate, Polyethylene Terephthalate, Polybutylene Terephthalate, Polyoxymethylene, Polymethyl Methacrylate, Styrene Copolymers, Liquid Crystal Polymer, Polyether Ether Ketone, Polyimide, and Polyamide in the primary forms are considered. Recycling has been provided separately under its individual chapter.
| Keyword | Definition |
|---|---|
| Acetal | This is a rigid material that has a slippery surface. It can easily withstand wear and tear in abusive work environments. This polymer is used for building applications such as gears, bearings, valve components, etc. |
| Acrylic | This synthetic resin is a derivative of acrylic acid. It forms a smooth surface and is mainly used for various indoor applications. The material can also be used for outdoor applications with a special formulation. |
| Cast film | A cast film is made by depositing a layer of plastic onto a surface then solidifying and removing the film from that surface. The plastic layer can be in molten form, in a solution, or in dispersion. |
| Colorants & Pigments | Colorants & Pigments are additives used to change the color of the plastic. They can be a powder or a resin/color premix. |
| Composite material | A composite material is a material that is produced from two or more constituent materials. These constituent materials have dissimilar chemical or physical properties and are merged to create a material with properties unlike the individual elements. |
| Degree of Polymerization (DP) | The number of monomeric units in a macromolecule, polymer, or oligomer molecule is referred to as the degree of polymerization or DP. Plastics with useful physical properties often have DPs in the thousands. |
| Dispersion | To create a suspension or solution of material in another substance, fine, agglomerated solid particles of one substance are dispersed in a liquid or another substance to form a dispersion. |
| Fiberglass | Fiberglass-reinforced plastic is a material made up of glass fibers embedded in a resin matrix. These materials have high tensile and impact strength. Handrails and platforms are two examples of lightweight structural applications that use standard fiberglass. |
| Fiber-reinforced polymer (FRP) | Fiber-reinforced polymer is a composite material made of a polymer matrix reinforced with fibers. The fibers are usually glass, carbon, aramid, or basalt. |
| Flake | This is a dry, peeled-off piece, usually with an uneven surface, and is the base of cellulosic plastics. |
| Fluoropolymers | This is a fluorocarbon-based polymer with multiple carbon-fluorine bonds. It is characterized by high resistance to solvents, acids, and bases. These materials are tough yet easy to machine. Some of the popular fluoropolymers are PTFE, ETFE, PVDF, PVF, etc. |
| Kevlar | Kevlar is the commonly referred name for aramid fiber, which was initially a Dupont brand for aramid fiber. Any group of lightweight, heat-resistant, solid, synthetic, aromatic polyamide materials that are fashioned into fibers, filaments, or sheets is called aramid fiber. They are classified into Para-aramid and Meta-aramid. |
| Laminate | A structure or surface composed of sequential layers of material bonded under pressure and heat to build up to the desired shape and width. |
| Nylon | They are synthetic fiber-forming polyamides formed into yarns and monofilaments. These fibers possess excellent tensile strength, durability, and elasticity. They have high melting points and can resist chemicals and various liquids. |
| PET preform | A preform is an intermediate product that is subsequently blown into a polyethylene terephthalate (PET) bottle or a container. |
| Plastic compounding | Compounding consists of preparing plastic formulations by mixing and/or blending polymers and additives in a molten state to achieve the desired characteristics. These blends are automatically dosed with fixed setpoints usually through feeders/hoppers. |
| Plastic pellets | Plastic pellets, also known as pre-production pellets or nurdles, are the building blocks for nearly every product made of plastic. |
| Polymerization | It is a chemical reaction of several monomer molecules to form polymer chains that form stable covalent bonds. |
| Styrene Copolymers | A copolymer is a polymer derived from more than one species of monomer, and a styrene copolymer is a chain of polymers consisting of styrene and acrylate. |
| Thermoplastics | Thermoplastics are defined as polymers that become soft material when it is heated and becomes hard when it is cooled. Thermoplastics have wide-ranging properties and can be remolded and recycled without affecting their physical properties. |
| Virgin Plastic | It is a basic form of plastic that has never been used, processed, or developed. It may be considered more valuable than recycled or already used materials. |


Research Methodology
Mordor Intelligence follows a four-step methodology in all our reports.
- Step-1: Identify Key Variables: The quantifiable key variables (industry and extraneous) pertaining to the specific product segment and country are selected from a group of relevant variables & factors based on desk research & literature review; along with primary expert inputs. These variables are further confirmed through regression modeling (wherever required).
- Step-2: Build a Market Model: In order to build a robust forecasting methodology, the variables and factors identified in Step-1 are tested against available historical market numbers. Through an iterative process, the variables required for market forecast are set and the model is built on the basis of these variables.
- Step-3: Validate and Finalize: In this important step, all market numbers, variables and analyst calls are validated through an extensive network of primary research experts from the market studied. The respondents are selected across levels and functions to generate a holistic picture of the market studied.
- Step-4: Research Outputs: Syndicated Reports, Custom Consulting Assignments, Databases & Subscription Platforms


