Chile Data Center Water Consumption Market Size and Share
Market Overview
| Study Period | 2021 - 2030 |
|---|---|
| Base Year For Estimation | 2024 |
| Forecast Data Period | 2025 - 2030 |
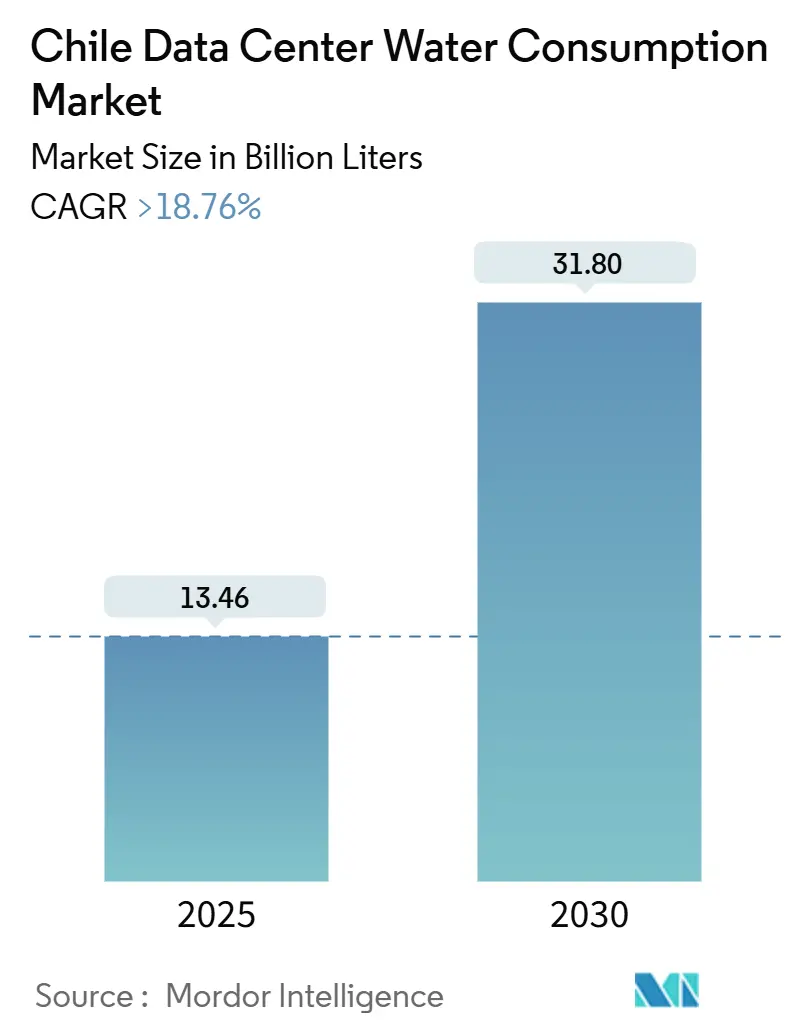
| Market Volume (2025) | 13.46 Billion liters |
| Market Volume (2030) | 31.80 Billion liters |
| Growth Rate (2025 - 2030) | 18.76% CAGR |
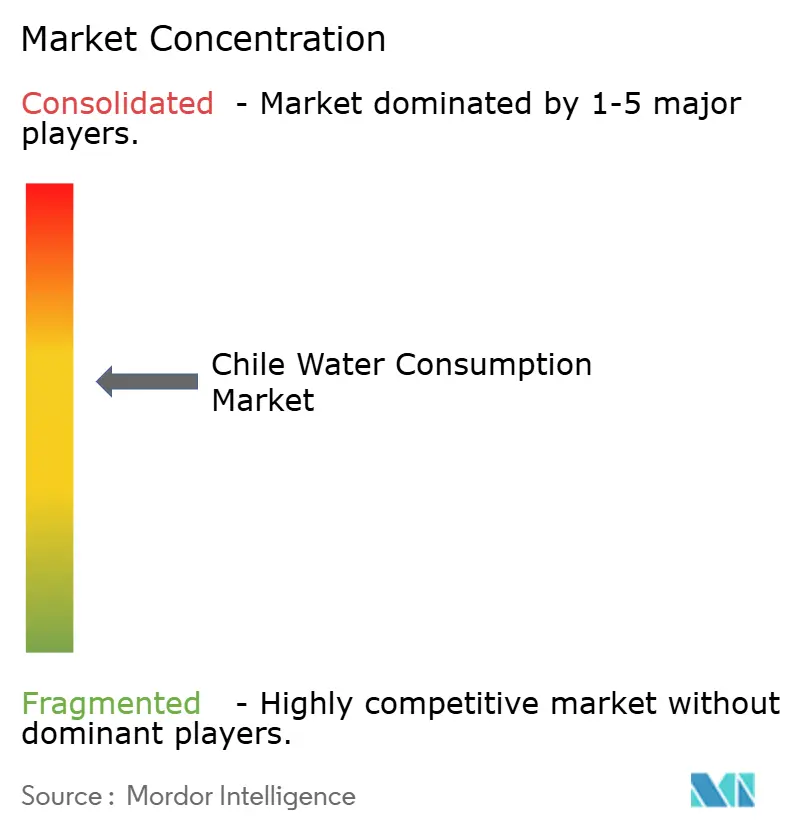
| Market Concentration | Medium |
Major Players
*Disclaimer: Major Players sorted in no particular order Image © Mordor Intelligence. Reuse requires attribution under CC BY 4.0. |
|
Chile Data Center Water Consumption Market Analysis by Mordor Intelligence
The Chile Data Center Water Consumption Market size is estimated at 13.46 billion liters in 2025, and is expected to reach 31.80 billion liters by 2030, at a CAGR of greater than 18.76% during the forecast period (2025-2030). This rapid scale-up positions the country as one of Latin America’s fastest-growing hubs for the expansion of water-intensive digital infrastructure. Sustained hyperscale investments, a pro-digitization policy agenda, and resilient submarine-cable connectivity collectively underpin demand. Meanwhile, the rising adoption of AI and machine learning (ML) pushes densities higher, accelerating the shift toward liquid-based thermal solutions that consume markedly less water per unit of compute. Operators are simultaneously responding to a decade-long megadrought and a 2022 overhaul of Chile’s Water Code, which prioritizes human consumption and caps new extraction rights. As a result, alternative sources such as desalinated seawater and recycled greywater are proliferating. Competitive dynamics further intensify as Amazon, Google, Oracle, Equinix, and local telecom providers reinterpret sustainability as the new litmus test for site viability.
Key Report Takeaways
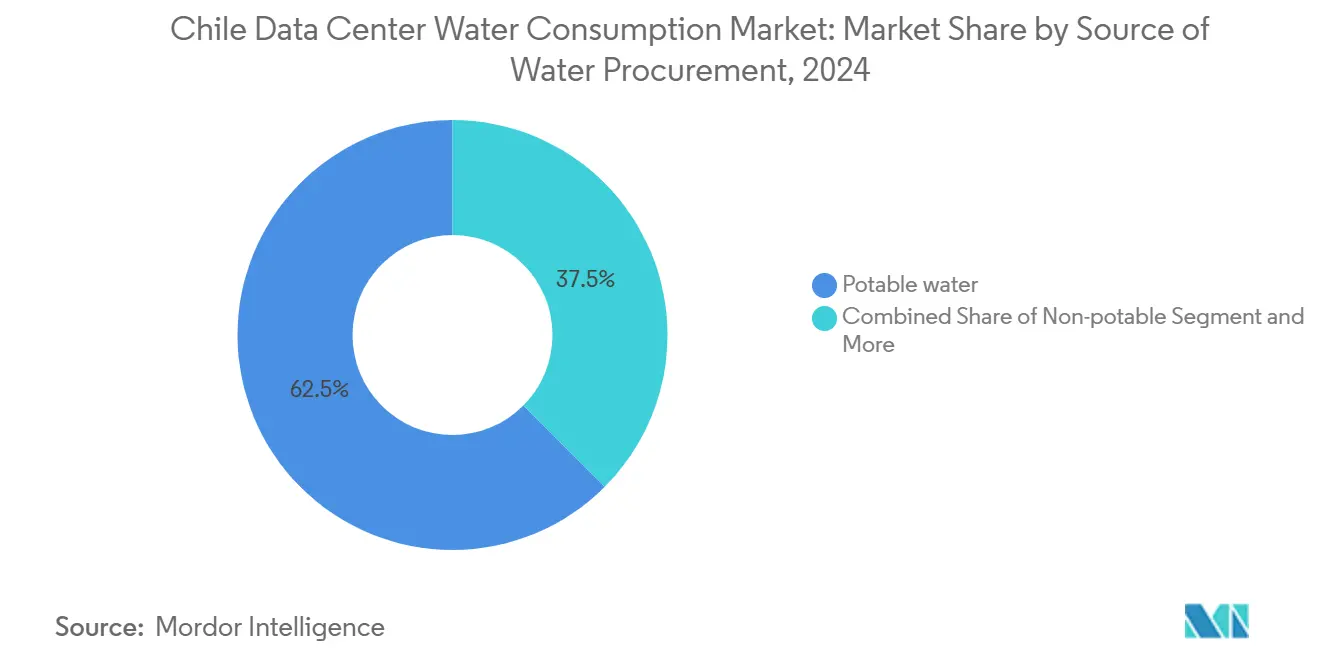
- By source of water procurement, potable water held 62.53% of the Chile data center water consumption market share in 2024, while alternative sources are projected to grow at a 21.43% CAGR through 2030.
- By data center type, the colocation segment accounted for 46.92% of the Chile data center water consumption market size in 2024; the cloud service provider segment is expected to expand at a 19.85% CAGR between 2025 and 2030.
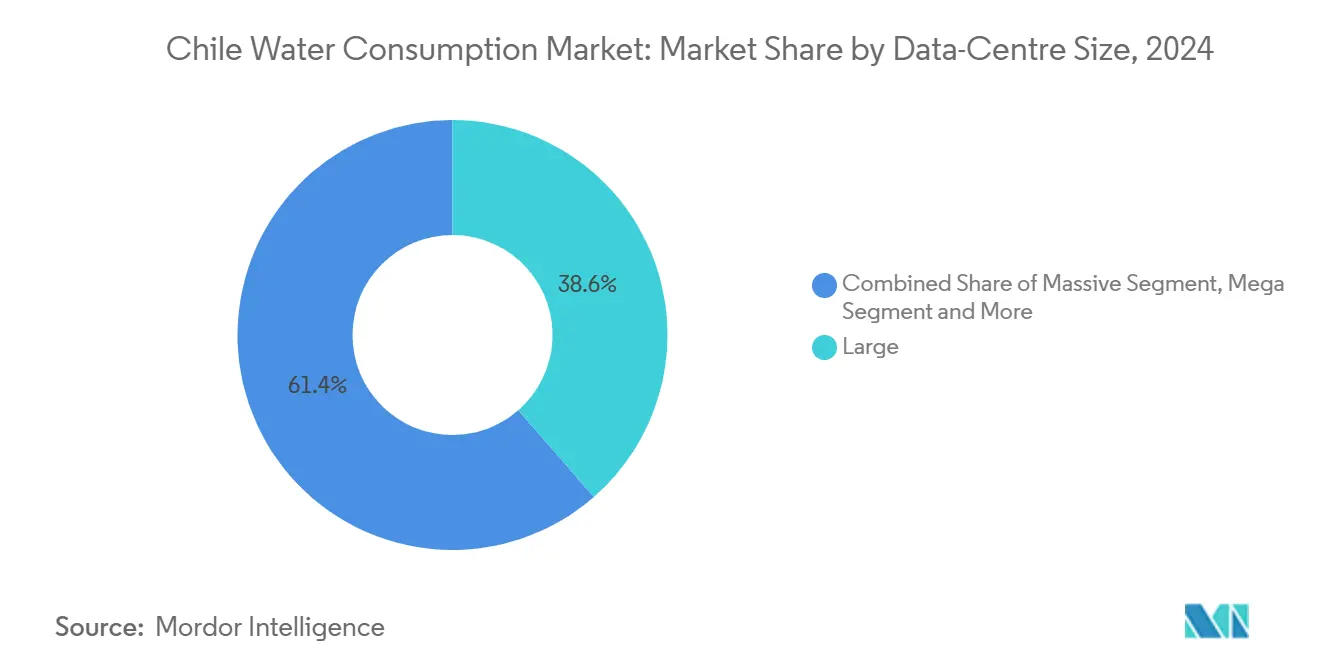
- By data center size, large facilities captured 38.42% of the Chile data center water consumption market size in 2024; however, mega facilities are expected to lead with a 19.56% CAGR to 2030.
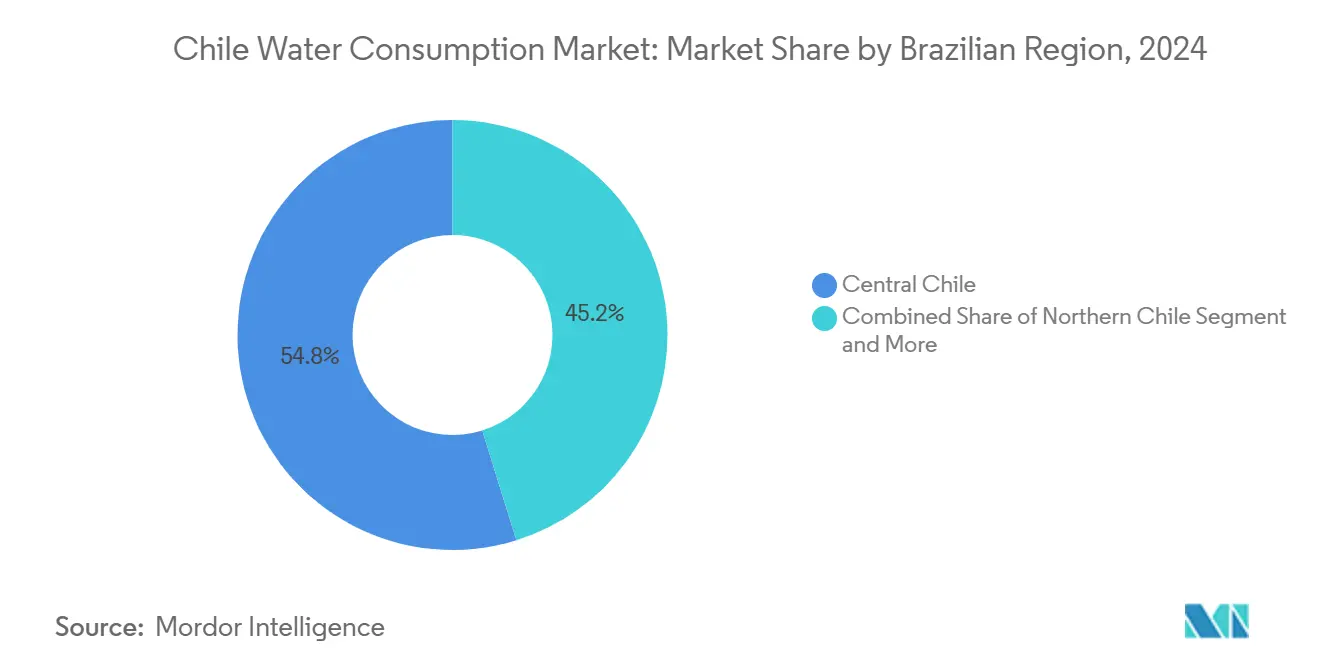
- By geography, Central Chile commanded 54.81% revenue share in 2024, whereas Northern Chile is forecast to post a 20.90% CAGR through 2030.
Chile Data Center Water Consumption Market Trends and Insights
Drivers Impact Analysis
| Driver | (~) % Impact on CAGR Forecast | Geographic Relevance | Impact Timeline |
|---|---|---|---|
| Surge in hyperscale and colocation builds around Santiago | 4.2% | Central Chile, with spillover to Valparaíso, Concepción | Medium term (2-4 years) |
| Growing AI/ML workloads boosting high-density cooling demand | 5.8% | Global, with concentration in Santiago, Quilicura | Short term (≤ 2 years) |
| Government digital-first push expanding cloud uptake | 3.1% | National, with early gains in Santiago, Valparaíso, Concepción | Long term (≥ 4 years) |
| Renewable-energy mandates favoring water-efficient systems | 2.4% | National, particularly Northern Chile coastal areas | Medium term (2-4 years) |
| Desalination capacity unlocks new coastal water supplies | 1.9% | Northern Chile, Antofagasta, Atacama regions | Long term (≥ 4 years) |
| Industrial symbiosis (aquaculture heat-reuse) lowers net usage | 1.2% | Central and Southern Chile coastal zones | Long term (≥ 4 years) |
| Surge in hyperscale and colocation builds around Santiago | 4.2% | Central Chile, with spillover to Valparaíso, Concepción | Medium term (2-4 years) |
| Source: Mordor Intelligence | |||
Surge in Hyperscale and Colocation Builds Around Santiago
Chile’s capital has evolved into Latin America’s pre-eminent data-center cluster owing to abundant renewables, a skilled workforce, and favorable permitting frameworks. Amazon’s USD 4 billion regional investment and Equinix’s USD 705 million purchase of Entel’s assets underscore investor confidence. Shared campus designs in Quilicura enable on-site treatment plants that recycle greywater, cutting per-rack consumption by up to 36%. Yet the concentration also amplifies drought-driven exposure because most facilities draw from the Maipo River basin, where streamflows have fallen sharply since 2010.[1]OECD, “Environmental Performance Review: Chile 2024,” oecd.org
Growing AI/ML Workloads Boosting High-Density Cooling Demand
GPUs now outnumber traditional CPUs in hyperscale clusters, creating heat loads exceeding 80 kW per rack. Direct-to-chip liquid systems dissipate heat 23.5 times more efficiently than legacy air solutions.[2]Ecolab, “Liquid cooling efficiency study,” ecolab.com Nvidia’s GB200 architecture claims a 300-fold water-efficiency gain versus evaporative towers. Microsoft has pledged “zero-water” Chilean facilities by 2026, illustrating how AI expansion is inseparable from water stewardship. These shifts heighten demand for the Chile data center water consumption market as operators turn to closed-loop liquids that limit drawdown but still require make-up volumes.
Government Digital-First Push Expanding Cloud Uptake
The National Data Centers Plan earmarks USD 2.5 billion for site roll-outs and embeds environmental safeguards, reinforcing steady capacity additions. A 64% rise in the 2025 digitalization budget accelerates migration of public services to the cloud, triggering downstream data-center builds. Oracle’s dual-region launch makes it Chile’s first hyperscaler with geographic redundancy, signaling healthy, policy-backed demand.[3]Investment Policy Monitor, “Chile launches National Data Centers Plan,” investmentpolicyhub.unctad.org
Renewable-Energy Mandates Favoring Water-Efficient Systems
Chile aims for carbon neutrality by 2050 and already sources more than 25 GW from wind and solar. Operators can thus substitute energy for water by adopting mechanically driven chillers or heat-pump-enabled loop systems. AWS reached 100% renewable matching in Chile starting 2023, justifying higher electricity draw to slash onsite water use. Complementary laws on resilience incentivize waste-heat recovery partnerships with aquaculture farms along the Biobío coast that can translate to a 9% net-consumption drop per facility.
Restraints Impact Analysis
| Restraint | (~) % Impact on CAGR Forecast | Geographic Relevance | Impact Timeline |
|---|---|---|---|
| Rising water tariffs and permit complexities | -2.8% | National, with acute impact in Central Chile | Short term (≤ 2 years) |
| Intensifying multi-year drought risk | -4.1% | Central and Northern Chile | Medium term (2-4 years) |
| Indigenous opposition to new extraction in Atacama | -1.6% | Northern Chile, Atacama region | Medium term (2-4 years) |
| Water-rights reform bill proposing volumetric caps | -2.2% | National, with regional variations | Long term (≥ 4 years) |
| Source: Mordor Intelligence | |||
Rising Water Tariffs and Permit Complexities
Utilities are raising industrial tariffs to finance drought-mitigation investments, adding operating-cost pressure. The 2024 Global Water Tariff Survey notes double-digit hikes in Santiago, with 60% of proceeds earmarked for drinking-water resilience. Simultaneously, reforms to the Environmental Impact Assessment System elevate climate-risk analysis requirements, extending lead times for greenfield permits. Such factors temper the Chile data center water consumption market outlook by elevating entry barriers.
Intensifying Multi-Year Drought Risk
Chile’s megadrought has cut central-zone precipitation 20-40% and driven groundwater withdrawals beyond recharge rates. Hydropower output, critical for renewable energy credits, is projected to fall 14% by 2030 under moderate scenarios. This water-energy nexus risk forces operators to secure desalinated or recycled supplies, inflating capex and moderating near-term growth for the Chile data center water consumption market.
Segment Analysis
By Source of Water Procurement: Alternative Sources Drive Innovation
Potable supply accounted for 62.53% of the Chile data center water consumption market size in 2024, yet alternative sources are forecast to expand at 21.43% CAGR to 2030. Growth stems from escalating drought severity, tariff inflation, and legal prioritization of human consumption. Desalination output is set to triple to 25,000 L/s by 2028, anchored by large-scale reverse-osmosis plants in Antofagasta and Atacama. Operators can tap these flows via dedicated spur lines, reducing reliance on constrained municipal grids. Additionally, Law 21,075 permits greywater reuse, enabling retrofits that divert spent cooling water for irrigation, slashing net draw by up to 48%.
Mega facilities adopt closed-loop systems that recirculate water multiple times before blow-down, improving consumption intensity. AWS reports that its forthcoming Santiago region will use water for cooling only 4% of its annual operating hours. Early adopters further explore on-site atmospheric-water generators, though costs limit current scalability. Collectively, these innovations reinforce the Chile data center water consumption market trajectory by aligning growth with environmental stewardship.
Note: Segment shares of all individual segments available upon report purchase
By Data Center Type: Cloud Providers Accelerate Growth
Colocation retained a 46.92% stake in the Chile data center water consumption market in 2024, benefiting from carrier neutrality and shared infrastructure efficiencies. However, cloud-service providers will outpace at a 19.85% CAGR as hyperscalers internalize workloads. Amazon, Oracle, and Microsoft each leverage modular designs pre-wired for direct liquid cooling, minimizing future retrofits. Equinix’s acquisition of Entel’s campus widens its lead in retail colo, yet the deal also funds immediate upgrades to recycled-water systems.
Cloud operators typically integrate water-usage-effectiveness (WUE) targets into contracts, driving investment in desalination and rain-harvesting adjuncts. Enterprise facilities that cannot amortize such capex are increasingly migrating to hybrid or public cloud, compressing their segment share but stimulating overall consumption at large, efficient hyperscale campuses. The Chile data center water consumption market thus sees scale tilt decisively toward cloud providers—albeit under sustainability constraints.
By Data Center Size: Mega Facilities Lead Efficiency
Large sites held 38.42% of 2024 demand; nevertheless, the mega-facility cohort will grow fastest at 19.56% CAGR. Concentrating IT load in >50 MW campuses unlocks economies of scale in advanced cooling and on-site desalination. Digital Realty’s Santiago campus employs pumped-refrigerant economizers that eradicate evaporative make-up, illustrating how scale enables higher upfront spend for lasting water savings. Conversely, small and medium facilities pivot to edge-computing niches with inherently lower thermal densities and therefore modest water reliance. Growth in mega formats ultimately magnifies the Chile data center water consumption market, even as per-rack usage falls.
Note: Segment shares of all individual segments available upon report purchase
By Region: Northern Chile Emerges as Growth Leader
Central Chile anchors 54.81% of current consumption, reflecting Santiago’s economic gravity and cable landing stations. Yet Northern Chile is on track for a 20.90% CAGR through 2030 thanks to desalination, renewable-energy abundance, and mining digitalization. Desal capacity in the Atacama corridor will rise from 1,620 L/s in 2024 to 9,177 L/s by 2028, providing a scalable non-potable source. Community resistance to freshwater withdrawals intensifies the pivot toward seawater solutions, thereby unlocking regional footprints previously constrained by aridity. Southern Chile, endowed with ample rainfall and cooler ambient temperatures, presents an emerging play; however, limited fiber and power infrastructure delay large-scale adoption in the short term.
Note: Segment shares of all individual segments available upon report purchase
Geography Analysis
Central Chile’s 54.81% dominance arises from dense fiber, power availability, and a mature vendor ecosystem clustered around Santiago. Amazon’s green-lit region and Google’s Humboldt cable landings reinforce the area’s role as a digital gateway apnews.com. Still, megadrought pressures elevate risk exposure, compelling existing operators to integrate recycled-water loops and partner with municipal treatment plants to secure supply.
Northern Chile is the Chile data center water consumption market’s fastest-growing geography, with a 20.90% CAGR. Mining firms’ long-standing investments in seawater pipelines offer a template for data centers to piggyback infrastructure. Solar irradiance surpasses 2,500 kWh/m²/year, yielding plentiful renewable power to run energy-intensive but water-thrifty mechanical-vapor-compression chillers. Permitting complexity tied to indigenous land rights necessitates proactive engagement strategies but does not outweigh the strategic lure of abundant desalinated flows.
Southern Chile brings moderate yet strategic potential. Abundant surface water and lower ambient temperatures naturally dampen WUE metrics. Pilot rain-harvesting systems in Los Lagos demonstrate feasibility for partial onsite supply, storing up to 40 m³ per roof-mounted array. However, latency concerns and limited submarine cable reach currently restrict hyperscale activity, positioning the region for future edge and disaster-recovery deployments that may expand in the second half of the decade.
Competitive Landscape
The Chile data center water consumption market features moderate concentration, with hyperscalers and global colocation brands sharing space with regional telecom operators. Amazon’s USD 4 billion platform leapfrogs competitors on scale, but Google’s decision to pause and redesign its Quilicura facility around ultra-low-water cooling sets a benchmark for stewardship. Equinix’s USD 705 million acquisition of Entel’s portfolio instantly expanded its footprint and unlocked capital to retrofit towers with recycled-water plants. Oracle’s dual-region strategy showcases compliance agility: both locations secured concessions that blend non-potable and desalinated feedstocks, de-risking operations from municipal rationing.
Technology differentiation intensifies as Nvidia-based AI clusters proliferate. Operators that can integrate direct-to-chip solutions and waste-heat recovery into aquaculture or district-heating loops gain competitive headroom. AWS’s global commitment to water-positive operations by 2030 exemplifies how transparency on consumption metrics becomes a contractual necessity. In sum, sustainable water designs now serve not only as license-to-operate qualifiers but also as commercial differentiators in winning cloud and colocation tenants, cementing water management as the axis of competition within the Chile data center water consumption market.
Chile Data Center Water Consumption Industry Leaders
-
Google, Inc.
-
Equinix Inc.
-
Ascenty (Digital Realty Trust Inc.)
-
Amazon Web Services, Inc.
-
Entel
- *Disclaimer: Major Players sorted in no particular order
Recent Industry Developments
- May 2025: Amazon announced a USD 4 billion investment to establish its first AWS infrastructure region in Chile, engineering cooling so that water is used only 4% of operating hours through advanced air systems and non-potable sources.
- December 2024: Chile’s Ministry of Science, Technology, Knowledge and Innovation launched the National Data Centers Plan targeting USD 2.5 billion in investments, embedding water-sustainability criteria in environmental assessments.
- September 2024: Google paused its Quilicura build to redesign cooling after a court required climate-impact analysis for aquifer withdrawals.
- July 2024: AWS secured environmental approval for its second Chilean facility, including closed-loop liquid cooling and 100% renewable-energy matching.
Research Methodology Framework and Report Scope
Market Definitions and Key Coverage
According to Mordor Intelligence, we define the Chile data-center water consumption market as the yearly volume of potable, recycled, and desalinated water withdrawn for cooling, humidification, fire suppression, and other facility utilities by every operational enterprise, colocation, and hyperscale data hall in the country.
Scope exclusions include construction-phase use, municipal distribution losses, and off-site power-plant water, which are all left outside this boundary.
Segmentation Overview
- By Source of Water Procurement
- Potable Water
- Non-Potable / Greywater
- Alternative Sources
- By Data Center Type
- Enterprise
- Colocation
- Cloud Service Providers
- By Data Center Size
- Mega
- Massive
- Large
- Medium
- Small
- By Region (Chile)
- Northern Chile
- Central Chile
- Southern Chile
Detailed Research Methodology and Data Validation
Primary Research
Analysts interviewed facility engineers, desalination plant managers, cooling equipment integrators, and regional regulators across Santiago, Antofagasta, and Concepción. These conversations verified reported withdrawals, calibrated Water Usage Effectiveness (WUE) ranges, and clarified ramp-up timelines for alternative water connections.
Desk Research
We began by mining open government records: General Water Directorate abstraction permits, Superintendence of Sanitary Services tariff bulletins, Ministry of Energy digital infrastructure surveys, and Subtel landing station files, which together map where centers sit and the volumes local utilities allocate. Our team then layered in operator sustainability reports, news archives from Dow Jones Factiva, company financials via D&B Hoovers, peer-reviewed WUE studies from Pontificia Universidad Católica, and white papers issued by the Chilean Data Center Council. The sources named are illustrative only; many additional publications were reviewed to validate and contextualize data.
Market-Sizing & Forecasting
Our 2025 baseline merges top-down and bottom-up logic. National withdrawal and tariff data are reconstructed into a demand pool and aligned with installed IT load, which is then sanity checked through sampled rack counts multiplied by average WUE. Key model drivers include announced hyperscale capacity, regional dry bulb temperature trends, desalination output growth, electricity to water intensity correlations, and utility tariff escalation. Forecasts to 2030 apply multivariate regression that links WUE improvement and megawatt growth in three scenario bands vetted through primary research. Where private facility data are missing, median WUE values from validated peers are applied and adjusted for cooling technology mix.
Data Validation & Update Cycle
Before sign-off, we triangulate outputs with Google, AWS, and utility disclosures; any variance beyond preset thresholds triggers secondary review, followed by a senior analyst audit. Reports refresh annually, with mid-cycle updates when events such as new desalination hookups materially shift the outlook.
Why Mordor's Chile Data Center Water Consumption Baseline Stands Firm
Published figures often diverge because some authors count only headline hyperscale projects, others apply design flow rather than actual draw, and many ignore desalinated or reclaimed sources.
Key gap drivers include scope limited to single facilities, outdated gallon to liter conversions, and the omission of colocation halls that Mordor fully captures through its disciplined refresh cadence and variable tracking.
Benchmark comparison
| Market Size | Anonymized source | Primary gap driver |
|---|---|---|
| 13.46 B L (2025) | Mordor Intelligence | |
| 7 B L (2025 planned) | Regional Consultancy A | Counts only one under construction hyperscale campus and treats design flow as total market need. |
| 0.39 B L (2023) | Trade Journal B | Uses a single operator's reported annual withdrawal, omitting colocation and enterprise sites. |
The comparison shows our full market view, grounded in verified utility data and yearly refreshes, delivers a balanced, transparent baseline that decision makers can replicate with confidence.
Key Questions Answered in the Report
What is the current size of the Chile data center water consumption market?
The Chile data center water consumption market stands at 13.46 billion liters in 2025 and is projected to grow rapidly to 31.80 billion liters by 2030.
Which water source segment is growing fastest?
Alternative sources—primarily desalinated seawater and recycled greywater—are expanding at a 21.43% CAGR, reflecting industry pivots to sustainability.
How is AI adoption affecting water needs in Chilean data centers?
High-density AI racks require liquid cooling that, while more thermally efficient, still adds to overall water demand; operators offset this by adopting closed-loop systems and non-potable supplies.
Why is Northern Chile important for future data center builds?
The region’s expanding desalination infrastructure, high solar resource, and mining-sector pipelines provide scalable non-potable water and renewable power that attract hyperscale projects.
Page last updated on:


