Brazil Data Center Water Consumption Market Size and Share
Market Overview
| Study Period | 2019 - 2030 |
|---|---|
| Forecast Data Period | 2025 - 2030 |
| Historical Data Period | 2019 - 2023 |
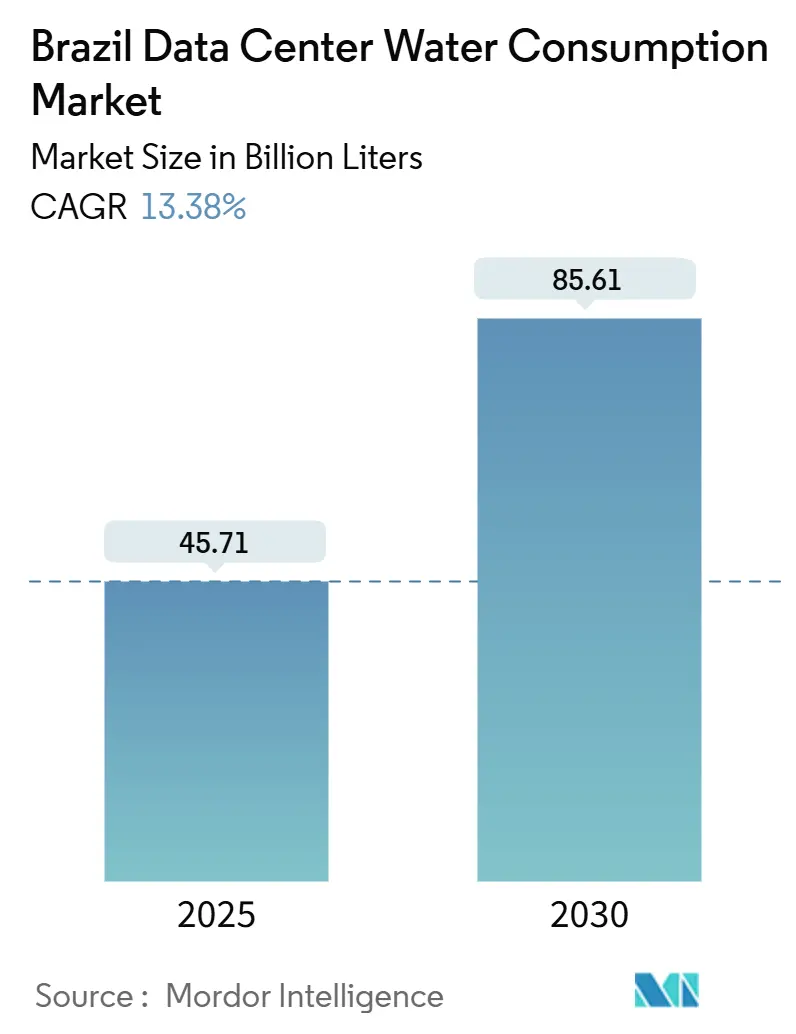
| Market Volume (2025) | 45.71 Billion liters |
| Market Volume (2030) | 85.61 Billion liters |
| Growth Rate (2025 - 2030) | 13.38% CAGR |
| Market Concentration | Medium |
Major Players *Disclaimer: Major Players sorted in no particular order Image © Mordor Intelligence. Reuse requires attribution under CC BY 4.0. | |
Brazil Data Center Water Consumption Market Analysis by Mordor Intelligence
The Brazil data center water consumption market reached 45.71 billion liters in 2025 and is forecast to climb to 85.65 billion liters by 2030, reflecting a 13.38% CAGR. Surging hyperscale investments, AI-centric compute loads, and supportive clean-energy policies together amplify water demand from cooling systems. Operators increasingly deploy direct-liquid cooling and closed-loop recycling to balance higher rack densities with sustainability targets. Regional buildouts remain concentrated in the renewable-rich North, yet rapid demand growth in the industrialized Southeast is redrawing supply-chain priorities. Meanwhile, potable water still dominates the sourcing landscape, but non-potable alternatives, including treated effluent, reclaimed rainwater, and groundwater, are expanding as licensing hurdles tighten during drought cycles.
Key Report Takeaways
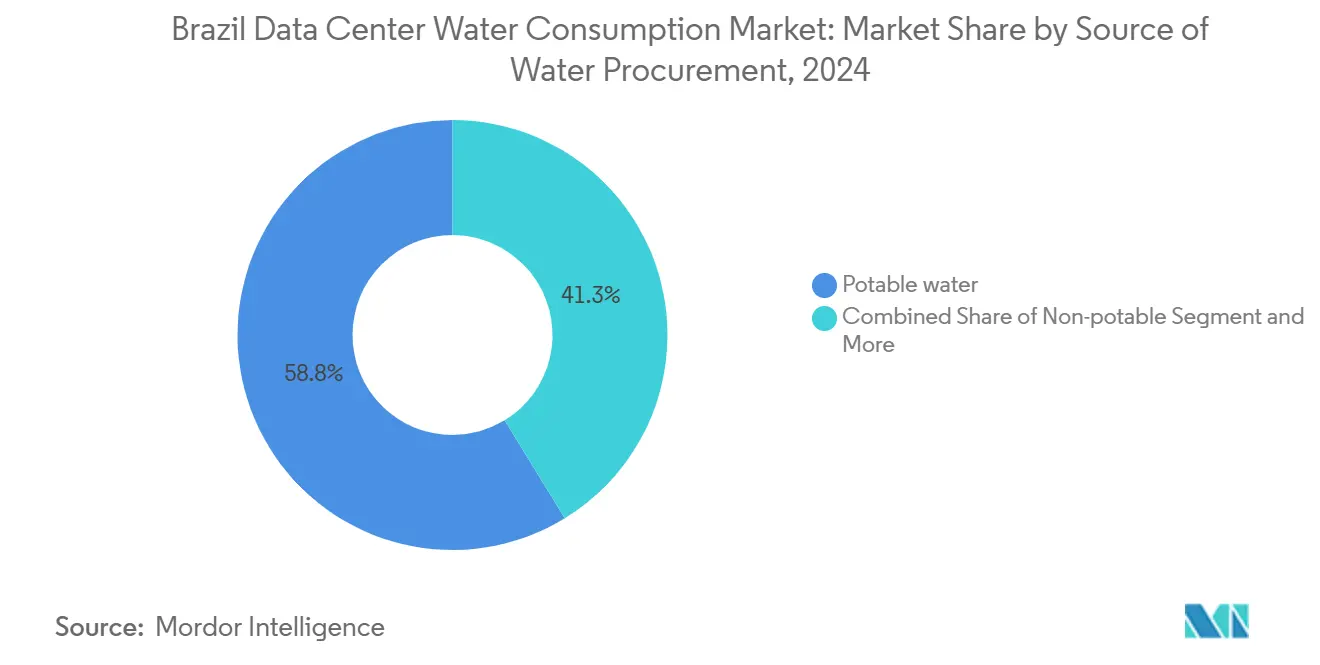
- By source of procurement, potable supplies accounted for 59% of the 2024 Brazil data center water consumption market share, while non-potable alternatives are projected to advance at a 14.4% CAGR through 2030.
- By data center type, cloud providers led with 48% of the 2024 Brazil data center water consumption market share; the segment is expected to grow at a 15.6% CAGR to 2030.
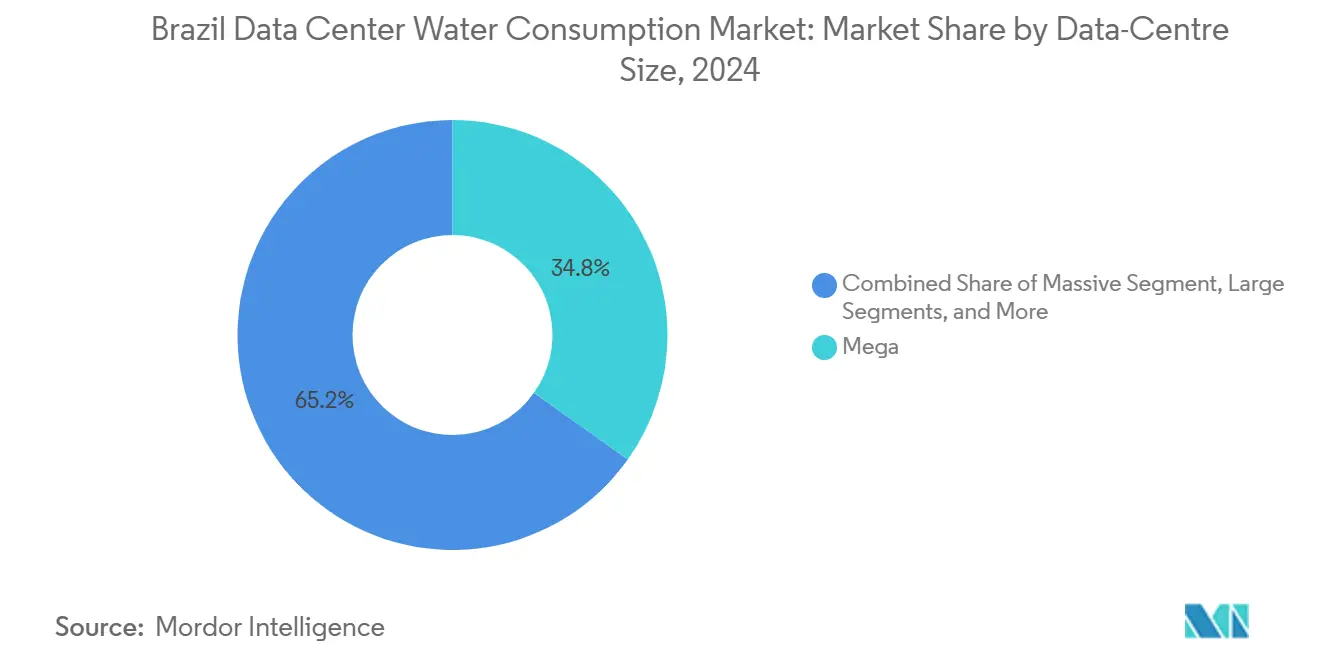
- By data centre size, mega-scale facilities held 35% of the 2024 Brazil data centre water consumption market share, yet massive-scale sites are projected to expand at a 14.8% CAGR between 2025 and 2030.
- By region, the North maintained a 41% share of the 2024 Brazil data center water consumption market, while the Southeast is expected to rise at a 16.1% CAGR through 2030.
Brazil participates in a competitive field that extends beyond its own borders. The market landscape in the global data center water consumption industry outlined by Mordor Intelligence covers that wider structure.
Brazil Data Center Water Consumption Market Trends and Insights
Drivers Impact Analysis*
| Driver | (~) % Impact on CAGR Forecast | Geographic Relevance | Impact Timeline |
|---|---|---|---|
| Surge in hyperscale and AI-centric data-centre build-outs | +3.2% | Southeast and North regions, with spillover to Northeast | Medium term (2-4 years) |
| Government incentives and abundant renewables attract FDI | +2.8% | National, with concentration in North and Northeast | Long term (≥ 4 years) |
| Corporate net-zero agendas boost WUE transparency | +1.9% | Global operators in Southeast and South regions | Medium term (2-4 years) |
| Shift to direct-liquid cooling raises rack-level water intensity | +2.1% | Mega and massive-scale facilities nationwide | Short term (≤ 2 years) |
| Regional water-tariff reforms spur grey-water sourcing | +1.4% | Southeast and South regions with established infrastructure | Long term (≥ 4 years) |
| Carbon-credit monetisation for "water-positive" projects | +0.8% | National, with early adoption in renewable-rich regions | Long term (≥ 4 years) |
| Surge in hyperscale and AI-centric data-centre build-outs | +3.2% | Southeast and North regions, with spillover to Northeast | Medium term (2-4 years) |
| Source: Mordor Intelligence | |||
Surge in Hyperscale and AI-Centric Data-Centre Build-Outs
Artificial-intelligence chips expel considerably more heat than conventional silicon, demanding water-intensive liquid cooling loops that can triple consumption per kilowatt. Amazon and Microsoft disclosed sharp global water-use uplifts as generative-AI clusters came online, trends echoed in Brazil where GPU-dense halls now dominate capacity additions. Even as operators adopt closed-loop chillers, absolute volumes rise because rack densities keep climbing. The Brazil data center water consumption market therefore expands in tandem with the country’s projected 9 GW of data-centre power demand by 2035.
Government Incentives and Abundant Renewables Attract FDI
Roughly 85% of Brazil’s electricity already comes from renewable sources, allowing investors to cite low-carbon footprints when defending higher water draw for next-generation cooling Fiscal breaks on imported equipment and priority interconnection queues further shorten payback periods. Northern states rich in hydro and wind resources court hyperscalers with tariff discounts, while local authorities expedite land concessions for “digital free zones”. These advantages keep large capital flows directed toward regions where surface-water permits are still available, reinforcing the growth arc of the Brazil data center water consumption market.
Corporate Net-Zero Agendas Boost WUE Transparency
Amazon pledged to become water-positive by 2030, and Microsoft reported a 39% improvement in Water Usage Effectiveness since 2021. Global scorecards now compel Brazilian sites to publish audited metrics, intensifying peer pressure. Digital Realty trimmed water-use intensity 14% and shifted 43% of its Brazilian cooling load to reclaimed supplies. Public disclosure catalyses design upgrades, yet it also legitimises fresh projects by proving that modern halls outperform legacy facilities, indirectly expanding the Brazil data center water consumption market.
Shift to Direct-Liquid Cooling Raises Rack-Level Water Intensity
Direct-to-chip loops dissipate heat more efficiently than air handlers, supporting 100 kW-plus racks essential for AI training. Digital Realty’s global retrofit program spans 170 halls and is rolling out across its São Paulo campus. Academic trials show liquid solutions can cut energy use up to 52% and water use up to 50% versus evaporative towers, yet overall consumption still rises when density multiplies.[1]Nature, “Energy and Water Implications of Direct-Liquid-Cooled Data Centers,” nature.com Adoption therefore delivers better efficiency without curbing absolute withdrawals, sustaining growth in the Brazil data center water consumption market.
Restraints Impact Analysis*
| Restraint | (~) % Impact on CAGR Forecast | Geographic Relevance | Impact Timeline |
|---|---|---|---|
| Drought cycles limit new abstraction permits | -2.1% | Northeast and North regions, with seasonal impact nationwide | Short term (≤ 2 years) |
| Absence of mandatory WUE disclosure hinders benchmarking | -1.3% | National, with particular impact on foreign operators | Medium term (2-4 years) |
| Community opposition and lawsuits delay site approvals | -1.8% | Northeast and drought-prone regions | Medium term (2-4 years) |
| Planned tax on industrial groundwater abstraction | -0.9% | National, with higher impact in water-scarce regions | Long term (≥ 4 years) |
| Source: Mordor Intelligence | |||
Drought Cycles Limit New Abstraction Permits
Brazil lost 400,000 hectares of surface water between 2022-2023, eroding buffer capacity for industrial uses.[2]Deutsche Welle, “Brazil’s Vanishing Water Bodies Threaten Industry and Cities,” dw.com Basin committees often suspend new extraction licenses during El Niño-driven dry spells, forcing operators to redesign cooling plans or delay site launches. The constraint hits hardest in Ceará and other semi-arid zones where hyperscalers seek renewable power yet face thin aquifers. Environmental-impact studies now routinely extend project timelines, tempering the Brazil data center water consumption market’s near-term acceleration.
Community Opposition and Lawsuits Delay Site Approvals
Regional activism has grown after high-profile protests in Uruguay and Mexico paused large builds over water fears.[3]The Guardian, “Latin American Communities Push Back on Data Center Water Use,” theguardian.com Brazilian residents cite those precedents to challenge permits, especially where agriculture competes for dwindling supplies. Litigation can stretch for 24 months, elevating financing costs and prompting some developers to pivot toward less contentious metro areas. While few projects have been cancelled outright, the risk premium curbs the Brazil data center water consumption market’s speed of expansion.
*Our forecasts treat driver/restraint impacts as directional, not additive. The impact forecasts reflect baseline growth, mix effects, and variable interactions.
Segment Analysis
By Source of Water Procurement: Non-potable supplies gain momentum
In 2024, potable sources provided 59% of withdrawals, equal to roughly 25.9 billion liters within the Brazil data center water consumption market size. Tightening license conditions and tariff incentives are steering operators toward reclaimed effluent, harvested rain, and shallow groundwater, helping non-potable volumes grow 14.4% CAGR to 2030. São Paulo’s Aquapolo scheme treats 86,400 m³ daily, illustrating the scale attainable when industry collaborates with utilities. Reverse-osmosis units now deliver cooling-grade water at R$ 2.90/m³ (USD 0.58).
Reclaimed options reduce freshwater stress but require complex on-site treatment, pushing capital outlays higher. Amazon has implemented effluent-based cooling at 20 global campuses and is scoping similar systems for its planned North-region availability zones. As regulatory reviews increasingly favour non-potable use, recycled-water pipelines are bundled into new-build master plans, embedding circular-economy principles at the heart of the Brazil data center water consumption market.


By Data-Centre Size: Massive-scale builds accelerate
Mega campuses controlled 35% of 2024 withdrawals yet face displacement by even larger sites optimised for AI workloads. Massive-scale halls should grow 14.8% CAGR, pushing their slice of the Brazil data center water consumption market size to roughly 33 billion liters by 2030. Scala Data Centers is developing a 54 MW “AI City” that relies on a closed-loop chiller plant targeting zero net water use.
Large and medium sites serve regional carriers and content networks, where modular cooling helps phase capex. Edge nodes remain small users today but could multiply as 5G and autonomous-vehicle data rise; their cumulative pull could become material for municipal planners tracking urban water balances.
By Data-Centre Type: Cloud providers strengthen lead
Cloud operators held 48% expenditure in 2024, translating into 22 billion liters within the Brazil data center water consumption market share and rising at 15.6% CAGR. Their hyperscale economics support proprietary grey-water plants and AI-optimised cooling stacks that smaller enterprise halls cannot match. Microsoft’s zero-water adiabatic project blueprint is slated for its next São Paulo availability zone, underpinning corporate climate pledges.
Enterprise facilities, although mature, adopt cloud-style retrofits to remain competitive on sustainability audits. Colocation landlords now advertise transparent WUE dashboards and offer client-level metering to court fintech tenants subject to ESG scrutiny. The Brazil data center water consumption market therefore sees converging standards across facility classes, with cloud archetypes setting the bar on stewardship.
Geography Analysis
Brazil’s regional water-consumption profile mirrors the tension between renewable abundance and freshwater scarcity. Northern facilities lean on hydro-electric baseloads yet endure river-level swings that complicate withdrawal planning; operators there invest in large buffer reservoirs and predictive hydrology models. Community dialogues with indigenous groups have become standard practice, a prerequisite for license extensions in rain-forest corridors.
The Southeast’s rapid digitalisation fuels sustained traffic growth, compelling colocation providers to stack new phases atop existing São Paulo campuses. Municipal utilities cooperate by piping tertiary-treated effluent directly to chillers, and tariff structures reward year-on-year WUE improvements. However, the same corridor houses automobile and petrochemical plants, intensifying political scrutiny of industrial water claims.
In the Northeast, Ceará’s wind belt lures AI-scale builds seeking renewable electrons, yet planners must reconcile 10-month dry seasons with the sector’s cooling thirst. Pilot sites test air-assisted liquid cooling that lowers evaporative load by 40%, an approach gaining regulatory favour. Federal programmes now fund regional desalination pilots that could later supply tech clusters, hinting at future resilience pathways for the Brazil data center water consumption market.
Mordor Intelligence provides coverage of the data center water consumption market across other key regional markets, including North America, South America, and Europe, each with their regulatory frameworks and demand patterns. Detailed country-level analysis extends to Canada, Mexico, Spain, Netherlands, Chile, and United States incorporating local coverage and market participation, as required.
Competitive Landscape
The market displays moderate consolidation as global majors snap up local specialists to secure capacity and water permits. Digital Realty’s USD 1.8 billion purchase of Ascenty embedded global environmental protocols into Brazil’s largest neutral platform. Amazon, Google, and Microsoft leverage global procurement to deploy high-efficiency chillers unavailable to smaller peers. Their scale also underwrites on-site treatment plants able to switch between potable, reclaimed, and harvested sources on demand.
Domestic challenger Scala raises USD 500 million to introduce zero-water blueprints, aiming to out-innovate foreign incumbents on environmental metrics. Meanwhile, utility-adjacent developers such as V.tal tie fibre backbones to renewable micro-grids and groundwater concessions, bundling connectivity and sustainability as a single service. Technology partnerships with membrane-filtration firms help differentiate offers and mitigate drought risk.
Competition increasingly centres on transparent WUE reporting and community engagement. Operators publish hourly dashboards, invite NGOs to audit consumption, and sponsor watershed restoration to offset draw. Facilities unable to document climate resilience risk financing penalties as ESG-linked credit lines dominate infrastructure funding. These dynamics reinforce responsible stewardship as the key competitive lever in the Brazil data center water consumption market.
Brazil Data Center Water Consumption Industry Leaders
Microsoft Corp.
Amazon Web Services (AWS)
Google LLC
Equinix Inc.
Ascenty (Digital Realty)
- *Disclaimer: Major Players sorted in no particular order


Recent Industry Developments
- June 2025: Amazon expanded reclaimed-wastewater cooling to additional availability zones, extending its program to 24 global sites as AI growth drives higher thermodynamic loads.
- May 2025: TikTok unveiled plans for a mega campus in drought-prone Ceará, sparking public debate on water allocations for industrial projects.
- March 2025: A media exposé highlighted that Brazil’s 60 operational data centres and 46 pipeline builds could out-consume several midsize cities, prompting calls for stricter usage caps.
- January 2025: Elea Data Centers began a São Paulo expansion featuring modular chiller units with integrated rainwater harvesting to support AI clusters without raising municipal withdrawals.


Brazil Data Center Water Consumption Market Report Scope
Brazil Data Center Water Consumption Market Report is Segments by Source of Water Procurement (Potable, Non-potable, Alternate sources), Data-Centre Type (Enterprise, Colocation, Cloud Service Provider (CSP)), Data-Centre Size (Mega, Massive, Large, Medium, Small), and by Region (Southeast, South, Northeast, North, Centre-West). The Market Forecasts are Provided in Terms of Volume (Liters).
| Potable (municipal / private utilities) |
| Non-potable (treated sewage / recycled) |
| Alternate sources (ground-, surface-, sea- and rain-water, O&G by-product) |
| Enterprise |
| Colocation |
| Cloud Service Provider (CSP) |
| Mega |
| Massive |
| Large |
| Medium |
| Small |
| Southeast |
| South |
| Northeast |
| North |
| Centre-West |
| By Source of Water Procurement | Potable (municipal / private utilities) |
| Non-potable (treated sewage / recycled) | |
| Alternate sources (ground-, surface-, sea- and rain-water, O&G by-product) | |
| By Data-Centre Type | Enterprise |
| Colocation | |
| Cloud Service Provider (CSP) | |
| By Data-Centre Size | Mega |
| Massive | |
| Large | |
| Medium | |
| Small | |
| By Region | Southeast |
| South | |
| Northeast | |
| North | |
| Centre-West |


Key Questions Answered in the Report
How large is the Brazil water consumption market for data centers today?
The Brazil water consumption market size reached 45.71 billion liters in 2025 and is projected to hit 85.65 billion liters by 2030.
Which region is growing fastest in data-centre water use?
The Southeast region, led by São Paulo, is expanding at a 16.1% CAGR as enterprises require low-latency cloud and AI services.
What cooling technology is driving higher rack-level water intensity?
Direct-liquid cooling supports 100 kW-plus racks needed for AI training but uses up to triple the water per kilowatt compared with legacy air systems.
How are operators mitigating water scarcity risks?
Strategies include reclaimed-effluent cooling loops, rainwater harvesting, closed-loop chillers, and zero-water adiabatic systems that recirculate or eliminate evaporative losses.
Page last updated on:


